
10.4 Quantifying Human Error Probability (HEP)
HEP is defined as the probability that when a given task is performed, an error will occur. This should not be confused with “human reliability,” that is, the probability that the task will be correctly performed.
Like other parts of the HRA, there are several methods for quantifying the HEP. One of the most common methods is through use of the technique for human error rate prediction (THERP) tables provided in NUREG/CR-1278, “Handbook of Human Reliability Analysis with Emphasis on Nuclear Power Plant Applications.” These tables provide HEPs and the other necessary information to quantify HEPs in many activities.
If HEP values are not in NUREG/CR-1278 then other sources that may be used are as follows:
- Historical Data. This could be for the specific activity or similar activities.
- Expert Advice. Personnel with experience in performing HRAs can be consulted to obtain their estimation of the HEP.
- Testing. Simulations of the activity can be performed and data collected.
- Other Literature. There have been numerous PRAs performed on various processes. Data for same/similar activities can be used.
The HEP value used for the step must be recorded, including the source of the HEP. This can be done on the HRA event tree or in table format.
THERP tables will be used as a source to continue the example (Table 10.2).
Table 10.2 THERP Tables
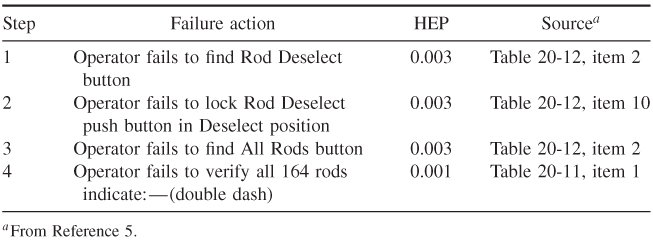
It must be noted that item 2 of THERP Table 20-12 states “Select wrong control on a panel of similar appearing controls identified by labels only.” The other choices on the table are controls that are arranged in well-delineated functional groups and controls that are part of a well-defined mimic layout. To choose the most correct item, the analyst must refer back to the photographs, drawings, and sketches that were made of the panel layout. In this case, the switches are laid out as shown on Table 10.3.
Table 10.3 Control Switches

The switches are color coded but the color is only visible when they are lit. The All Rods push button only lights up when depressed. The Rod Deselect push button lights up in the Deselect position. There are no specific instructions as to position of the switches during normal operations.
For the verification of all rods, the operator must look at a well-laid out mimic of the control rods relative positions to each other. The background is flat black and the indication lights (light-emitting diodes, LEDs) are orange. Normally, the LEDs show a number that is representative of the rod position for any rods that are selected. If no rods are selected, the display is blank. During a SCRAM, an emergency shutdown of a nuclear reactor, the indication shows the double dashed line as the position for each rod.
The shift technical advisor (STA) using the computer also checks the position of the control rods.
Other factors, commonly called performance shaping factors (PSFs) need to be considered. These are things such as use of a checkoff procedure, lighting, switch-layout, experience, time pressure, dependence, and so on.
The example considers the following PSFs:
Table 10.4 Total HEP Calculations
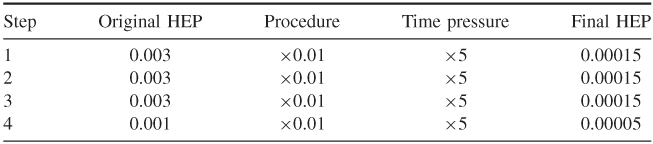
To calculate the total HEP for the task, the HEPs originally determined for the steps must be modified by the factors described above.
The total HEP for a sequence is either the sum or the product of the individual HEPs. Looking back at the sequence laid out in a logic tree, it can be seen that the steps in the Verify Rods Inserted sequence are connected as an AND statement. Therefore, the product of the individual HEPs is the HEP for the Verify Rods Inserted. This value is
![]()
It is clear that this is a very small probability of failure.
If the actions are connected by OR statements then the total HEP is the sum of the HEPs for the individual steps.
A factor that may need to be considered in some sequences is dependence. Dependence is the relationship between the tasks. Chapter 10 of NUREG/CR-1278 provides a thorough discussion of how to determine dependence. In our example, although there is an independent check performed, dependence does not need to be considered, that is, because the STA check does not verify that the operator did the Verify Rods Inserted task. It only verifies that the rods are fully inserted. Dependence would exist if:
- second person verified any of the steps that the operator did, as he did them; or
- the STA check in some way verified the operator had done his check.
If the check is performed on each step then the dependence PSF is applied to each step. If the check is performed at the end (i.e., on the entire sequence) then the dependence PSF is applied to the HEP for the sequence (6).
10.4.1 Summary Points
- HEP is defined as the probability that when a given task is performed, an error will occur.
- HEP values may come from NUREG/CR-1278, historical data, expert advice, testing, or other literature.
- The HEP value used for the step must be recorded, including the source of the HEP value.
- PSFs need to be considered. They may apply to the HEP values for the individual steps or the HEP value for the sequence.
- For sequences logically connected using AND gates, the HEP values are the product of the individual HEP values.
- For sequences logically connected using OR gates, the HEP values are the sum of the individual HEP values.