
11.2. Performance and Optimization
An important step before releasing your application to the world is to ensure that the application's performances are acceptable. This section briefly provides pointers to do just that.
11.2.1. Measuring Performance
Because it is said that premature optimization is the root of all evils, you first must determine how well your application performs and identify where possible bottlenecks exist. In other words, you need to be able to benchmark and profile your application.
Several tools are available to measure the performance of your applications. The first most obvious approach is to check your production logs.
Remember, applications running in development mode are usually much slower than in production mode. You can run ruby script/server -e production or uncomment ENV['RAILS_ENV'] ||= 'production' in your configenvironment.rb file, to ensure that the application will run in production mode.
11.2.1.1. Reading Logs
Each entry within the logs provides timing information. Prior to Rails 2.2, the logs would report the throughput for the request (the number of requests per seconds as shown here):
Processing ArticlesController#index (for 127.0.0.1 at 2009-01-04 03:49:51) [GET]
  Session ID: f88e2cf214faf1ad32c8c3564900828a
  Parameters: {"action"=>"index", "controller"=>"articles"}
Rendering template within layouts/articles
Rendering articles/index
Completed in 0.01900 (52 reqs/sec) | Rendering: 0.00800 (42%) | DB: 0.00100 (5%) |
200 OK [http://localhost/]
In Rails 2.2, this has been changed to report the amount of time for each request:
Processing ArticlesController#index (for 127.0.0.1 at 2009-01-04 04:01:26) [GET]
Rendering template within layouts/articles
Rendering articles/index
Completed in 62ms (View: 62, DB: 0) | 200 OK [http://localhost/articles]
Notice how the rendering time is separated from the database processing time to help you identify which of the two may cause slowdowns.
Though it is tempting to think in terms of requests per second, it's far more effective to consider the actual amount of time per request. For example, imagine that the throughput for a given action is 1000 reqs/s. Bringing this to 2000 reqs/s may seem like a great accomplishment, because you "doubled the performance." In reality, you simply went from 1 millisecond per request to half a millisecond per request. Sure, you'll be able to serve more requests and that's a good thing, but under a regular load no user is going to notice the difference.
In other words, this new approach invites developers to go after real bottlenecks and slow actions as opposed to prematurely trying to optimize what really doesn't need to be optimized.
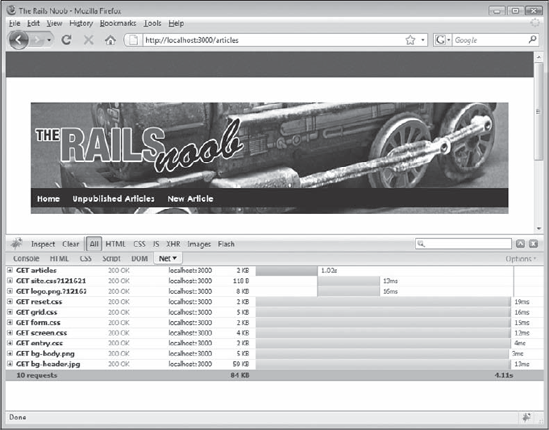
This becomes self-evident if you use the Firebug extension for Firefox (or equivalent). This add-on has a Net panel that breaks down the amount of time required to load a page. As soon as you start using it, you'll immediately see how milliseconds spent within the Rails stack to respond to a request are only a minimal part of the whole process of loading the page client side (as shown in Figure Figure 11-1). Of course slow queries (or rendering times) need to be fixed, but just remember to pick your battles.
If you want to time and log a specific snippet of code in your model, controller, or view, you can use the benchmark method. This method is available in three flavors, depending on where you intend to use it.
Use benchmark defined in ActionController::Benchmarking::ClassMethods to benchmark blocks within your controllers. For the view, use the helper version defined in ActionView::Helpers::BenchmarkHelper:
<% benchmark("Process TPS reports") do %>
  <%= process_reports %>
<% end %>
Figure 11.1. Figure 11-1
This will add something like "Process TPS reports (1331.2ms)" to your log. Finally, for models, use the benchmark class method defined by ActiveRecord::Base.
11.2.1.2. Other Tools
If you are familiar with the *nix world, you can use tools like grep (available on Windows through Cygwin) to data mine your logs, rather than manually reading them.
Even better, you can use a log analyzer. Two common choices are the Production Log Analyzer (available at http://rails-analyzer.rubyforge.org) and the Request Log Analyzer (available at http://github.com/wvanbergen/request-log-analyzer).
Another set of tools for measuring performance and profiling your Rails applications is RailsBench, available on RubyForge at http://railsbench.rubyforge.org. Patching the Ruby interpreter with a patch (available at the same URL) that improves the garbage collector (aka GC) is unfortunately a requirement.
ruby-prof is a fast profiler for Ruby that acts as a replacement for the slow built-in one available through the option -r profile. It can be installed via gem install and provides a series of reporting options (for example, flat, graph, HTML graph, and so on). This is often used to profile Rails applications as well, as described in the helpful documentation at http://ruby-prof.rubyforge.org.
You'll also notice that in the script folder of your Rails applications there is a performance folder containing three scripts: benchmarker, profiler, and request. These are provided for convenience and can be used to quickly benchmark, profile, and simulate a number of requests.
For example, you could run the following to compare two expensive (equivalent) methods and evaluate which one is the fastest (with 100 iterations):
ruby script/performance/benchmarker 100 'Article.method1' 'Article.method2'
            user     system      total        real
#1      0.842000   0.031000   0.873000 (  0.881000)
#2      0.874000   0.094000   0.968000 (  0.948000)
Likewise, you could run the profiler for a single method. This will automatically use Ruby's built-in profiler or the ruby-prof extension mentioned earlier, if installed. The quantity of information outputted by the profiler is admittedly overwhelming, but it's usually enough to focus on the top entries to spot unusually slow calls:
ruby script/performance/profiler 'Article.method1' 1000 flat
Loading Rails...
Using the ruby-prof extension.
Thread ID: 33481630
Total: 1.629000

 %self     total     self     wait    child    calls  name
  8.78      0.42     0.14     0.00     0.28     5000  Integer#times-1
(ruby_runtime:0}
  7.00      0.11     0.11     0.00     0.00    28000
<Module::SQLite3::Driver::Native::API>#sqlite3_column_text (ruby_runtime:0}
  6.63      0.18     0.11     0.00     0.08     4000  Hash#each_key
(ruby_runtime:0}
  6.51      0.33     0.11     0.00     0.23       17  Kernel#gem_original_require-1
(ruby_runtime:0}
  4.36      0.07     0.07     0.00     0.00     5000
<Module::SQLite3::Driver::Native::API>#sqlite3_step (ruby_runtime:0}
  3.87      0.06     0.06     0.00     0.00     5023  Array#flatten
(ruby_runtime:0}
  3.50      0.68     0.06     0.00     0.63     5000  SQLite3::ResultSet#next
(d:/Ruby/lib/ruby/gems/1.8/gems/sqlite3-ruby-1.2.3-x86-
mswin32/lib/sqlite3/resultset.rb:89}
  3.31      0.05     0.05     0.00     0.00       98  <Class::Dir>#[]
(ruby_runtime:0}
  2.82      0.15     0.05     0.00     0.11     8090  Array#each (ruby_runtime:0}
Finally, the request script allows you to benchmark or profile on a per-request basis. This requires the name of a file containing the request script. For example, the simplest script possible would be the following:
get '/'
And this could be run (for 200 times) as follows:
ruby script/performance/request -n 200 home.rb
Warming up once
0.32 sec, 1 requests, 3 req/sec

Profiling 200x
`gem install ruby-prof` to use the profiler
NOTE
If you install ruby-prof, be warned that unless you also patch the garbage collector with the patch mentioned previously, this script will crash the Ruby interpreter on Windows. In fact, some of the features of ruby-prof require the GC fix. And building Ruby from source on Windows in order to patch it is a less than straightforward process. My advice is to avoid using this particular script on Windows or simply miss the profiling functionality it provides.
You shouldn't worry about this script that benchmarks and profiles integration tests, because it has become deprecated in Rails 2.3. If you intend to use it in the next version of Rails (2.3), you should install the request_profiler plugin, which provides the same functionality.
For further information about benchmarking and profiling, including how to write performance tests, I recommend that you read the official Performance Testing Rails Applications guide available online at http://guides.rails.info/performance_testing.html. You may also want to check out the following blog post about how to profile Rails applications: http://cfis.savagexi.com/2007/07/10/how-to-profile-your-rails-application.
Should the URL no longer be valid by the time you read this page, simply visit the newly announced portal for Rails guides, available at http://guides.rails.info. There you will find all the new versions of the guides mentioned throughout this book, and new ones that are being written and are already updated to the latest version of Rails. Alternatively, you can always rely on the guides produced for your version of Rails, by generating them with rake doc:guides. As you probably know by now, they will be placed in the doc folder of your application.
11.2.2. Commercial Monitoring
Using some of the tools mentioned in the previous sections, you should be able to resolve performance and scalability issues before your application goes into production. Slow queries, sluggish helpers, and far too complex routes can all be caught early on. Once that job is done and your application has been deployed into production, the second part of the equation becomes monitoring its performance while it's live, up, and running.
You can still use log analyzers of course, but a few companies emerged to tackle the challenge of making it easy to make sense of the overwhelming amount of information available in your logs (and more). Three well established names are New Relic, FiveRuns, and Scout.
FiveRuns has a very interesting blog that features "Rails TakeFive" interviews with prominent Ruby and Rails members of the community. You can find it at http://blog.fiveruns.com.
New Relic (http://newrelic.com) offers a service called RPM. After installing a plugin and choosing your subscription plan, it automatically monitors your application and provides you with detailed and helpful reports about the performance of your application. Its lite version is free and provides basic reporting.
FiveRuns (http://fiveruns.com) offers two products, TuneUp and Manage. The former is free and it's aimed at monitoring the application during development, before it goes into production. The latter, its commercial offering, is similar to New Relic RPM in scope, and aims at monitoring and identifying performance drops in Rails apps running in production.
Finally, Scout (http://scoutapp.com) offers a very similar service to New Relic RPM and FiveRuns Manage, and allows you to sign up for your first server for free. Commercial plans allow you to add more servers, longer data retention for the output of the plugin, and more frequent reporting intervals.
All three commercial services have achieved a great deal of interest in the Rails community and are widely used. If you are interested in this type of service, I highly recommend that you try them before you decide which one works best for you.
11.2.3. Caching
When talking about performance we can't fail to mention caching. Caching is a necessary evil. For instance, it makes your application harder to test and to debug. All things considered, though, caching can grant you a huge performance boost. Instead of repeating slow operations in the back-end, the result of the computation is calculated once and stored in the cache where it will be easily retrieved at the next request.
Taking ActionPack into consideration, three levels of caching are available: page caching, action caching, and fragment caching. In order to use any of these, you'll need to have caching enabled in your environment's configuration files. By default, this is disabled in development and test mode, but enabled in production:
# In production mode
config.action_controller.perform_caching = true
Page caching caches a whole page within a static file on the server's filesystem. Because this is saved by default as an HTML file in public, at the next request for that page, the HTML file will be served bypassing the whole Rails stack de facto. This type of caching has the advantage of being extremely fast, because at each request for the same page, you'll be serving a static file.
Sadly, there are a few disadvantages as well. If a page has dynamic content that changes often, it shouldn't be cached in this way. Likewise, if a page needs to be protected by authentication, page caching cannot be used. Perhaps more importantly, the biggest drawback is that expiring the cache is not automated because the cached files (for example, public/show.html) are regular HTML pages and will be happy to stay there forever unless they are removed somehow.
Page caching is performed by using the caches_page method in your controllers:
caches_pages :index
Expiring pages can be achieved by adopting special observers known as Sweepers or strategically using the method expire_page:
def create
  #...
  expire_pages :action => :index
end
Action caching is very similar to page caching, but it doesn't serve the cached file directly. Instead, ActionPack handles the request allowing you to run before filters and other rules to satisfy authentication and other requirements. Its usage is analogous to page caching:
# Caches the edit action
caches_action :edit

# ...

# Expires the edit action
expire_action :action => :edit
Finally, the third type of cache is fragment caching and it's aimed at allowing you to cache certain parts of the page, whenever caching the whole page is not possible. This is usually the case with highly dynamic pages that have several "moving parts" that cannot all be cached or expired at the same time. Fragment caching is also an easy way to speed up the process of serving more static content, like a navigation menu or regular HTML code.
To perform fragment caching you can use the cache helper:
<% cache do %>
  <%= render :partial => "sidebar" %>
<% end %>
This helper also accepts an :action and an :action_suffix that you can use to identify fragments, whenever you want to cache multiple fragments for an action. Expiring them can then be accomplished through the expire_fragment helper.
Outside of the realm of ActionPack, the M component of the MVC triad has caching as well. In fact, ActiveRecord has built-in caching capabilities and the results of every SQL query already executed within the lifespan of an action are cached. So if you perform the same query more than once within an action, the database will only be hit once.
For further details about caching, I highly encourage you to read the official guide, "Caching with Rails," available online at http://guides.rubyonrails.org/caching_with_rails.html.
NOTE
As an exercise, try to add various forms of caching to the sample blog application and benchmark the application to see their effect.
11.2.4. Application-Level Performance Considerations
Before moving on to the "Deploying Rails" section, I'd like to leave you with a few additional bits of advice, in what can be considered an incomplete checklist or a list of common mistakes/pitfalls:
Don't go randomly looking for places where you should optimize your code, but rather put your trust in the profiler (and in running benchmarks).
Caching is not your friend, but a necessary acquaintance. A judicious and conservative use of caching is necessary and can do wonders to improve your application's responsiveness and ability to handle heavy loads.
Most of the code that you write when developing in Rails is Ruby code. Ruby is not the fastest language out there so it's important that the code you write is reasonably efficient.
Rails' routing system can be quite slow. Simplify your routes and avoid complex ones.
Define indexes on large tables for fields that are commonly looked up.
ActiveRecord is a nice abstraction layer, but don't forget that you have a full-blown relational database at your hands—don't be afraid to use it. This means that even if certain features are not available in ActiveRecord, you shouldn't hesitate to use them, because they're able to give you a much needed performance boost. Depending on the database system you are using, your requirements, and the bottlenecks you are experiencing, this could mean using stored procedures, triggers, parametric queries, actual foreign key constraints, hand-tuned SQL queries through find_by_sql, and so on.
If you are retrieving a larger record only to use a very small portion of it, you should use the :select option to limit the set of returned fields and therefore the resultset size.
Eager load your associations using :include. This will also prevent the 1+N problem discussed in Chapter 7.
Avoid combining deeply nested :includes with :conditions because this leads to the generation of slow and very hefty sized SQL queries.
Don't use length to retrieve the size of an associated collection of objects. For example, use user.comments.size or user.comments.count instead of user.comments.length. The reason for this is that the first two formulate a COUNT(*) query, whereas length will retrieve all the records and then count them with the Array instance method length. That's extremely inefficient.
Related to the previous point, consider using counter caches. These are fields that can be used to automatically keep track of the associated record's count, without having to query the database every time. In a scenario where Article and Comment are your models, you could, for example, define a comments_count integer column with default 0 in the articles table, and have belongs_to :article, :counter_cache => true within the Comment model. Be aware that size and count are not aliases when using counter caches. size is the only one that will look at the cache value stored in comments_count and as such it won't hit the database. length and count's behavior is the same as described in the previous point.
When appropriate, group multiple queries within a transaction. Furthermore, if you need to import a great deal of data, consider using the ar-extensions gem, which adds an import class method to ActiveRecord::Base, which is ideal for bulk updates.
Review the performance considerations made in Chapter 7, in regards to the available session stores.
Don't make your user-defined helpers bloated. Try to make them small and efficient, particularly those that will end up being executed multiple times by loops and iterators within your view.
Keep your controllers lean and delegate your data-related heavy lifting to the model layer.
Rails 2.3 will take advantage of a middleware feature codenamed "Metal." Whenever you are creating a service where every millisecond counts and you need raw performance, Metal will be a good fit. This new feature is essentially a wrapper that goes around Rake's middleware. Rake is a thin layer that provides an interface between Ruby-enabled Web servers and Ruby frameworks. As such, Metal lets you be "closer to the metal" and bypasses most of the Rails stack. You can read more about it in the official announcement at http://weblog.rubyonrails.org/2008/12/17/introducing-rails-metal.
Merb is a clone of Rails that's aimed at being very modular, because it allows users to choose what components should form the MVC stack. More relevantly to this chapter, it aims at improving performance by optimizing the implementation of many Rails parts. Luckily for both communities, the two projects have joined forces and merged into what will soon become Rails 3.0. This means that you can expect future versions of Rails to be faster and more modular. Likewise, the community is slowly moving toward Ruby 1.9.1, which is a much faster version of the main Ruby interpreter. Once it becomes widely adopted, Ruby 1.9.1 will no doubt help give your applications a boost in speed.
Install the YSlow extension for Firebug, available at http://developer.yahoo.com/yslow. This checks your site against a set of guidelines for improving the performance and responsiveness of your Web pages, as shown in Figure 11-2. Those guidelines are not Rails-specific, but rather best practices for most sites, particularly those with heavy traffic.
Figure 11.2. Figure 11-2
