In This Chapter
Outputting tables and images to the printer
Outputting information to a databases
Outputting tables and images to SPSS Viewer
Outputting to Excel, Word, and other applications
SPSS is good at analyzing your data and displaying information that's easy to understand in tables, charts, and graphs — but the time comes when you want to output the results to files suitable for use in other applications. You may want to send output to the printer, or you may have another program that could make use of the output from SPSS. This chapter explains ways that you can output data from SPSS in the particular forms that other programs need.
The simplest form of output is to print the numeric rows and columns of the raw data as it appears in the Data View tab of the Data Editor window. To do so, choose File
Tip
If you're not sure what your output will look like, you can choose File
If the table you're printing is too wide to fit on the sheet of paper, SPSS splits the output and places the table on multiple pages. You can hold the printed sheets side by side to get the full width of the table.
If you want to print the variable definitions, you can switch from the Data View tab to the Variable View tab before printout. This output always requires two pages because it includes the full width of the table.
You can export SPSS data directly to a database. Choose File
To export the data, simply follow the on-screen instructions for selecting the variables to be written and for choosing whether to append new data or to overwrite existing data.
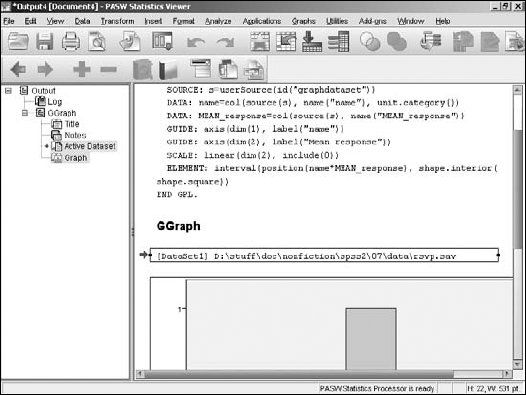
Whenever you run an analysis, produce a graph, or do anything that generates output (even loading a file), the SPSS Viewer window pops up automatically to display what you've created. This display is the most fundamental form of output from SPSS and is the first step in producing other forms of output.
Chapters 9 through 14 provide details about generating tables, graphs, and descriptive text in the SPSS Viewer window. These chapters describe how to output Viewer data to files in different formats.
You can output data from SPSS Viewer in several file formats appropriate for use by other applications. Some output formats are graphics only, some are text only, and others are a mixture of text and graphics. Some form of graphic output is usually necessary because of the graphs and charts constructed by SPSS.
In every case, you begin by choosing File
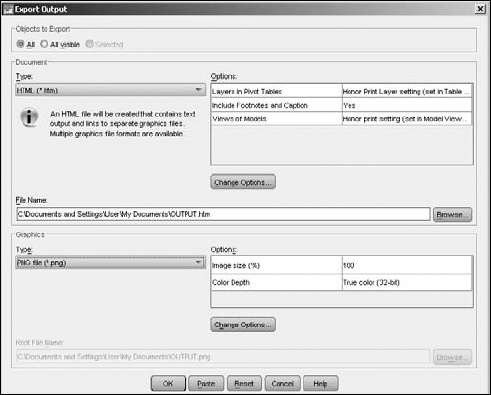
At the very top of the dialog box, you can select which pieces of information in SPSS Viewer you want to include as part of the output:
All: This option outputs all the information that SPSS Viewer contains, whether or not the information is currently visible.
All Visible: This option includes only those objects being displayed by SPSS Viewer.
Selected: This option allows you to select which objects to output.
Warning
The set of selections made available to you in Export Output is determined by the types of objects being displayed by SPSS Viewer, which (if any) are selected, and the choice in the Export drop-down list. The only combinations of options available are those that produce output.
Figure 8-2 shows a SPSS Viewer window displaying both text and graphics. On the left is a list of names of objects. If the name of an object is visible in the list, the object itself is visible in the Viewer window. You can make objects appear and disappear by clicking the plus and minus signs. If the name of an object is highlighted in the list, the object is marked as selected in the Viewer window; a selected object appears surrounded by boxes. (In the figure, the log, title, and notes at the top are not selected, but the other objects are.) When producing output, you can select to export only visible objects, only selected objects, or all objects.
You can output the following types of files:
Some formats (for example, the text-file format) require that graphics be output in separate files; you can also elect to output only graphics files. Graphics can be output in the following formats:
Standard jpeg (JPG)
Portable network graphics (PNG)
Postscript (EPS)
Tagged image file format (TIFF)
Windows bitmap (BMP)
Enhanced metafile (EMF)
If you decide to format your output file as a Web page, the output text will be formatted as HTML. Any pivot tables selected for output will be formatted as HTML tables, and any images to be output will be written to separate files in the image format of your choice (a description of the image-file options appears at the end of this chapter).
You can make a number of decisions about the details of the HTML file, as shown in Figure 8-3; they appear when you click the Change Options button for the Document in the Export Output dialog box.
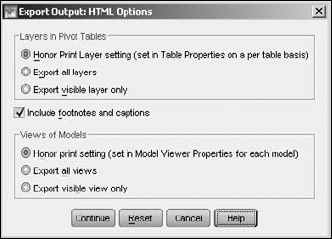
The first options to set are the layers in pivot tables. Some pivot tables have more than two dimensions, and the other dimensions are presented as multiple displayable layers. By setting this option, you can include or exclude layers in the HTML file — if you have a multilayered table, you'll probably have to experiment with this setting to get desirable results.
A pivot table can have multiple headings and footnotes. You can choose to have the footnotes and headings included or excluded.
The on-screen view is not the only one available. You have the option of including all views in the output or showing only the view that is currently visible.
Figure 8-4 shows part of the output page as it appears in a Web browser — using the default settings for everything, including the JPEG image. Notice that the commands that generated the graphics were included and formatted in an HTML table. You may decide to leave that information out. You could, if you want, leave the table out and include only the graphic and its annotation. Also, if you were going to publish this as a Web page, you would probably want to edit the heading so it's something other than the name of a working directory on your local machine.
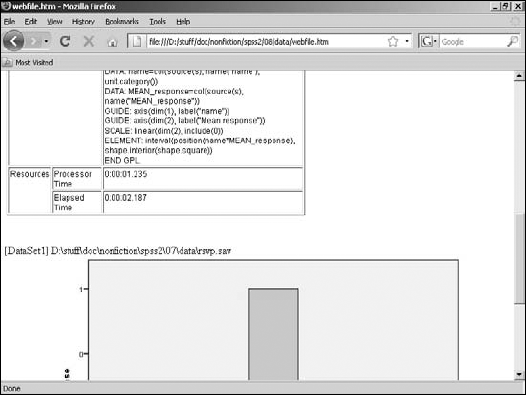
In this example, the output filename is webfile, so the main file is webfile.htm and the image file is webfile1.jpg. The jpg suffix indicates that a JPEG image file was the chosen option. The digit in the image filename is necessary because there could be more than one; each needs a unique name.
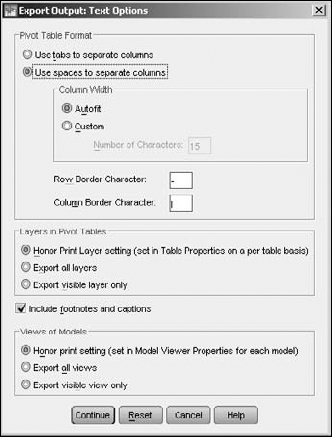
If you want to output a simple text file, you still have a number of options to choose from, as shown in Figure 8-5. The first two options are whether to use spaces or tabs to position characters on the page. This choice can be important because alignment is crucial to some data layouts, and programs that read the text files might have different tab settings and change the appearance of the output when it's displayed.
The options for creating Unicode file are the same as those for creating a plain-text file. The Unicode output is in the standard encoding format of your choice — either UTF8 or UTF16. You would only want to output text in one of these formats if you have a program that needs one of those formats for its input.
Tables output as text use certain characters to define the cells in which data items are shown. You can select any characters you want to act as separators and draw the borders, or you can accept the default of the minus sign and vertical bar, as shown in the figure. (The vertical bar is a standard keyboard character, usually on the same key as the backward slash. It sometimes looks like a vertical line broken in the middle.) If you're outputting tables, you can choose a maximum cell size or just use the default Autofit option and let SPSS decide the number of characters that will fit in each column.
The output shown in Figure 8-6 is a simple listing in a DOS command-line window of a text file generated by SPSS. It is the same data as in the previous example, which was formatted into HTML. Also, like HTML, the graphic is output in a separate file. The text file includes the full path name of the produced graphic file. You have the same set of options for producing graphic files as you have for Web page files.
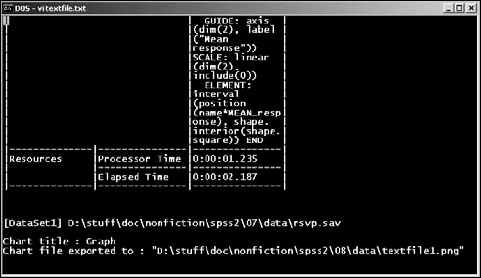
In this example, the output filename is textfile, so the main file was named textfile.txt and the graphic file was named textfile1.png. The png suffix indicates that a PNG graphic file was the chosen option. As with all such choices, the digit in the graphic filename is necessary because there could be more than one, and each needs a unique name.
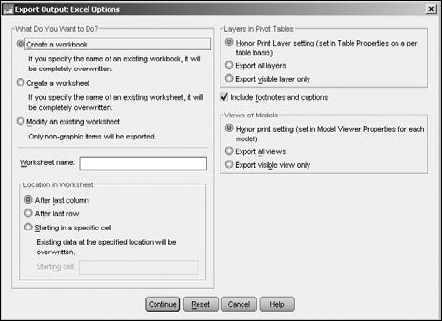
Creating an Excel file is easier than creating either a text file or HTML file because the images are not generated as separate files — graphic images are included in the worksheet. (The options for creating an Excel file are shown in Figure 8-7.) You get to choose how pivot tables, footnotes, captions, and models are handled, as described for HTML files.
By default, a new workbook file is created. If a file with the same name already exists, it is overwritten. You can specify that a new worksheet be created within the workbook file; you must specify the worksheet name. If the worksheet name you choose already exists in the workbook, the file that has it is overwritten. Alternatively, you can specify that the output be used to modify an existing worksheet within the workbook file. If you decide to specify the name of a worksheet, the name cannot exceed 32 characters and should not include any special characters.
Also, if you choose to modify a worksheet, you can specify where, in the existing worksheet, the new information is to be placed.
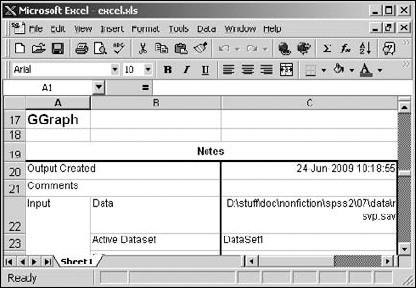
When you want to produce output, click the OK button in the Export Output dialog box, and a file is generated. Then you can load the file directly into Excel, as shown in Figure 8-8.
In this example, the output filename is excel, so the output file was named excel.xls.
If you choose to output a Word document file, you have no graphic options to set because both text and graphics are included in one output file. The options you can choose from are shown in Figure 8-9: whether to include footnotes and captions, how models are to be handled, and whether to include all layers of any tables that may be in the output.
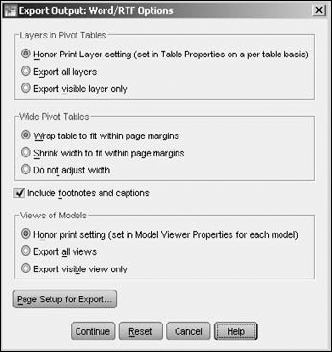
The Page Setup for Export button opens a dialog box that allows you to lay out the page size and margins of the output. It makes it possible to specify wrapping and shrinking to make things fit.
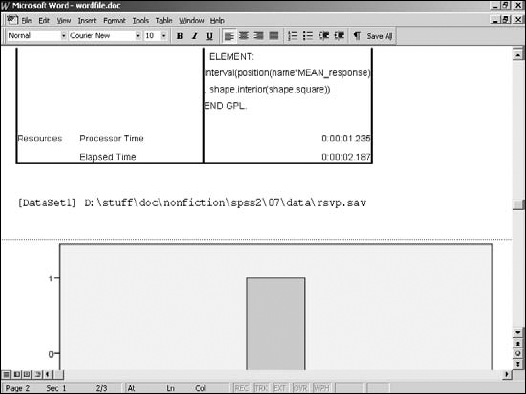
When you want to produce output, click the Continue button in the Export Output dialog box, and the file is generated. Then you can load the output file directly into Word, as shown in Figure 8-10.
Tip
The output file is in RTF (rich text format), a file type that can be loaded and used by most word processors, including OpenOffice, StarOffice, and WordPerfect.
In this example, the output filename is wordfile, so the output file was named wordfile.doc.
A PowerPoint file includes only tables, graphs, and models, so you can produce a series of display slides that contain all your graphics. The basic options are shown in Figure 8-11.
The first options to set are the layers in pivot tables. Some pivot tables have more than two dimensions, and the other dimensions are presented as multiple display layers. By setting this option, you can include or exclude layers in the PowerPoint slides. If you have a multilayered table, you'll probably have to experiment with the setting and see what you get.
A pivot table can have multiple headings and footnotes, which you can choose to include or exclude. You can also choose to use the outline headings as slide titles in your output.
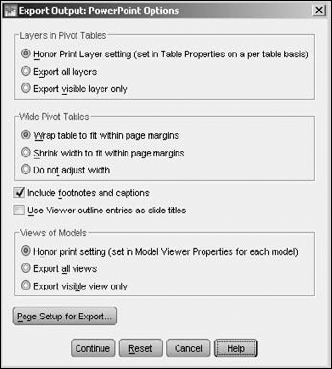
Some results are presented as graphic models, but the view that appears on-screen is not the only one you can use. You have the option of including all views in the output, or showing only the view that is currently visible.
Your output will include only charts, graphs, and pivot tables; the rest of your data is ignored and doesn't appear anywhere in the set of produced slides. Figure 8-12 displays the slide produced from the same SPSS Viewer data that was used in the previous example. If you need some text slides before or after your graphics, you have to add those yourself.
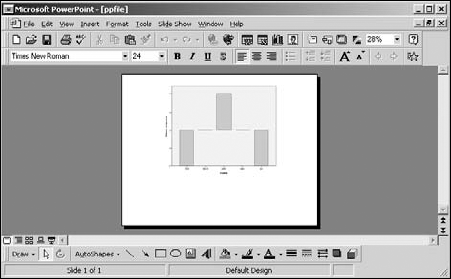
In this example, the output filename is ppfile, so the output file was named ppfile.ppt.
It is becoming more common to place information on the Internet in a PDF format instead of an HTML format. Both are read-only files, but a PDF gives the creator of the file more control over the document's appearance when it's displayed in a viewer. An HTML page is relatively free-form compared to a PDF file. With a PDF file, you can put your information on the Internet and have it seen the same way by every person who views it.
A PDF file contains both formatted text and graphics, so any PDF you output will look very much like the original data displayed in SPSS Viewer. PDF handles graphics in a standard way, so you don't have the typical graphic options to set. Note, however, that you do have some other options, as shown in Figure 8-13.
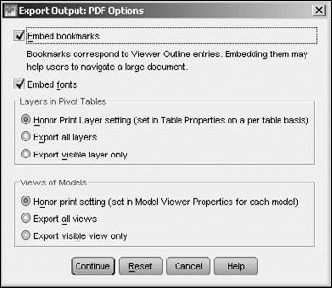
You can elect to include bookmarks in the produced file. These bookmarks are important for larger files. They are used by the viewer to simplify the process of navigating through the file.
Embedding fonts ensures that the document will look the same on every computer. If the fonts are not embedded, the chosen font may not be available for display or print, in which case the substitute font could make the resulting display look quite different.
You can set the layers in pivot tables. Some pivot tables have more than two dimensions, and the other dimensions are presented as multiple displayable layers. By setting this option, you can include or exclude layers in the PDF file. If you have a multilayered table, experiment with this setting until you get the results you want.
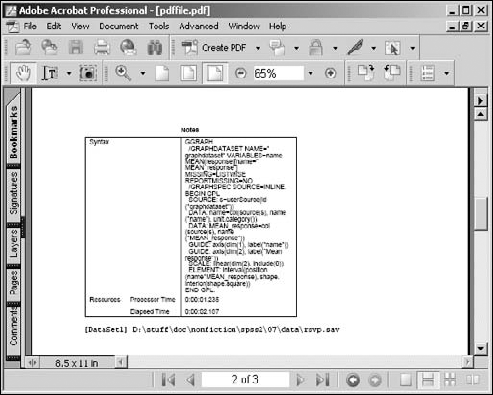
Using the default settings, SPSS produced the PDF file shown in the Adobe Acrobat Viewer in Figure 8-14.
Depending on the type of output data file you generate, you may need to select the file type and configuration settings for separate image files. When you produce such image files, you could get several of them — one for each image displayed in the SPSS Output Viewer. And image files have options.
Tip
If you don't have an immediate handle on the options you can use to generate your selected type of graphics file, experiment. Start with the defaults and make changes only if you need to. It doesn't cost anything to try different combinations of options and decide on the settings you like.
For all image file types, you can specify the size in terms of a percentage of the original. The default is 100 percent, which means there is no change in the size of the image. The other options available (compression, number of colors, and so on) vary, depending on the file type.
Figure 8-15 is the dialog box used to set the options for a bitmap (.bmp) file. The size can be expanded up to 200 percent of the size displayed in the SPSS Output Viewer. You can also choose to use compression to reduce the size of the file — the compression used will not reduce the quality of the image.
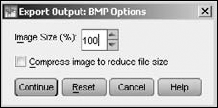
Figure 8-16 is the dialog box used to set the options for an enhanced metafile (.emf). The only option is to adjust the size of the image.
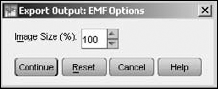
Figure 8-17 is the dialog box used to set the options for an encapsulated postscript (.eps) file. You can set the size of the image in one of two ways — you can set it to be a percentage of the current size or you can set its width as a number of points. (There are 72 points to an inch.) You can optionally choose to produce a TIFF along with the postscript image, in case you are unable to display the postscript image. If the fonts are all available on the output device, you can simply include the font information. If the fonts are not available, a substitute will be chosen. Alternatively you can choose to present the fonts as a collection of graphics (curves).
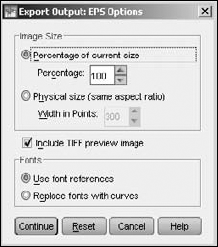
Figure 8-18 is the dialog box used to set the options for a JPEG (.jpg) file. You can set the size, or you can choose to remove color from the image.
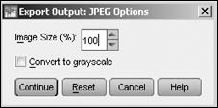
Figure 8-19 is the dialog box used to set the options for a PNG (.png) file. You can set the size as a percentage of the original. The color depth determines the maximum number of colors that can be used in the display. If the output is composed of fewer colors than appear in the original, the output is dithered to differentiate the graphics.
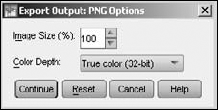
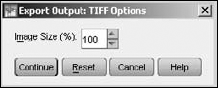
Figure 8-20 is the dialog box used to set the options for a tagged image file (.tif). The only option is to set the size of the image.