Let's create a new report. Name it whatever you want. Find the T-SQL script called 2008SalesTerritoryComparison.sql and create the dataset based on that. Name the dataset ds_DataBars. We're going to use this name in an expression in the next section, so make sure you remember it.
Drag the SalesTerritory and TotalSales fields into the tablix as shown in the following screenshot:

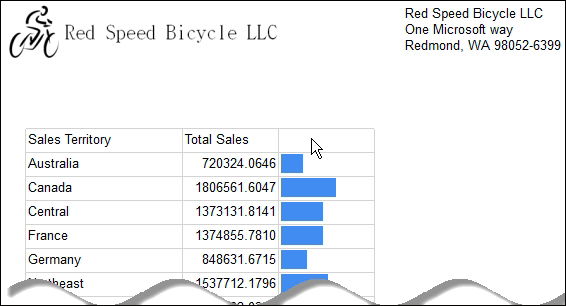
What we're going to look at here is the sales comparison among the territories, and see the distribution of dollars earned company wide.
Let's add a new column, if it's not already added. Drag a data bar object into the detail field of the third column. Select stacked bar on the Select Data Bar Type dialog box.
Now, for the value of our chart data, select TotalSales. Make sure you aggregate the value by SUM if it's not already selected:

Let's preview our report and check if we've achieved what we wanted: