
Chapter 6
Computational Thinking of Service Systems and Networks
Regardless of categories of services that a service system plans to offer, a service must be designed, developed, and delivered. Whether the service can stay competitive in its marketplace truly depends on whether it meets the needs of customers whom the service system intends to serve. As discussed in preceding chapters, the level of satisfaction that is received by the served customers depends on the efficient, effective, and smart operations of the service system. The people-centric dynamics of a service system in business operations essentially manifests itself in the theme of the service interactions between customers and providers. In both theory and practice, a service network is then used to describe the collective service and systemic behaviors of the involved service interactions.
We now understand that a competitive service system must put people (customers and employees) rather than physical goods in the center of its organizational structure and operations. The people-centric concept is explicitly reflected in the service value equation, ![]() , which holds in any service industry. Indeed, the equation expresses that we must focus on service design, development, and delivery using all available means to realize respective values for both service providers and service customers, technically and sociopsychologically.
, which holds in any service industry. Indeed, the equation expresses that we must focus on service design, development, and delivery using all available means to realize respective values for both service providers and service customers, technically and sociopsychologically.
Depending on the exploratory goal under study, there are a variety of approaches to explore service systems. This book, as concluded in Chapter 5, is interested in a prescriptive approach to explore service systems in an integrated qualitative and quantitative manner, aimed at helping service organizations look at their systemic dynamics of service systems and networks. As we like to have a suite of mathematical models in the form of integrated structural equation modeling (SEM) and social network analysis (SNA) to be applied to capture and explain the dynamics of ongoing service transformation processes, computational thinking of service systems and networks must be fully adopted. Ultimately, we can identify optimal transformative actions for continuous service improvements, resulting in that prescribed and managed service systems and networks can serve both customers and service providers in a competitive manner.
In this chapter, we first discuss the technical supports of real-time monitoring and capturing people-centric dynamics in a service system. We then articulate the need for computational thinking in developing appropriate approaches to model service systems and networks. Using computational thinking, in Section 6.3, a service system is conceivably constructed based on the business process management (BPM) concept while being formularized using a structured workflow language and π-calculus. The new model called a (computational and configurable service system) C2S2 model mainly focuses on the future enablement of system configurability by taking into account human interactions and consequences. In Section 6.4, a brief discussion of metrics and methods to determine whether a given service system is operating on track (e.g., satisfaction level) will be provided, aimed at enabling quantitative, predictive, and social-technical analytics at the point of need throughout the lifecycle of services. In Section 6.5, we discuss an example of C2S2 modeling using the PDGroup case study we had earlier. In Section 6.6, a brief conclusion is given, and the further study of transformation mechanisms for reconfiguration, continuous and real-time optimization of a service system is also presented.
6.1 Monitoring and Capturing People-Centric Service Network Dynamics in Real Time
Change is inevitable. A highly vibrant, value-driven postrecession economy in the United States is surely on the rise. To get comprehensive and timely understanding of the postrecession consumers, Gerzema and D'Antonio (2010) travel across the States to examine the value shifts sweeping the nation. Through in-depth observation and interviews with experts, and also by conducting comprehensive analytics using voluminous historical brand data, they study the changes of consumer expectations, explore the shifting values and consumer behaviors, and explain what the shift means to businesses and leaders.
“This value-led consumerism is not a small, isolated target market. Over half the U.S. population is now embracing these value shifts. They are seeking better instead of more, virtue instead of hype, and experience over promises. The postcrisis consumer, already highly marketing-savvy and armed with the leveling powers of social connection and critique, is now an even more potent and unpredictable force in the marketplace. People are looking for value and values” (Kotler, (2010).
Exploring the people components of service systems, we find that two constituents (i.e., ![]() and
and ![]() ) in the corresponding service equation
) in the corresponding service equation ![]() are unceasingly and unpredictably changing as time goes. In addition to the change in how people value what they are buying, consuming, and retaining, changes occurs rapidly in how organizations should be managed and operated. For instance, by relying on the database of consumers, Gerzema and D'Antonio (2010) investigate how people felt about the government, the economy, and the (mostly male) leaders making decisions at work. From their study, they find that substantial majorities were not well satisfied with their organizations and pessimistic about their quality of life. They are particularly intrigued by the observations about gender at work. “Two-thirds said the world would be a better place if men thought more like women. Gerzema [and D'Antonio] also asked consumers to characterize 125 traits as male, female, or neutral and to indicate those most desirable in modern leaders. Topping the list of most desirable traits includes patience, expressiveness, intuition, flexibility, empathy, and many other traits identified by respondents as feminine” (Buchanan, (2013).
are unceasingly and unpredictably changing as time goes. In addition to the change in how people value what they are buying, consuming, and retaining, changes occurs rapidly in how organizations should be managed and operated. For instance, by relying on the database of consumers, Gerzema and D'Antonio (2010) investigate how people felt about the government, the economy, and the (mostly male) leaders making decisions at work. From their study, they find that substantial majorities were not well satisfied with their organizations and pessimistic about their quality of life. They are particularly intrigued by the observations about gender at work. “Two-thirds said the world would be a better place if men thought more like women. Gerzema [and D'Antonio] also asked consumers to characterize 125 traits as male, female, or neutral and to indicate those most desirable in modern leaders. Topping the list of most desirable traits includes patience, expressiveness, intuition, flexibility, empathy, and many other traits identified by respondents as feminine” (Buchanan, (2013).
With a focus on the change of leadership and leader's styles in organizations, we have surely witnessed the progression of leadership from “command-and-control (roughly through the 1980s) to empower-and-track (the 1990s to mid-2000s) to connect-and-nurture (today)” (Buchanan, (2013). Power has more influence rather than control in many circumstances, which indeed is the trend of leadership transformation in this new millennium. The following seven identified traits are popularly perceived as what a leader needs today (Buchanan, (2013):
- Empathy. Being sensitive to the thoughts and feelings of others.
- Vulnerability. Owning up to one's limitations and asking for help.
- Humility. Seeking to serve others and to share credit.
- Inclusiveness. Soliciting and listening to many voices.
- Generosity. Being liberal with time, contacts, advice, and support.
- Balance. Giving life, as well as work, its due.
- Patience. Taking a long-term view.
Feminine traits and values are a new form of innovation. They are an untapped form of competitive advantage (Gerzema and D'Antonio, (2010).
Note that ![]() and
and ![]() in the service value equation are highly correlated in the service sector. In addition to heavily investing on leadership development in service organizations, we must pay much attention to employees' job satisfaction. According to Buchanan (2013), “The Holy Grail in business today is engagement: employees' energy, enthusiasm, and commitment to their companies. Engagement has a powerful effect not only on productivity but also on profitability and customer metrics, numerous studies show.” Engagement is not something we can buy as it must be nurtured and nourished over time through promoting and fostering employees' physical, emotional, and social well-being.
in the service value equation are highly correlated in the service sector. In addition to heavily investing on leadership development in service organizations, we must pay much attention to employees' job satisfaction. According to Buchanan (2013), “The Holy Grail in business today is engagement: employees' energy, enthusiasm, and commitment to their companies. Engagement has a powerful effect not only on productivity but also on profitability and customer metrics, numerous studies show.” Engagement is not something we can buy as it must be nurtured and nourished over time through promoting and fostering employees' physical, emotional, and social well-being.
In summary, changes happen fast, everywhere, and unpredictably. Without exception, this is particularly true about service systems and networks we mainly study in this book. Unless we can capture the changes of service systems in real time, we cannot get the insights of the dynamics of the service networks and transform service encounters adaptively. Promisingly, when we put people first and build and operate IT-empowered service systems, monitoring and capturing relevant service encounters become possible. Indeed, because of the fast advances of computing, networks, and big data technologies, computational thinking of service systems and networks has its practical meaning. Generally speaking, IT makes possible for us to conduct real-time explorations of sociotechnical service systems with scientific rigor.
6.1.1 Computational Thinking of Service Systems and Networks: A Necessity in Service Science
Let us briefly recap what we discussed in Chapter 3. We understand that service-dominant thinking is essential. We know we must leverage all the necessary means to explore services and accordingly service systems and networks:
- Our approach must be process-driven and people-centric. Once again, service is a process of transformation of the customer's needs utilizing the operations' resources, in which dimensions of customer experience manifest themselves in the themes of a service encounter or service encounter chain. As compared to manufacturing, service is people-centric, which must be cocreated by customers and providers.
- Our approach must be holistic. The holistic or systemic viewpoint focuses on the “big picture” and the long-range view of systems dynamics, looking at a service organization as a collection of domain systems that constitute a whole. The systematic view allows us to see how each and every service activity is operated. We analyze the efficiency and effectiveness of each activity and accordingly control and manage them in a decisive manner. By paying attention to the whole, a holistic perspective thus allows us to understand and orchestrate service encounters among business domains across the service lifecycles.
As we discussed earlier, the prior lack of means to monitor and capture people's dynamics throughout the service lifecycle has prohibited us from gaining insights into the service encounter chains or networks. However, the rapid development of digitization and networking technologies has made possible the needed means and methods for us to change this.
Service networks essentially are the networks view of the behavioral dynamics of a service system, describing how interwoven service encounters in service meet the customers' needs and how the service system might evolve over time. As recognized, computational thinking that fully leverages today's ubiquitous digitalized information, computing capability, and computational power has evolved as an optimal way of solving problems, designing systems, and understanding human behavior. Computational thinking promotes qualitative and quantitative thinking in terms of abstractions, modeling, algorithms, explorations, and understanding the consequences of scale and adaptation, not only for reasons of efficiency and effectiveness but also for economic and social reasons. Therefore, computational thinking of service systems and networks becomes a necessity in developing service science.
6.1.2 Big Data in Support of Computational Thinking of Service Systems and Networks
Today, the term of big data is pervasive. Truly, big data still engenders confusion as different people might have different interpretations. In fact, data have been overwhelming over the years. Many organizations have had varieties of challenges in storing, processing, and making use of the massive data they collected intentionally or unintentionally. Because mobile computing devices, social media, and Web 2.0 applications help to collect people-centric data and information, organizations become interested in big data and start to explore and invest on new solutions to process and analyze this vast array of data and information. For instance, through capturing customers consuming dynamics in real time, organizations want to identify the market trend from the archived big data and promptly transform by aligning their business practices with the changes (IBM Global Business Services, (2012).
According to Schroeck (2013), “it's not until recently that three important trends are converging to usher in a new era of big data—one that will fundamentally transform how businesses operate and how they engage with customers, suppliers, partners, and employees.” The three trends identified by Schroeck (2013) include the emerging mass digitization of things, the growing popularity of social media, and the significant technological advances in the areas of mobile computing, data storage, and networking and telecommunications. Schroeck argues that the convergence of these three trends is enabling an organization to effectively utilize these new streams of big data in assisting the management and employees in making informed decisions throughout the organization so that the desired values can be delivered to providers and customers, respectively, and optimally.
To better understand how big data are currently utilized to benefit businesses in the industry, in 2012 the IBM Institute for Business Value worked together with the Saïd Business School at the University of Oxford in surveying 1144 business and IT professionals around the world, and interviewing more than two dozen academics, subject matter experts, and business executives. According to IBM Global Business Services (2012), “To compete in a globally-integrated economy, today's organizations need a comprehensive understanding of markets, customers, products, regulations, competitors, suppliers, employees and more. This understanding demands the effective use of information and analytics. Next to their employees, many companies consider information to be their most valuable and differentiated asset.”
The Internet of things is gradually becoming reality. Evidently, the use of advanced sensor-based devices and instruments is pervasive; organizations and individuals can monitor in real time everything from the status of a freight fleet across the countryside to hourly power usage in facilities and even individual appliances at their homes or irrigation devices in remote farms. Moreover, by further leveraging the advances in mobile computing and social networks, service providers and customers around the world can now easily and in real time communicate and interact with each other. Because of the availability of streams of massive data, an array of advanced analytics methods and techniques come into being, enabling organizations to extract insights from big data with previously unachievable levels of sophistication, accuracy, efficiency, and effectiveness (Schroeck, (2013).
Indeed, today organizations are strongly interested in leveraging big data to realize customer-centric business objectives across industries (IBM Global Business Services, (2012); Partnership for Public Service, (2011) (2012). Over time, they will surely apply the newly emerging analytics methods and techniques to address other business objectives, including satisfying employees' socioemotional needs and aligning physical and information flows in support of satisfactory service encounters at the point of need. Simply put, because of big data technologies, comprehensive and overwhelming data on people-centric dynamics can be well and real time collected, transformed, and stored. As a result, service organizations can convert big data and analytics insights into results and opportunities with the support of newly developed sciences, tools, and methodologies, including service science.
6.2 Computational Thinking of Service Systems and Networks
As the world becomes more complex and uncertain socially and economically, computational thinking that fully leverages today's ubiquitous digitalized information and the availability of massive data, computing capability, and computational power has evolved as an optimal way of solving problems, designing systems, and understanding human behavior. As discussed earlier, computational thinking essentially is qualitative and quantitative thinking in terms of abstractions, modeling, algorithms, explorations, and understanding the consequences of scale and adaptation, not only for reasons of efficiency and effectiveness but also for economic and social reasons (CMU, (2009).
In general, the adaptive capability or sustainable competitiveness of a service system largely depends on right principles and methods, and appropriate tools employed for conducting quantitative, predictive, and social-technical analytics at the point of need throughout the lifecycle of services. Hence, we must fully leverage computational thinking to develop necessary approaches and tools, which can be put into use by service organizations. As a result, with the help of the developed approaches and tools, service organizations can explore, model, capture, and manage systemic behaviors, interactions, connections, complex relations, and interdependencies of their service systems.
In this book, given a service system with known service products, resources, and operations, we mainly explore a computational model of the operational dynamics and system adaptiveness of the service system by looking into its systemic operations, behaviors, and interactions. As a breakthrough in delivering a resolution to the people-centric enablement in a service system, end users (service consumers) and employees (service enablers) must be simultaneously taken into consideration throughout the lifecycle of services. An adopted computational approach should be able to model people's physiological and psychological issues, cognitive capability, and sociological constraints (to a certain extent at the very beginning). People-centric sensing is the fundamental enablement, providing all potentials of collecting human activities data throughout the lifecycle of services. More specifically, appropriate mechanisms should be developed, aimed at helping service organizations
- timely capture end users' requirements, changes, expectation, and satisfaction in a variety of technical, social, and cultural aspects;
- efficiently and cost-effectively provide employees right means and assistances to engineer services while promptly responding the changes; and
- allow involved people consciously infuse as much intelligence as possible into all levels and aspects of decision making to assure necessary system adaptiveness from time to time.
6.3 Modeling of a Configurable and Competitive Service System
BPM mainly focuses on managing changes to improve business processes. By embracing core principles of striving for collaboration, agility, innovation, and integration with state-of-the-art technology (Weske, (2007), Qiu et al., (2008), BPM is considered as a holistic management and business process operation approach toward cutting-edge business competitiveness (Figure 6.1). BPM activities can largely be grouped into five categories from design, modeling, execution, monitoring, to optimization, aimed at ensuring the continuous process improvement on operation effectiveness and efficiency in order to stay competitive.
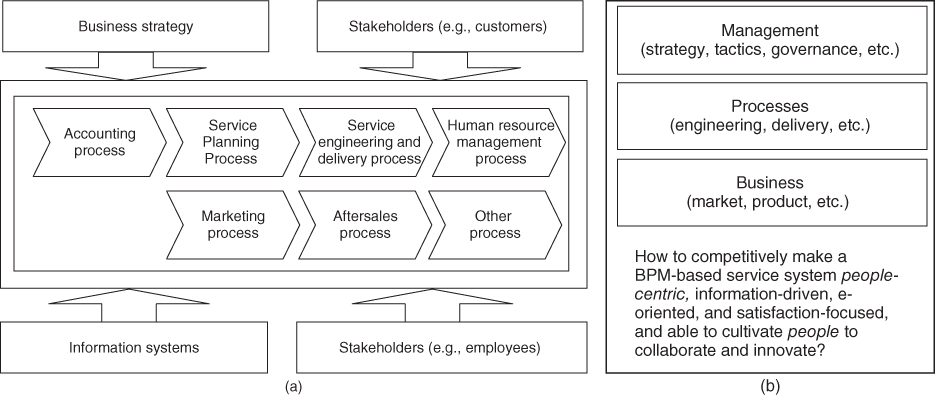
Figure 6.1 Business process management—a process-driven approach. (a) Organizational level model and (b) operational view.
As the twenty-first century becomes an information- and knowledge-based service-led economy, countless new products and services have been spawned, creating new opportunities that often change the very nature of businesses and organizations. Many world-class business organizations have been transforming themselves by taking the BPM approach for competitive advantages. However, there lacks a novel science that can govern and guide the transformation of a service organization (i.e., service system) to ensure that the organization will be (i) people-centric, information-driven, e-oriented, and satisfaction-focused, and (ii) able to cultivate people to collaborate and innovate.
Note that a service system usually integrates different types of resources (capital, labor, technology, and innovation), realizing different scales of revenues and profits, and most importantly different competitiveness during a competition (Figure 6.2). Although it is common to use a profit equation to measure the competitiveness of a given service system at a given time, it might make more sense to measure its viability as the sustainable competitiveness of the service system. For instance, today's globally integrated economy is highlighted with dynamics and uncertainty; thus, system viability might be calculated using a suite of performance factors and business environmental indicators collected during operations in a comprehensive and scientific manner.
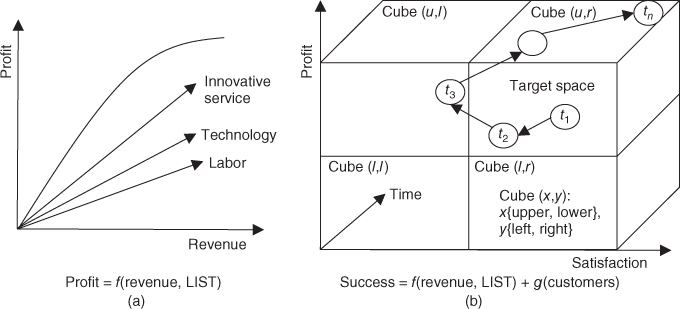
Figure 6.2 Service system's competitiveness. (a) Profit model and (b) system trajectory model.
More specifically, at a given time and market for a given service, the competitiveness of a service system might mainly rely on a combination of both profit and user satisfaction as shown in Figure 6.2(b). To retain its competitive advantage, it is obvious that the service system's trajectory should be well controlled as time goes. In other words, the system must navigate in its defined business target space during operations in order to outperform its competitors. Under different circumstances, the success might be measured using different or more dimensions of measures, such as an equation of profit, satisfaction, and productivity. Owing to the existence of a variety of uncertainties, the business goal at a given period might also require dynamic adjustment by navigating the system across different designated target spaces.
In the remaining section, a service system is conceivably constructed based on the BPM process-driven concept while being computationally formularized using an automaton-based structured workflow language and π-calculus. The newly proposed C2S2 model mainly focuses on the enablement of system configurability by taking into account service system's characteristics (e.g., people-sensing, cocreation values, human interactions, and consequences).
6.3.1 The Systemic View of a Service System
The reality is that many aspects in the market are correlated in today's integrated global economy, so are the service systems. To better understand how a service system performs, it becomes clear that the levels and details of analyses should be broad enough and comprehensive enough to reveal all the necessary interactions, interdependencies, and relationships within the service system. The process-driven BPM approach appears as an appropriate choice as drilling down into specific processes and their nested subprocesses is a necessity to reveal the details in a process-driven system.
However, as mentioned earlier, no matter where, why, when, who, what, and how, by the end of the day the real value of a delivered service most likely lies in its ability to satisfy customer's need from a business competitiveness perspective. Extreme customer service helps businesses survive; BusinessWeek (2009) publishes a list showing that 25 companies get it right in a tough year. Thus, the understanding of how process activities (or tasks) performed as individuals and a whole during the lifecycle of service affects customer satisfaction becomes essential. The understanding is also a necessity for systemic decision making on how a service system should be transformed for improved customer satisfaction or a competitive advantage in a technically capable, financially available and justifiable, and socially amiable and adaptable manner. In other words, the systemic view of a service system capturing the issues that are mainly related to operations, integration, human behaviors, and globalization will play a key role in computationally modeling the service system.
Yet Another Workflow Language (YAWL) has been developed to directly support all control flow patterns required in a workflow system (van der Aalst and ter Hofstede, (2005). “Corporations are notorious for introducing technology without considering the human consequences” (Kanellos, (2004). This is quite true for the existing workflow models and languages. In this chapter, the set of symbols in YAWL is revised and expanded to better support BPM-based process flows (Weske, (2007), incorporating human tasks and human interactions to meet the needs of our modeling approach. Figure 6.3 shows the revised set of symbols that will be used in the presented C2S2 model.
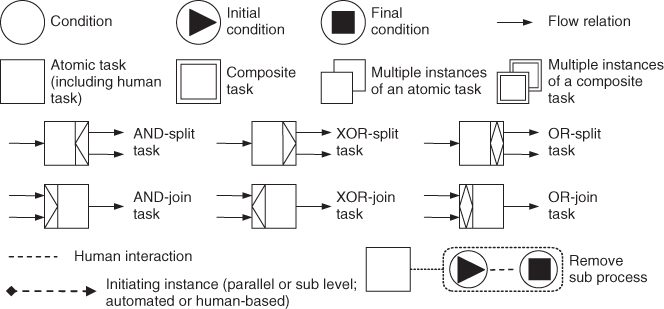
Figure 6.3 Symbols used in C2S2 models.
(Source: Revised and adapted from YAWL; van der Aalst and ter Hofstede, (2005).
Figure 6.4 shows a typical example of a virtual project development system (VPDS) using the revised set of symbols (van der Aalst and ter Hofstede, (2005); Weske, (2007). This VPDS is composed of multiple teams working across geographic, political, cultural, and enterprise organizational boundaries, responsible for conducting research and development projects in a global high tech bellwether service organization. One team takes leadership, managing project development overall issues, such as customer contacts and requirement solicitation, service product design and architecture, work breakdown structure design, progress supervision,
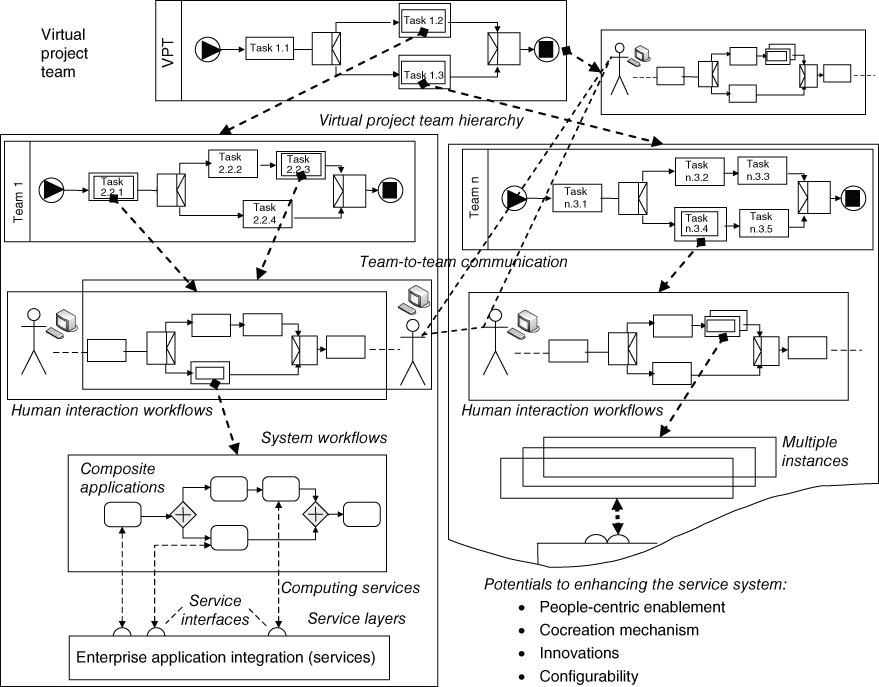
Figure 6.4 A typical global project development service system.
coordination among teams, and other managerial needs. Other teams are typically located in different regions or countries and focus on developing specific task components (i.e., part of projects or subprojects) based on their respective skill sets. By spanning institutional, geographical, and cultural boundaries, this VPDS as a typical sociotechnical service system aims at leveraging the best-of-breed talents in an integrated and collaborative way for a competitive advantage in the integrated global marketplace.
For simplicity, while without losing the generality in modeling service systems, this VPDS essentially is a scaled-down version of the global project development group (PDGroup) discussed in Chapter 2. Discussions based on the PDGroup will be provided in later sections of this chapter.
In general, the success of the VPDS operations largely depends on how people who are involved in the processes perform collectively, how team members individually follow the identified best practices, how they collaborate with each other by leveraging the best-of-breed talents, and how the VPDS navigates with uncertainties that surely exist from time to time. The following possible measurements collectively reflect how the VPDS is doing at the point of assessment across the VPDS:
- Conflicts (indicated by culture issues, managerial styles, personalities, etc.)
- Communication effectiveness (indicated by language barrier, customs, infrastructures, meeting setting, etc.)
- Project matter (indicated by size, complexity, geographical locations, the number of teams and members, team competency, etc.)
- Project management (indicated by project management method, tools, cost, commitment, risk matrices, control, etc.)
- Project goal (indicated by targeted marketplace, timeframe, etc.); and service satisfaction (indicated by customer feedbacks, loyalty, etc.).
Given the complexity and uncertainties, the VPDS' presumable superiority over centralized project development systems is not warranted if we do not have a scientific method and a suite of tools to efficiently and cost-effectively manage its end-to-end operations on a regular basis. A computational model employed for capturing the operational dynamics and trajectory of the VPDS becomes the key to explore its systemic operations, behaviors, and interactions. Being able to navigate in its target space at a given time, the VPDS would yield a more predictable, controllable, and sustainable service business.
6.3.2 The Dynamics of Processes in a Service System
Processes are the building blocks in a BPM service system. A process in a service system is a collection of related, ordered, and structured activities or tasks, which is typically organized for producing a designated service to meet a particular business operational need. When the service requires a divide-and-conquer approach by leveraging system resources (e.g., best-of-breed talents), the process can be recursively decomposed into subprocesses as shown in Figure 6.4. No matter how many process levels a service system has, each process should have its boundaries, inputs and outputs, dependencies, and communication channels clearly defined in the system hierarchy.
Dependent on circumstances, levels of processes could take a hierarchical structure following the defined work breakdown structures so as to ensure that service work dependencies can be well controlled and managed. However, beyond communications facilitated by the top-level process, personal communications among processes at all levels should be encouraged to leverage the diversity and culture of best-of-breed approach and ultimately cultivate people to innovate.
As a VPDS example seen in Figure 6.4, no matter how many projects or subprojects are under research and development in a team, the team follows a given business (project development) process flow. The flow dynamics of a team in a VPDS can be schematically illustrated using a systemic process diagram (Figure 6.5). Each flow is essentially a logic sequence of different task operations and obedient to its designated control patterns. For a task, it could be just a variety of activities performed at a given discrete time, by a given group of people. Using the Unified Modeling Language, Figure 6.6 conceptually shows the relationships and dependencies among the entities in a given process.
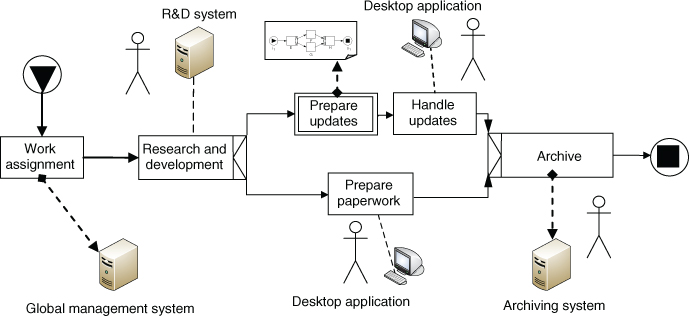
Figure 6.5 A typical VPDS process flow.
(Source: Revised based on Weske (2007).)
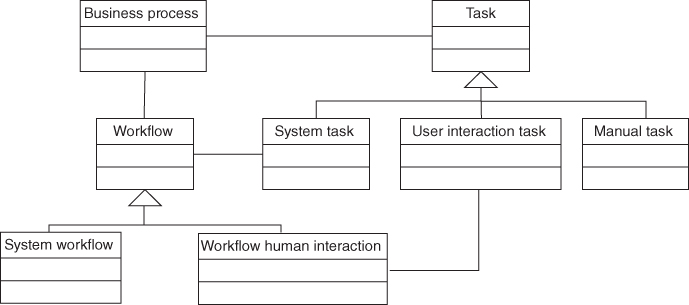
Figure 6.6 Process conceptual entity model.
(Source: Revised based on Weske (2007).
In reference to the extended workflow definition using YAWL by Weske (2007), a service system process in the proposed C2S2 model can be formally defined as a seven-tuple workflow net
where
 is a set of conditions;
 is the initial condition;
 is the final condition;
 is a set of tasks, such that
  = 0;
= 0; is a flow function, such that every node in the defined graph (
 ) is on a directed path from
  to
to  ;
; is a family of finite sets of task-oriented attributes
  , where
  :
:
- Split.
 →{And, Xor, Or, Null}, which specifies the split behavior of a task;
 - Join.
 →{And, Xor, Or, Null}, which specifies the join behavior of a task;
 - Rem. trem ∈ T
 ℘ for
℘ for  ,
,  , which specifies the subset of the net that should be removed when the task is executed;
 - Nofi.

 specifies the number of instances of each task (min, max, threshold for continuation) and its dynamic/static creation of instances, where
  indicates that it is a set including an infinite in addition to the natural numbers;
  for
for  and
and  is the task hierarchy (e.g., a work breakdown structure) map function given at node
  , where
  maps out all the tasks defined in the hierarchy.
- Split.
 is a set of collaborative communications defined using π-calculus.
  , where
  for
for  is a collaborative communication with other concurrent processes by receiving and/or sending activity-related data through automated or manual channels:
  , where
  . More specially,
 indicates that process
  gets instantiated and initiated after receiving a service task;
 indicates that process
  gets terminated and removed after sending out the outcomes of the completed service task;
 for
for  indicates receiving and/or sending activity-related data at node
  through automated or manual channels during the operations of this instantiated process:
- If
 is a newly established channel at
  ,
,  is defined as
  ; if no channel is needed, then
  is not defined, that is, Λ (no sending channel).
 - If
 is a newly established channel at
  ,
,  is defined as
  ; if no channel is needed, then
  is not defined, that is, Λ (no receiving channel).
- If
Generally speaking, a process instance is instantiated from its predefined process model whenever there is a new BPM-enabled service; the new service is operationally created as a new input (Figure 6.7). This instantiated BPM process instance will be terminated or removed as soon as the service is completed or has an exception requiring a process removal. Data related to all the activities (tasks, communications, system behaviors, and so on and so forth; automated or manual) during the process operations should be timestamp logged. This should be enforced for all levels of processes for a given service system although in reality it is well understood that only part of the needed data and information might be saved and collected.
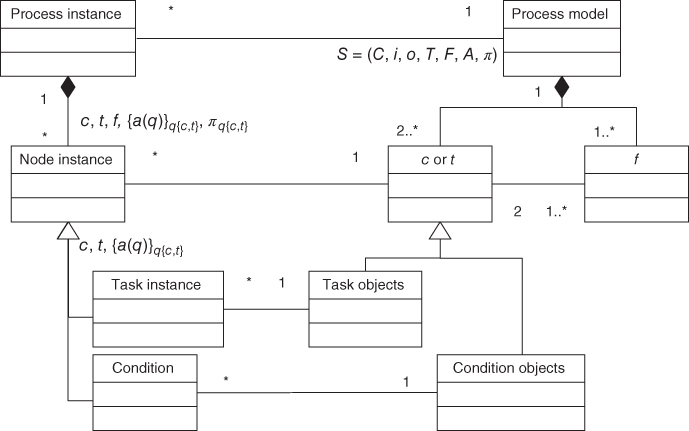
Figure 6.7 Object model for a process model and its instances.
(Source: Revised based on Weske (2007).)
6.3.3 The Dynamics of a Service System
A formal computational model of a service system is an unambiguous description of the system dynamics in light of control, communications, and interactions across all the involved processes. It is an abstract view of the system, which specifies the functionality and behavior of the system without being constrained by implementation details.
Formally, a service system can be defined as a five-tuple computational machine
where
 is a set of service system processes;
 is a set of top-level processes;
 is the set of all tasks, such that
  ;
;- Map.

 is a mapping function that specifies the task hierarchies for each composite task in the service system;
  is the set of all collaborative communications in the service system.
6.3.3.1 The Top Level of a Service System
When multiple services are engineered and managed throughout a service system simultaneously, there will be multiple processes at the top level. Each unique type of service engineered and delivered by the service system could require a unique process model as it might require a unique collection of related, ordered, and structured tasks. However, the same type of services should be cocreated by following the same process model. In other words, multiple instantiated process instances from the same process model can be executed to deal with the same types of services at the same time. Figure 6.8 schematically illustrates the top level of a service system in which three projects are developed at the same time. As shown in Figure 6.8, two out of three belong to the same type of services.
According to the above-proposed service system formal model ![]() , its parallel computational process models executed at its top level can be further defined by
, its parallel computational process models executed at its top level can be further defined by
where superscript 1 indicates level 1 (i.e., the top level); ![]() ,
, ![]() is the number of unique processes running simultaneously at the top level. For each process model, if multiple instances are instantiated, then the process can be further defined by
is the number of unique processes running simultaneously at the top level. For each process model, if multiple instances are instantiated, then the process can be further defined by

where ![]() is a process instance (i.e., process replication) for the ith type of service,
is a process instance (i.e., process replication) for the ith type of service, ![]() ,
, ![]() is the number of instances for the same type of service.
is the number of instances for the same type of service.
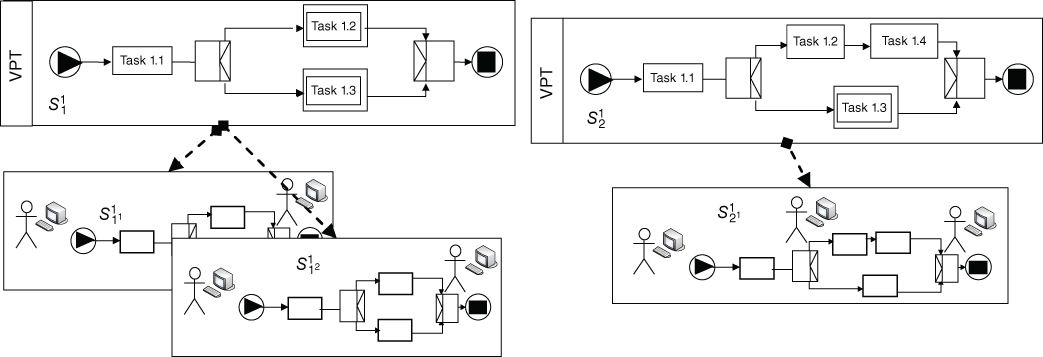
Figure 6.8 Parallel process instances at the top level.
The top level of the example shown in Figure 6.8 can be then defined as
6.3.3.2 The Hierarchy of a Service System
As discussed earlier, it is extremely typical for a service system to have a hierarchical structure, aimed at effectively taking advantage of divide-and-conquer approach to deal with complex and/or global services. Each lower process is typically created by focusing on developing specific task components, so right skill sets and resources can be identified and allocated for efficient and cost-effective use. For instance, the above-discussed VPDS that spans institutional, geographical, and cultural boundaries is such a sociotechnical service system. It is established for gaining competitive advantage through leveraging best-of-breed talents across the continents.
On the basis of the definition of a generic process, a process model at the ![]() level (
level (![]() , i.e., lower level) can be then defined by
, i.e., lower level) can be then defined by
where ![]() is essentially a subprocess of process
is essentially a subprocess of process ![]() .
. ![]() might have several subprocesses, depending on the number of specific subtasks defined in
might have several subprocesses, depending on the number of specific subtasks defined in ![]() . Of course, lower level processes can be further defined if a composite task requires descending numerous levels from the top.
. Of course, lower level processes can be further defined if a composite task requires descending numerous levels from the top.
Assume without loss of generality that there is only one business process in the leading team and two processes executed by two other support teams in the presented VPDS example. As each of them is operated in a different country, any project will thus be divided and formed as a composite task as shown in Figure 6.9. Accordingly, a hierarchy of the service system can be established. For this simple illustration (Figure 6.10), no matter whichever level it is, only one process instance is instantiated from its corresponding model.
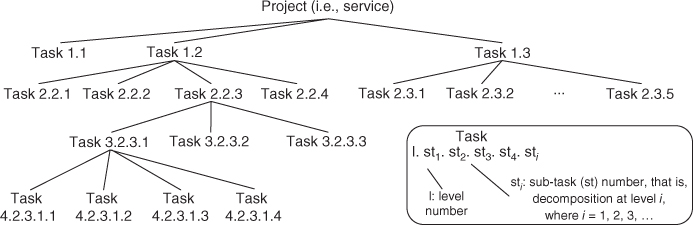
Figure 6.9 Task breakdown hierarchical structure and tree mapping scheme.
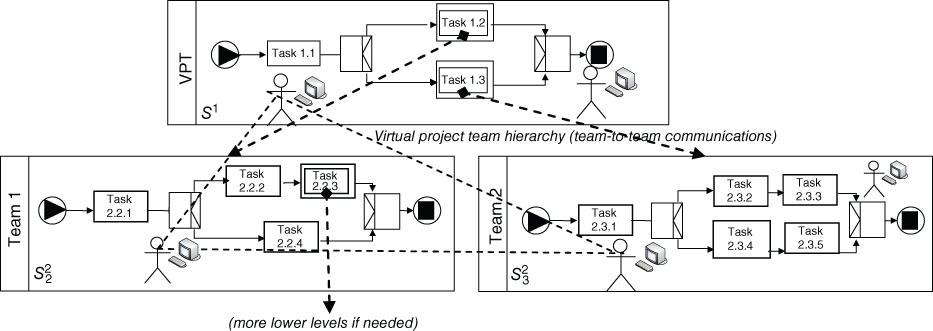
Figure 6.10 Process hierarchy model of the VPDS.
6.3.3.3 Ad hoc Processes
Typically, service activities are performed in conformance with team's existing best practices that might be a suite of defined processes and/or guidelines for ad hoc operations. In other words, although it is more effective and sustainable for a VPDS to have its best practices defined as IT-enabled or IT-facilitated processes, in reality many business activities are still conducted at participants' discretion at run time. Business activities occur during service operations without strictly bound to defined process control flow patterns essentially constitute these ad hoc processes, which is more difficult to manage and control compared to IT-enabled or IT-facilitated processes (Dustdar, (2004); Dustdar et al., (2005). In Figure 6.9, one task might be executed following a defined process; another might be carried out at members' discretion at run time.
Generally speaking, operating ad hoc processes would generate inconsistency in business operations and management, creating issues related to service quality, job satisfaction, and customer satisfaction. It is extremely challenging to address the inconsistency issues throughout the lifecycle of service as people-centered data related to their activities in services could not be well collected, processed, and understood. In addition, we understand that the collected data and information from a variety of legacy systems would typically be incomplete, so significant data shall be collected through conducting surveys to ensure that the needed data for analytics are scientifically sufficient.
This discussed C2S2 model investigates an innovative approach to enable people-centric sensing by fully leveraging the advancement of cyber-infrastructures, focusing on the collection of structured, semistructured, and nonstructured data throughout the lifecycle of services (Dustdar, (2004); Dustdar et al., (2005); Girardin et al., (2008); Qiu, (2009); Truong et al., (2008); PPF, (2012); IBM Global Business Services, (2013). Therefore, in addition to conducting the needed surveys, supporting tools facilitating ad hoc processes for fostering either collaboration (e.g., IBM Jazz, Action Log, or Caramba) (Dustdar, (2004); Jazz, (2012) or better bookkeeping should be utilized to enhance the execution of virtual team operational practices. As a result, in the VPDS example, more and better quality data can be gradually derived and mined from its IT-enabled service system.
6.3.3.4 Systems Data and Process Logs, and External Data Sources
As mentioned earlier, data and information related to all the activities (tasks, communications, systems dynamics, and so on and so forth, either automated or manual) related to service engineering, operations, and management should be timestamp logged. However, it is well understood that in reality the collected and aggregated data and information for any today's service system are typically overwhelming, in which a high percentage of the collections could be nonassociated, redundant, and context-insensitive (Dunham, (2003); Qiu, (2006). Discussions on how to design, develop, and implement systematic or standardized methods to perform data, information, and knowledge integration led to the constructs of consistent, relevant, and sound data, information, and knowledge bases are out of scope of this book. Some good technical references on big data technologies including data mining are provided in Chapter 9.
As a supplementary measure, periodic surveys using different questionnaires can be used throughout the development duration of each project. To make data processing efficient, Likert scales should be mainly used in each of the conducted surveys. Rad and Levin (2003) provide numerous instruments, covering member attributes, motivation study, leadership, success factors, and team maturity measures. Duarte and Snyder (2001) show different set of instruments to understand virtual team success factors and IT setting for better collaborations. Runde and Flanagan (2008) provide the appropriate measures of team conflicts in project management. To ensure the presented approach to meet different objectives, the instruments can be significantly revised to fit the needs of other corresponding investigations in practice.
We all know the saying, “garbage in, garbage out”. Regardless of the goal of a specific investigation, systems data, process logs, and external data sources play a key role in analytics. We must always pay much attention to data integrity and quality. With the appropriate support of systems data, process logs, and external data sources, we can have a better understanding of the VPDS, and refine the presented approach to modeling, monitoring, and managing the defined and ad hoc processes within the VPDS.
6.4 Service Systems' Performance: Metrics and Measurements
As discussed earlier, to stay competitive, it might make more sense to measure the viability rather than simple profitability of a service system. At a given time and market for a given service, the viability of a service system might rely on a combination of both profit and user satisfaction as shown in Figure 6.2(b). To retain its competitive advantage, it is obvious that the service system's trajectory should be well controlled throughout the service lifecycle. Adequate metrics with applicable measures to be used for evaluating how a service system performs from time to time are indispensable for service providers to make swift and informed decisions, so that the service system can successfully navigate throughout uncertainties and be viable in the long run.
Modeling using computational thinking focuses on exploring, capturing, understanding, and managing systemic behaviors, interactions, connections, complex relations, and interdependencies of a service system. However, resources, largely people—the main focus of a service system, are more complex to model and study as people participating in service production and consumption have physiological constraints, psychological traits, cognitive capability, and sociological obligations, etc. Therefore, measurements of a service system should be collected using methods and means capable of capturing the insights and dynamic social-technical behaviors of the service system, directly and indirectly. Ultimately, through qualitative and quantitative analysis, a service system can successfully navigate throughout a variety of uncertainties and stay competitive (Figure 6.11).
In focus on systemic behavior, structure equation modeling (SEM) has been widely used to study social and/or economic behavior of organizations. By carefully designing the indicators (i.e., measurements) from both social and technical
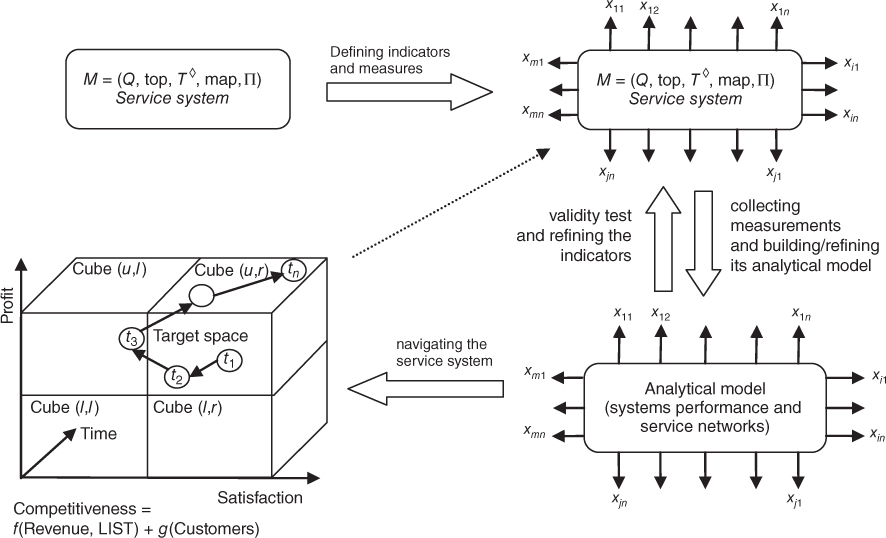
Figure 6.11 Computational thinking modeling for competitive service systems.
perspectives of a service system, improved SEM can be effectively applied in this interdisciplinary field. As a measurement example that is further enriched from the discussion in the previous section, the dynamics of the presented VPDS can be essentially described using the following latent model constructs/variables: (i) conflicts (indicated by culture issues, managerial styles, personalities, tasks, etc.); (ii) communication effectiveness (indicated by language barrier, customs, infrastructures, meeting setting, etc.); (iii) size of the project (indicated by geographical locations, the number of members, etc.); (iv) project management (indicated by project management method, tools, cost, commitment, risk matrices and control, etc.); (v) project goal (indicated by targeted marketplace, timeframe, etc.); and (vi) quality and satisfaction (Figure 6.12).
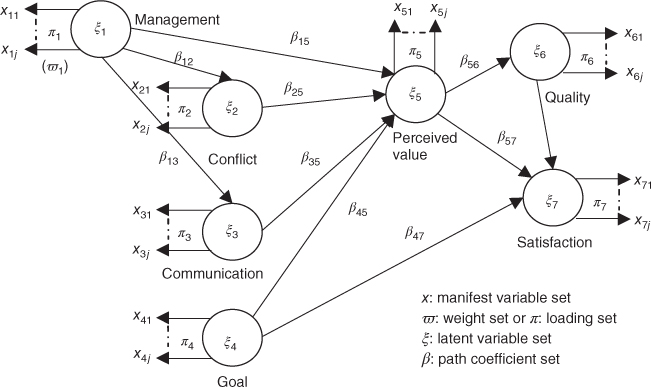
Figure 6.12 An SEM for the presented VPDS.
As compared to many covariance-based modeling approaches, the partial least squares approach to structural equation modeling (PLS SEM) is a soft modeling with relaxation of measurement distribution assumptions. In addition, PLS SEM requires only a small size of measurement samples and tolerates data collection errors in a more amicable manner. Indeed, this is a very good start point for us to analyze the systems performance of a social-technical service system. We focus on the development of real-time and closed-loop framework to help service organization engineer and manage their service systems. Developing an approach to model service systems while allowing performing continual improvements is unique, differentiating this book from others.
We give a brief introduction to SEM. More discussions will be provided in later chapters. For a reflective measurement model, measurement variables are a linear function of their latent variables ![]() plus a residual
plus a residual ![]() , and
, and ![]() is the corresponding loading set, that is,
is the corresponding loading set, that is,
The above-mentioned equation implies that the residual ![]() has a zero mean and uncorrelated with the latent variables
has a zero mean and uncorrelated with the latent variables ![]() . For a formative measurement model, the latent variable
. For a formative measurement model, the latent variable ![]() is a linear function of its measurement variables plus a residual
is a linear function of its measurement variables plus a residual ![]() , that is,
, that is,
For the structural model, the path coefficients between latent variable ![]() is given by
is given by
where ![]() is the vector of residual variance.
is the vector of residual variance.
Note that the operational dynamics of a service system can be easily and well explored and studied using a PLS SEM. To briefly illustrate the insights from the proposed modeling, this example simply shows the following analyses about the service system (e.g., the presented VPDS) at the point of need through the PLS SEM approach:
- Performance Index. Which level of the business operational objectives was achieved (e.g., the level of customer satisfaction for a given engineered and delivered service)?
- Impact Scores. How did an individual measured factor affect the performance index (e.g., the adopted communication media's impact on the final customer satisfaction level)?
As an example, Figure 6.13 shows an estimated model for the presented VPDS. The performance index for a latent variable is estimated at a 1-to-100 scale basis for easy human interpretation. Thus, a weighted average of scores from corresponding measurement variables is used by converting the original 7-point (X) scale to a 100-point scale (V) (Martensen and Gronholdt, (2003).
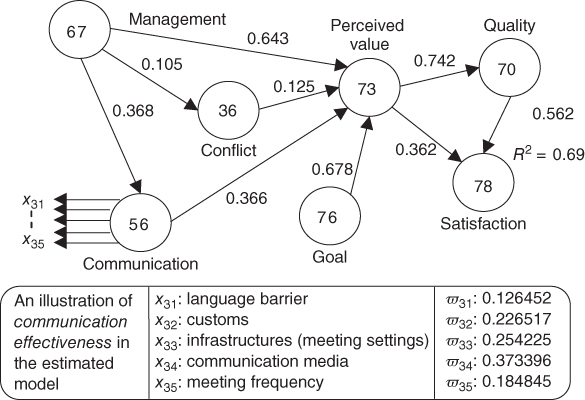
Figure 6.13 An estimated model for the presented VPDS.
More specifically, Figure 6.13 gives some detailed analytical results from a set of collected measurements used in the presented VPDS:
- Performance Index. The service satisfaction is at the performance index of 78 out 100. As the model is able to explain 69% of what drives user satisfaction (
 = 0.69), the model indeed delivers a high and substantial explanatory level.
 - Impact Scores. With regard to communication effectiveness in the VPDS, the effect of one-point increase in the communication effectiveness might result in 0.284 (0.366 × 0.362 + 0.366 × 0.742 × 0.562) points' improvement in the satisfaction performance index. Note that the calculated value has a symbolic meaning rather than a real outcome that could be actually generated. In other words, the effectiveness ranking of changes can be identified. Therefore, it is appropriate for a comparison exploration, which helps service organizations understand the insights into possible changes and their effectiveness.
As schematically illustrated in Figure 6.11, once we can directly and indirectly collect adequate measurements of a service system that truly and timely capture the insights and dynamic social-technical behaviors of the service system, the organizational effectiveness, operational efficiency, and adaptiveness of the service system can be analyzed and evaluated in a quantitative and qualitative manner, which optimally ensure smarter decision making for business to stay competitive.
The provided insights into the systems performance of a service system, proper transformation can be pinpointed and then applied, resulting in the successful navigation throughout a variety of uncertainties in reality. With the advances of people-centric sensing technologies, methods, and tools, we can fully explore service encounters to strive for more profound understandings of services in real time. Discussions on service networks with a focus on service interactions will be introduced later. However, exploratory modeling of service networks in a comprehensive manner is provided in the later chapters of this book.
6.5 PDGroup as an Exploratory Example of Service Systems Modeling
PDGroup as a global project development cluster, which is formed on a project basis in an international bellwether service organization, was full introduced in Chapter 2. Here comes a quick review of the project background information. An international chemical company called ChemGlobalService has manufacturing facilities in Beijing, China (A), Prague, Czech (B), and Houston, United States (C) across three countries in order to serve its customers across different continents in a cost-effective and efficient way. However, certain materials that can be made only by one facility are required by two other facilities in order to make final products. Each of the three facilities produces different common materials that are needed by others. As a result, these regionally made chemical materials must be transported among three warehouses on a weekly basis. The ChemGlobalService contracted the PDGroup to help integrate three local warehouse systems applications to make sure that their operational coordination among three warehouses is conducted in a collaborative, timely, and effective manner.
More specifically, daily business activities related to the common materials should be monitored and coordinated across three facilities. The right information should be shared and made available to corresponding end users at the point of need. In light of integrating three existing warehouse systems to meet the identified needs, the project's main requirements can be summarized as follows:
- Business processes should be defined in support of fully coordinated operational activities within and across warehouses.
- Industry-specific specifications should be supported.
- All environmental protections, treaties, customs, and other related regional and international regulations and policies must be fully complied. Instructions should be provided at the point of need to all the internal and external personnel who are involved in the process of transporting the hazard components.
- User-friendly human interfaces should be provided to different warehouse employees who understand different languages and have different educational and cultural backgrounds.
On the basis of the general practice in software engineering and the design principles of BPM, we can easily create a task-based hierarchical structure for this service project (Figure 6.14).
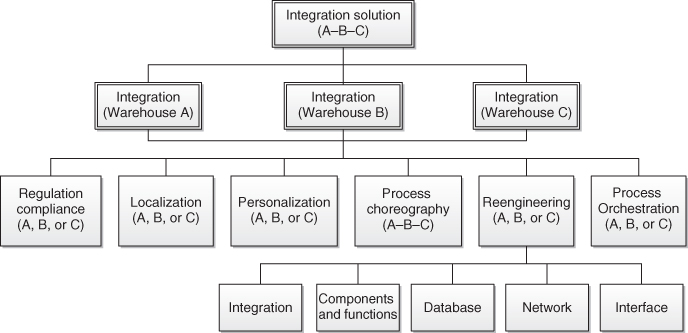
Figure 6.14 Overview of the project's task-based hierarchical structure.
The PDGroup includes six small groups of talents. Groups are located in different geographic areas, aimed at leveraging their strengths to meet the project needs. A top-level management unit (i.e., Team A) stays in New York City (NYC), United States. Team A, consisting of one team manager, one team architect, and one team business analyst, oversees and coordinates the project development and deployment across the entire virtual project team. Each of other groups has certain unique skill sets of from 5 to 15 talent employees, including a software designer, a group architect, programmers, quality assurance staff, business analysts, and a group manager. The following list reviews the above-mentioned individual group's respective and unique competency:
- Team A Located at NYC, United States. This team is essentially the administrative team, leading, overseeing, and coordinating the project development and deployment across the entire virtual project team.
- Team B Located at San Jose, CA, United States. This team has a group of persons of talent in human interface design and development.
- Team C Located at Houston, TX, United States. This team has a group of persons of talent in the field of warehouse systems. This team is local and close to the customer facility in Houston, United States. The team will be able to get familiar with the local warehouse system quickly and thus understand local warehouse operations and relevant managerial needs.
- Team D Located at Prague, The Czech Republic. Similar to Team C, this team has a group of persons of talent in the field of warehouse systems. This team is local and close to the customer facility in Prague, Czech Republic. The team will also be able to get familiar with the warehouse system in Prague quickly and understand local warehouse operations and relevant managerial needs.
- Team E located at Beijing, China. Just like Teams C and D, this team has a group of persons of talent in the field of warehouse systems. This team is local and close to the customer facility in Beijing of China. Hence, it will be convenient and easy for the team to get familiar with the customer warehouse system in Beijing and surely understand local warehouse operations and relevant managerial needs.
- Team F Located at Bengaluru, India. This team is a software outsourcing partner. This team has a group of persons of talent in the field of software design, development, integration, and systems test.
- Team G Located at Sydney, Australia. This team has a group of persons of talent in the field of enterprise application integration, business analytics, and international regulation and policy compliance.
Figure 6.15 shows the organizational chart for the PDGroup. Organizational charts at the group or virtual team level in the PDGroup is illustrated in Figure 6.16. Surely, it is challenging to coordinate the daily development activities across the cluster as groups are geographically dispersed around the world.
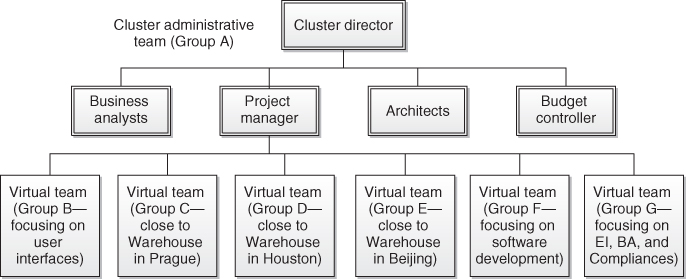
Figure 6.15 Organizational chart at the cluster level.
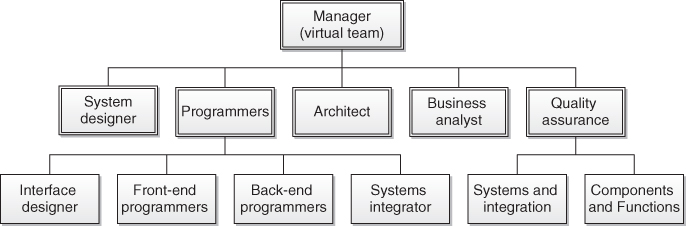
Figure 6.16 Organizational chart at the group or virtual team level.
6.5.1 The Competitiveness of Service Systems: A Systems Approach
PDGroup as a service system can be easily modeled when it is compared to a large-scale service organization. However, the modeling of the PDGroup is never easy and straightforward because of its natural span over the time and space and the existing cultural barriers, in which coordination must be done across nations. It is a desirable goal for the PDGroup to have a way to manage and coordinate the development of an effective solution to solve the discussed ChemGlobalService's warehouse issue. Finding an approach to model the dynamics of the PDGroup surely is the first step to realize the goal.
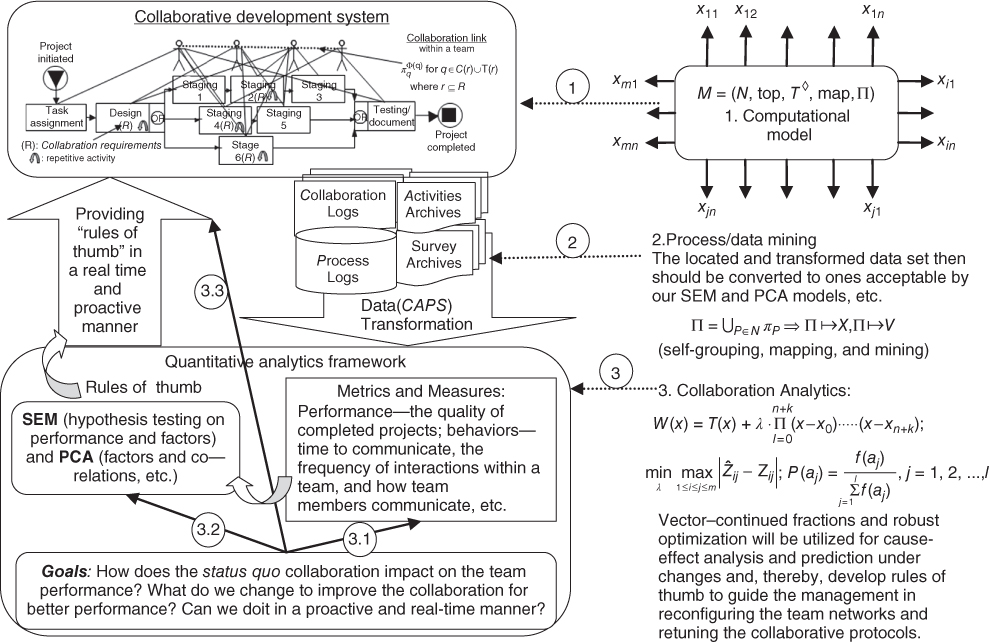
Using computational thinking, we can have an approach to modeling of the PDGroup dynamics, focusing on collaboration, people-centric sensing, and viability. People-centric sensing facilitates and promotes social-sensing applications (Campbell et al., (2008). Figure 6.17 shows our exploratory roadmap for the focused model, highlighting modeling tasks in a stepwise manner. Through enabling mechanisms
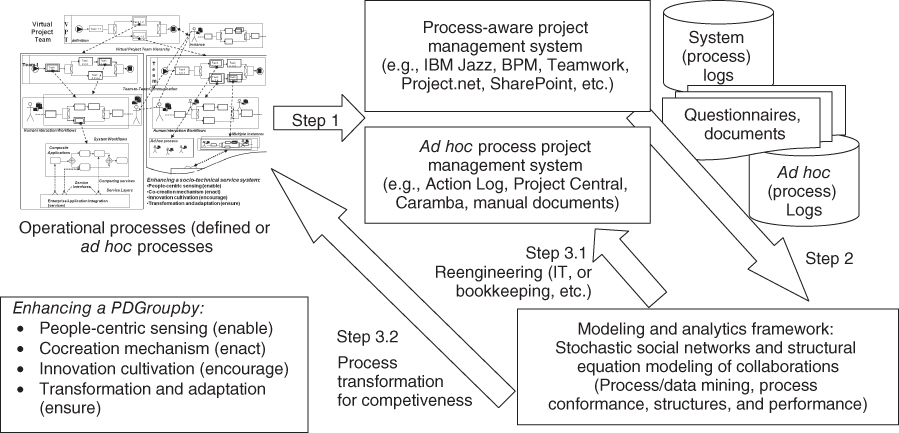
Figure 6.17 Exploratory systems approach to model the PDGroup.
of people sensing to capture their physiological and psychological issues, cognitive capability, and sociological constraints during the lifecycle of project services, the developed approach shall provide with the means (e.g., Step 1) to explore, model, capture, and manage systemic behaviors, interactions, connections, complex relations, and interdependencies of sociotechnical systems, resulting in a better understanding (e.g., Step 2) of what constitutes an effective and robust PDGroup and under what conditions and agile transformation (e.g., Step 3), the PDGroup's performance and potential would be more predictable, controllable, competitive, and sustainable from time to time.
Once again, at a given time and market for a given service, the competitiveness of a service system might rely on a combination of both profit and user satisfaction. In general, adequate service metrics with applicable measures to be used for evaluating how the PDGroup performs from time to time are indispensable to making swift and informed decisions, so that the PDGroup can successfully navigate throughout uncertainties and be viable in the long run (Qiu, (2009). To fully investigate the acceptance's constituents in any service question, we must explore how people (PDGroup's staff and ChemGlobalService's employees) interact with each other throughout the service lifecycle. For instance, we should understand well how cross-cultural management plays a critical role in ensuring virtual team's success (Figure 6.18). In the long run, we should explore collaborative mechanisms that can be applied in coordinating team works cost-effectively and efficiently. Therefore, social networks formed in business operations must be deeply studied. Because of the people-centered nature in modeling, SNA becomes an essential component of the proposed approaches in this book.
6.5.2 The Competitiveness of Service Systems: A Network Approach
In general, we understand that this global project development service surely requires a series of interactions and coordination, physically and/or virtually. Varieties of service encounters throughout the lifecycle of global project development service are collaborative in nature. The effectiveness of the project development service highly depends on interactions between PDGroup's staff and ChemGlobalService's employees. Only when fully understood, designed, and executed, interactions could be well managed and controlled so that each interaction would occur in a timely, efficient, and effective manner (Figure 6.19).
As indicated in Figure 6.19, a service interaction from a series of needed service encounters throughout the service lifecycle for a given end user or customer representative can start at any point and end at a point that is after the start point of the service. To an end user or customer, such an event-based series service-oriented interactions essentially constitute the customer's service lifespan, which largely depends on the role of the end user or customer representative from the ChemGlobalService. In other words, individual's service lifespan varies with his/her role at work. By the same token, a member of the PDGroup, including the personnel at the outsourcing group, will also take a role-based trajectory based on a series of service encounters. As a value cocreation service interactive activity, each service encounter surely makes a difference. To the service provider as a whole (i.e., PDGroup's perspective), the sum of all the series of service encounters essentially create a service encounter network as discussed in Chapter 4.
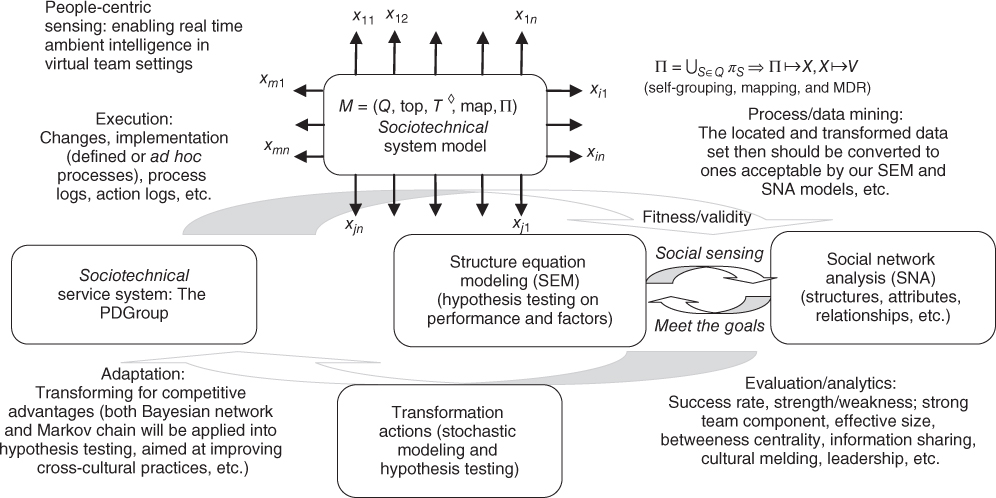
Figure 6.18 Lifecycle of the PDGroup exploration: model, evaluation, transformation, and adaptation.
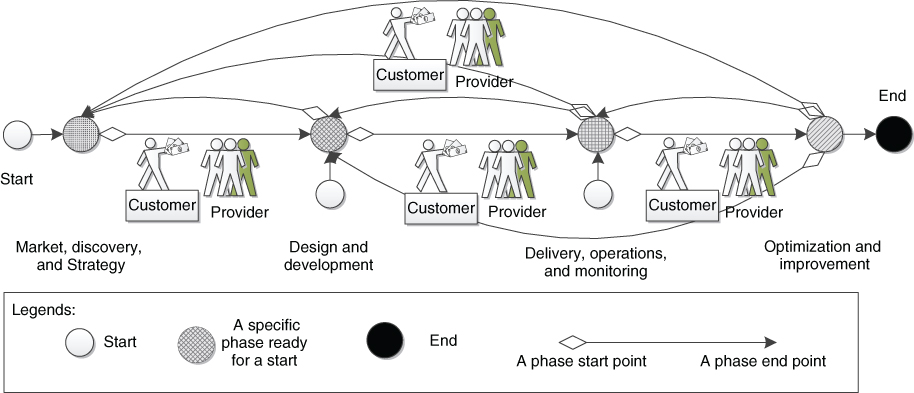
Figure 6.19 Cocreation-oriented management in pursuit of a series of positive service interactions.
The efficacy and effectiveness of planning and design of the service encounter network throughout the service lifecycle will directly impact the value of the provided service. It is well understood that the execution of a service might require some changes at the point of delivery. Sometimes the execution could be substantially deviated from its original design and plan. Evidently, engineering, operating, and managing services in a world-class service organization are extremely complex and challenging. Therefore, managing and control of service (encounter) networks become necessary for service organizations to ensure that all the services will be designed, developed, delivered, and operated to meet the needs of both service providers and customers.
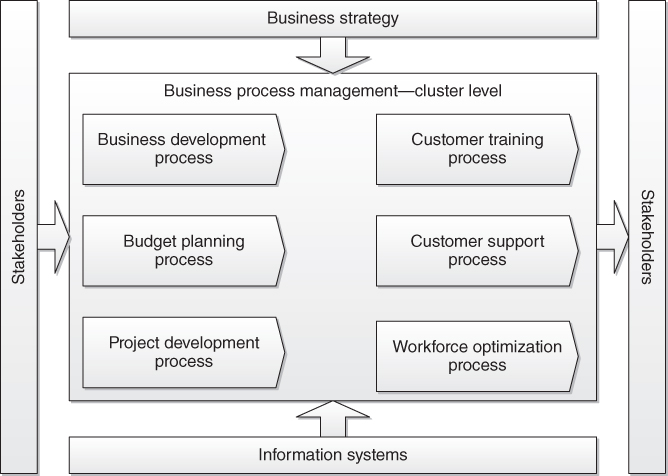
Figure 6.20 Business process management at the cluster level.
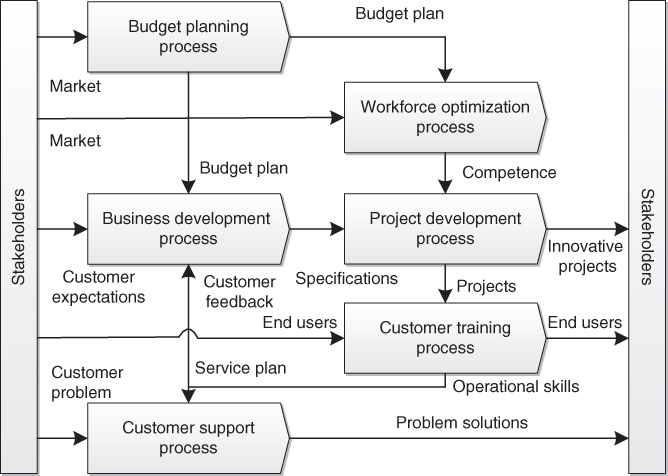
Figure 6.21 Business process interaction diagram at the cluster level.
6.5.3 Market, Discovery, and Strategy
At the market, discovery, and strategy phase, a project draft specification might be brainstormed when the top-level management group meets with a group of customer representatives. The participations of managerial and operational personnel from the organization and unit levels at different facilities of the ChemGlobalService are necessary. Onsite visits might also be needed, aimed at collecting the requirements from daily operations by discussing with end users.
In addition to paying attention to collecting service requirements by fully understanding customers' operational and social-psychological needs, the PDGroup should also pay attention to its organizational supports. Figures 6.20 and 6.21 show how a variety of supports from the organization should be well defined and accordingly coordinated in a collaborative and effective manner.
More specifically, the PDGroup starts to work with customers to understand their needs and starts to lay out a plan for managing and controlling service networks in a comprehensive and holistic way by paying considerable attention to the following four flows on the service profit chain:
- Customer Dynamics Flow. Working with customers to understand both the utilitarian and psychological needs of customers; planning a chain of positive and interactive service encounters; and defining a contingency plan to recover service failures.
- Organizational Behavior Flow. Working on a plan to ensure that the project can also result in a high level of employees' job satisfaction while surely meeting the customers' utilitarian and psychological needs through enabling a chain of positive and interactive service encounters. Appropriate training for employees in the PDGroup might be necessary.
- Physical Flow. Planning the supports for service engineering, operations, and delivery, such as providing employees and customers with the right tools, servicescape, and other necessary resources.
- Information Flow. Facilitating the collection of service requirements; planning tools and IT services that can capture right data/information in a timely manner and support all operational and managerial needs in a more intelligent way across the service lifecycle.
6.5.4 Design and Development
At the design and development phase, the project specification is usually revised and significantly adjusted and enriched. This is particularly true when more technical functionalities become clearer as time goes. Unless the project is completed, it is typical that the specification will keep changing to some extent. Surely each revision will be the outcome of numerous onsite or virtual meetings among related representatives from the ChemGlobalService and all teams, that is, Team A to Team G. Changes are probably requested and then applied after each test. Customer representatives could be directly or indirectly contacted by group members if necessary. In addition, the capability of teams should be appropriately identified, developed, and aligned with the needs of development tasks.
Note that by relying on a generic computational model, a collaborative process-aware development and management framework can be applied to facilitate service execution across the service lifecycles (Figure 6.22). At this stage, the applied framework provides flexible and adaptable mechanisms to foster team member interactions. Figure 6.22 supports the collection of systems, human interaction, and consequence data when teams work on assigned tasks. All the activity data especially how members collaborate with each other can be appropriately recorded as needed.
At the second phase of the service lifecycle in this example, the PDGroup begins to carry out the plan developed at the market, discovery, and strategy phase. Engineering the needed IT solution is the focus at this stage. The PDGroup still has an opportunity to enhance the solution delivery and operational plan. As a key component of the value cocreation process in providing IT solution services, the PDGroup should also manage and control the formed service networks in a comprehensive and holistic way by paying considerable attention to the following four flows:
- Customer Dynamics Flow. Working with customers to cocreate the integration solution to address the needs of the ChemGlobalService. The PDGroup might start to provide appropriate training activities for customers.
- Organizational Behavior Flow. Continuously focusing on employees' job satisfaction by designing and preparing the chain of interactive service encounters necessary for ChemGlobalService's employees to run the integration solution. Engineering the needed solution in a satisfactory and competitive manner becomes the highest priority within the PDGroup.
- Physical Flow. Providing employees and customers with the right tools, servicescape, and other necessary resource supports to facilitate service encounters at this phase in meeting the needs of engineering the needed IT solution.
- Information Flow. Capturing right data/information in a timely manner and supporting the operational and managerial needs in a more intelligent way at this phase so that the trusted data, information, and knowledge can be provided at the point of need.
6.5.5 Delivery, Operations, and Monitoring
At the delivery, operations, and monitoring phase, most likely, people from Teams A, B, C, D, and E would have to be involved. PDGroup must make sure that end users will be well trained. The daily business operations can be well coordinated and monitored among three facilities. During operations, member profiles, communication timing and frequencies, adopted communication media, and delivery and operational data are critical to both the PDGroup and ChemGlobalService. Data transformation algorithms to support process/data mining and analytics in support of operations and management are extremely important at this stage.
The PDGroup continues to carry out the plan by delivering the engineered solution to the ChemGlobalService's facilities. Customers begin to really appreciate the value cocreated with the provider. The PDGroup should continue to manage and control service networks in a comprehensive and holistic way by paying much attention to the four flows so that the service value cocreation process can be carried out in a satisfactory manner:
- Customer Dynamics Flow. Meeting both the utilitarian and psychological needs of customers; delivering the solution by leveraging a chain of collaborative and interactive service encounters; and ensuring that the customers have the appropriate training, utilize the solution well, and get responsive helps if needed.
- Organizational Behavior Flow. Making sure that all field support employees are appropriately assigned and well trained; continuously focusing on employees' job satisfaction by meeting the customers' utilitarian and psychological needs through enabling a chain of interactive and positive service encounters.
- Physical Flow. Providing field employees and customers with the right tools, servicescape, and other necessary resource supports to support service encounters at this phase in meeting the needs of service delivery and operations.
- Information Flow. Capturing delivery and operational data/information in a timely manner; supporting the operational and managerial needs by delivering the right data, information, and knowledge service to end users at the point of need.
6.5.6 Optimization and Improvement
At the optimization phase, for this kind of IT solution service project, it might be true that teams are reorganized after the engineered IT solution is successfully deployed on a customer site. We assume that all the teams will remain although they might be scaled down somewhat. If the service is not phased out yet, all teams should be involved to some degree. However, Teams A, B, and G would have more interaction with related representatives from the ChemGlobalService, aimed at understanding the weakness of the deployed solution and new additions to the changes of business operations. As indicated in Figure 6.22, vector-continued fractions, robust optimization, or other optimizations can be utilized for cause-effect analysis and prediction under changes (Qiu et al., (2011). The PDGroup can focus on refining and delivering rules of thumb to guide the participating teams to retune their collaborative protocols in a proactive and real-time manner to improve team performances.
Like other phases, the four flows should also be comprehensively and real-time explored to ensure that all aspects of the deployed solution under operation are understood. Issues and areas for improvements are identified as time goes. Ultimately, the optimal solution can be delivered, operated, and managed through well-executed collaborations between the service provider and the customers.
6.5.7 Final Remarks on This Exploratory Example
This example provides an overview discussion on how computational thinking can be well applied to exploring service systems. With the support of computing, networking, and service science, a service system can be managed and controlled with scientific rigor. A service system must be managed and controlled in a comprehensive and holistic way by simultaneously paying significant attention to the following four flows on the service profit chain:
- Customer Dynamics Flow. Meeting both the utilitarian and psychological needs of customers; focusing on a chain of interactive service encounters. Customer dynamics flow must be explored with the support of behavioral science, consumer behavior, and cognitive science, to offer and truly create an excellent customer experience.
- Organizational Behavior Flow. Focusing on employees' job satisfaction by meeting the customers' utilitarian and psychological needs through enabling a chain of interactive and positive service encounters. Organizational behavior flow must be explored with the support of behavioral science, cognitive science, individual and group dynamics, organizational dynamics, operations management, and workforce optimization to improve job satisfaction and organizational behavior.
- Physical Flow. Focusing on the conduits of service provision. An efficient and effective physical flow should provide employees and customers with the right tools, servicescape, and other necessary resource supports to facilitate service encounters in meeting both utilitarian and psychological needs of customers while improving job satisfaction.
- Information Flow. Capturing right data/information in a timely manner and supporting the operational and managerial needs in a more intelligent way across the service lifecycle. An optimal information flow should enable the right data, information, and knowledge service for employees and customers at the point of need.
Indeed, the above-mentioned four flows shift their priorities as services progress throughout their lifecycles. From this exploratory example, we understand that systems performance and network analytics can be applied to services in a complementary manner. We provide much more detailed discussions with analytics examples in Chapters 7 and 8, which will help readers understand that the presented science to service in this book, as one approach to help service organizations discover, design, engineer, and manage their competitive services, can be scientifically applied in practice.
6.6 Conclusions
In today's globalized economy, enterprises are keen on building highly profitable service-oriented businesses by taking advantage of their own unique engineering and service expertise, aimed at shifting gears toward creating superior outcomes to best meet their customer needs in order to stay competitive. However, there is a lack of full-fledged sciences that could systematically guide the plan, design, marketing, engineering, and delivery of services to meet the challenges highlighted by changes, complexity, and dynamics from political, social, and economic aspects; thus, we are in great need of the theory and principles toward engineering, operating, managing, and evolving service systems in the service-led economy.
By fully leveraging today's ubiquitous digitalized information, computing capability, and computational power, this Chapter presented an approach to model the dynamics and adaptiveness of service systems, enabling mechanisms of people-sensing to capture their physiological and psychological issues, cognitive capability, and sociological constraints during the lifecycle of service. The presented approach has more potential, including the enablement of system configurability. As we fully took into account service system's characteristics (e.g., people-sensing, cocreation values, human interactions, and consequences), this Chapter should lay out a solid foundation for the later chapters.
As discussed earlier, the following mechanisms should be developed to implement and enhance service systems:
- A mechanism to timely capture end users' requirements, changes, expectation, and satisfaction in a variety of technical, social, and cultural aspects
- A mechanism to efficiently and cost-effectively provide employees right means and assistances to engineer services while promptly responding the changes
- A mechanism to allow involved people consciously infuses as much intelligence as possible into all levels and aspects of decision making to assure necessary system adaptiveness for smarter operations.
As these mechanisms vary with service systems, they must be developed and enhanced over time. Ultimately, with the support of service science, service systems will then be operated in a smarter, competitive, and satisfactory manner.
Acknowledgment
A significant portion of this Chapter is derived from a paper entitled “Computational Thinking of Service Systems: Dynamics and Adaptiveness” that was published in an INFORMS' journal—Service Science. The paper received the best paper award in 2013 from the INFORMS Service Science Section, recognizing publication excellence in the Section's journal Service Science from 2009 to 2012. Reprinted by permission of the publisher.
References
- Buchanan, L. (2013). Between Venus and Mars: 7 traits of true leaders. Inc. Magazine, June, 64–74+130.
- BusinessWeek. (2009). When service means survival. BusinessWeek, March 2, 26–40.
- Campbell, A., Lane, N., Miluzzo, E., Peterson, R., Lu, H., Zheng, X., Musolesi, M., Fodor, K., Eisenman, S., & Ahn, G. (2008). The rise of people-centric sensing. IEEE Internet Computing, July–August, 12–21.
- CMU. (2009). What is computational thinking? Center for Computational Thinking at Carnegie Mellon, Retrieved on 2009 from http://www.cs.cmu.edu/∼CompThink/index.html.
- Duarte, D., & Snyder, N. (2001). Mastering Virtual Teams. San Francisco, CA: Jossey-Bass, A Wiley Imprint.
- Dunham, M. (2003). Data Mining: Introductory and Advanced Topics. Upper Saddle River, NJ: Prentice Hall.
- Dustdar, S. (2004). Caramba—a process-aware collaboration system supporting ad hoc and collaborative processes in virtual teams. Distributed and Parallel Databases, 15, 45–66.
- Dustdar, S., Hoffmann, T., & van der Aalst, W. (2005). Mining of ad-hoc business processes with Teamlog. Data & Knowledge Engineering, 55, 129–158.
- Gerzema, J., & D'Antonio, M. (2010). Spend Shift: How the Post-crisis Values Revolution is Changing the Way We Buy, Sell, and Live. San Francisco, CA: Jossey-Bass.
- Girardin, F., Blat, J., Calabrese, F., Fiore, F., & Ratti, C. (2008). Digital footprinting: uncovering tourists with user-generated content. Pervasive Computing, October–December, 36–43.
- IBM Global Business Services. (2012). Analytics: the real-world use of big data—how innovative enterprises extract value from uncertain data. IBM Global Business Services Business Analytics and Optimization Executive Report. Retrieved on Mar. 5, 2013 from http://www-935.ibm.com/services/us/gbs/thoughtleadership/ibv-big-data-at-work.html.
- IBM Global Business Services. (2013). Analytics: a blueprint for value: converting big data and analytics insights into results. IBM Global Business Services Business Analytics and Optimization Executive Report. Retrieved on Mar. 5, 2013 from http://public.dhe.ibm.com/common/ssi/ecm/en/gbe03575usen/GBE03575USEN.PDF.
- Jazz. (2012). About Jazz—Overview. Retrieved on May 10, 2012 from https://jazz.net/learn/.
- Kanellos, M. (2004). Perspective: IBM's service science. CNET News. Retrieved on Dec. 10, 2012 from http://news.cnet.com/2010-1008_3-5201792.html.
- Kotler, P. (2010). Forward in Spend Shift: How the Post-crisis Values Revolution is Changing the Way We Buy, Sell, and Live, ed. by J. Gerzema and M. D'Antonio. San Francisco, CA: Jossey-Bass.
- Martensen, A., & Gronholdt, L. (2003). Improving library user's perceived quality satisfaction and loyalty: an integrated measurement and management system. The Journal of Academic Librarianship, 29(3), 140–147.
- Partnership for Public Service. (2011). From data to decisions: the power of analytics. IBM Center for the Business of Government. Retrieved on Dec. 6, 2012 from http://www.businessofgovernment.org/report/data-decisions-power-analytics.
- Partnership for Public Service. (2012). From data to decisions II: building an analytics culture. IBM Center for the Business of Government. Retrieved on June 6, 2013 from http://www.businessofgovernment.org/report/data-decisions-ii.
- PPF. (2012). Putting People First. Retrieved online Nov. 28, 2012 from http://www.experientia.com/blog/.
- Qiu, R. G. (2006). Towards ontology-driven knowledge synthesis for heterogeneous information systems. Journal of Intelligent Manufacturing, 17(1), 109–120.
- Qiu, R. G. (2009). Computational thinking of service systems: dynamics and adaptiveness modeling. Service Science, 1(1), 42–55.
- Qiu, R. G., Tang, Y., & Joshi, S. B. (2008). A process-driven computing model for reconfigurable semiconductor manufacturing. Robotics and Computer-Integrated Manufacturing, 24(6), 709–721.
- Qiu, R., Wu, Z., & Yu, Y., (2011). A tractable approximation approach to improving hotel service quality. Journal of Service Science Research, 3(1), 1–20.
- Rad, P., & Levin, G. (2003). Achieving Project Management Success Using Virtual Teams. Fort Lauderdale, FL: J. Ross Publishing.
- Runde, C., & Flanagan, T. (2008). Building Conflict Competent Teams. San Francisco, CA: Jossey-Bass, A Wiley Imprint.
- Schroeck, M. (2013). How to make real-world use of big data. The Huffington Post, A post entry by Michael Schroeck on April 3, 2013. Retrieved on June 6, 2013 from http://www.huffingtonpost.com/michael-j-schroeck/.
- Truong, H., Dorn, C. Casella, G. Pollleres, A., Reiff-Marganiec, S., & Dustar, S. (2008). inConText: On coupling and sharing context for collaborative teams. Proceedings of the 14th International Conference on Concurrent Enterprising : a New Wave of Innovation in Collaborative Networks, 225–232.
- Van Der Aalst, W. M., & Ter Hofstede, A. H. (2005). YAWL: yet another workflow language. Information Systems, 30(4), 245–275.
- Weske, M. (2007). Business Process Management: Concepts, Languages, Architectures. Berlin: Springer-Verlag.