
In this chapter we will focus on extending SharePoint by using UI elements that are not directly part of the SharePoint Foundation framework. The following topics are covered:
Developing custom charts
Using map services to display geospatial data
For integrating complex charts or dashboards, we will introduce various data access scenarios, ranging from basic CAML queries to direct database access with LINQ to SQL. Furthermore, we will give you an overview of the features within the Microsoft Chart Control framework. The final section of this chapter examines map services and shows how to integrate these services into SharePoint.
Before you can start to implement your own charts, dashboards, or maps, you need to decide on the most appropriate data access strategy for the situation. It's important that you have a clear view of your requirements, because the wrong choice of data access method could result in a nasty surprise later. You should ask yourself the following questions:
Data location: Where is the source of the data to be queried? Is it only in basic SharePoint lists? Or is there additional data, possibly connected by business data services?
Data size: How many items do you expect in your lists? How much will the lists grow over time?
Query complexity: How complex will the queries be? Do you have to join many lists together? Are you heavily using grouping and aggregation (
GROUP BY)?Performance: How many queries do you expect on a typical (dashboard) page? How many users are accessing this page in a given interval (e.g., queries per hour)? What should the maximum page load time be?
There are several ways to query data from the SharePoint database that we will briefly recap here. For in-depth coverage of the different data access methods, refer back to Chapter 4. More information about efficient data access can be found in Chapter 5.
Up to this stage, we have covered a lot about SharePoint and its customization possibilities. As developers, we can easily build our own Web Parts or application pages using the integrated SharePoint web controls. There is one important aspect we have not mentioned yet, though: the ability to build our own charts, dashboards, and map views. These graphical elements are indispensable for most modern business applications. This section covers several approaches to integrating charting capabilities into your own application pages or Web Parts:
Microsoft Chart Controls
Google Chart API
Google Visualization API
The Microsoft Chart Control can be used to create complex charting scenarios on the server side. In contrast, Google offers some very interesting JavaScript frameworks that can also be used for your custom implementations. The big difference between the two is that the Microsoft Chart Control is a pure server-side .NET library, whereas Google offers its APIs as quasi-services, freely accessible over the Internet, which can be embedded. Depending on your needs and your audience, it can be completely appropriate to use the public Google APIs, such as Google Maps, as we shall explore later in this chapter.
In recent years, Microsoft has been releasing and evolving the .NET Framework step by step. Many namespaces have been added, and the whole framework has become more powerful. However, no effort had been made to integrate or offer charting components for visualizing data. Developers had to license third-party components from specialized vendors.
This finally changed in 2008, when Microsoft licensed one of the best available charting components on the market. Dundas (www.dundas.com/) is one of the leaders in data visualization. It provides well-known chart, gauge, map and other visual controls for different Microsoft development platforms (ASP.NET, Windows Forms, SQL Reporting Services, and SharePoint).
The licensed package resulted in the Microsoft Chart Controls, a free downloadable .NET library for the .NET Framework 3.5 (SP1) with designer support for Visuals Studio 2008 (SP1).
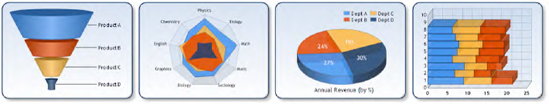
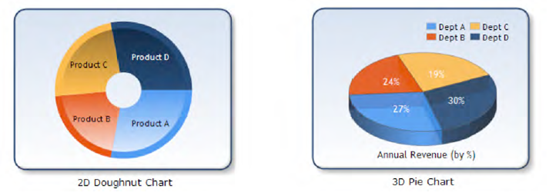
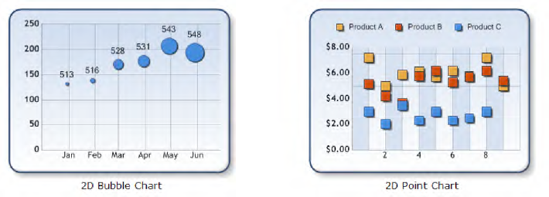
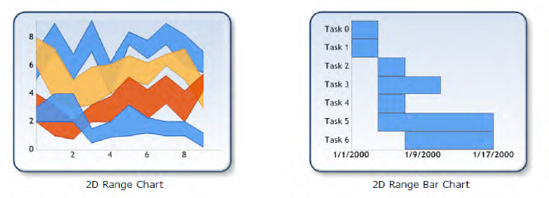
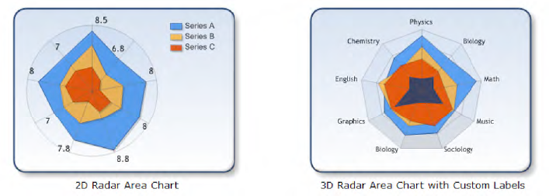
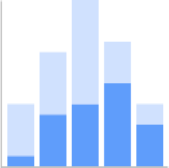
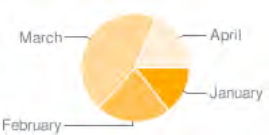
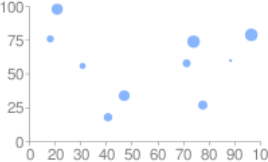
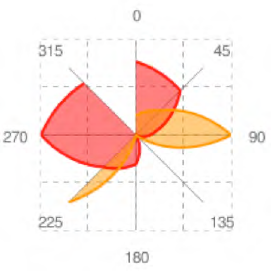
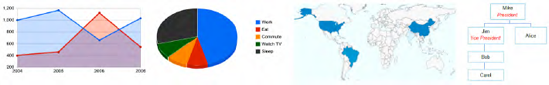
Now the Microsoft Chart Controls (namespace System.Web.UI.DataVisualization.Charting) are an integral part of the .NET Framework 4.0 and can be used for web and Windows Forms applications (see Figure 14-1 for some examples).
If you want to use the Microsoft Chart Controls with .NET Framework 3.5 SP1 and Visual Studio 2008, you need to download and install the following components (see Table 14-1).
Table 14.1. Prerequisites for Microsoft Chart Controls on .NET Framework 3.5 SP1
Component | Downloadable From |
|---|---|
Visual Studio 2008 SP1 |
|
.NET Framework 3.5 SP1 |
|
Microsoft Chart Controls |
|
Microsoft Chart Controls add-on for Visual Studio 2008 |
|
Microsoft Chart Controls documentation |
|
Microsoft Chart Controls samples |
|
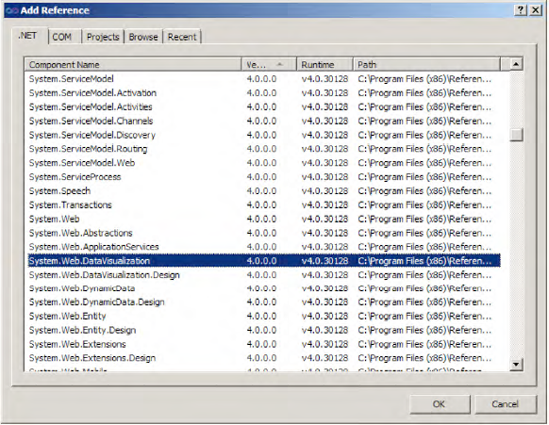
Since the .NET Framework 4.0, the charting controls have been included within System.Web.DataVisualization.dll. You can use the chart control from within Visual Studio 2010 if you add a reference to the DLL (see Figure 14-2).
Tip
A good entry point for working with the Microsoft Chart Controls is the MSDN documentation. Start at the following URL: http://code.msdn.microsoft.com/mschart.
Both Visual Studio 2008 and 2010 offer design support for charts. For Visual Studio 2008 you first have to download and install the Microsoft Chart Controls add-on for Microsoft Visual Studio. Visual Studio 2010 has built-in design support, and no additional installation is necessary. The design support provides toolbox integration and IntelliSense for ASP.NET and Windows Forms chart controls.
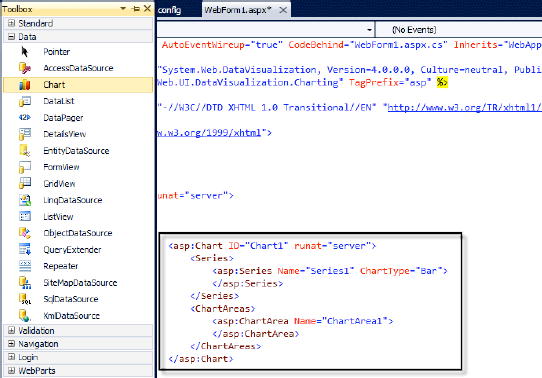
Once installed, the <asp:chart/> control appears under the Data tab in the toolbox, and can be declared on any ASP.NET page as a standard server control, as shown in Figure 14-3.
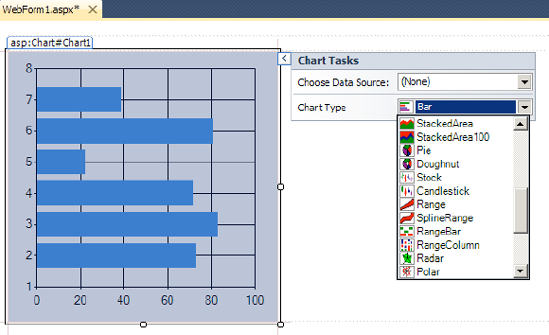
<asp:chart/> supports a rich assortment of chart options, including pie, area, range, point, circular, accumulation, data distribution, Ajax interactive, and doughnut. Figure 14-4 shows the chart web control within the Visual Studio design view.
The chart controls offer the key features shown in Table 14-2 (see also on MSDN at http://msdn.microsoft.com/en-us/library/dd456632(VS.100).aspx).
Table 14.2. Key Features for Microsoft Chart Controls
Category | Feature |
|---|---|
Development environment | Visual Studio design-time support |
Scalability | Support for an unlimited number of chart areas, titles, legends, and annotations Support for an unlimited number of data series and data points |
Chart types | Thirty-five distinct chart types |
Data | Data binding Data copying, merging, splitting, sorting, searching, grouping, and filtering Data exporting Binary and XML serialization Empty data point handling Support for dates, times, currency, and more More than 50 financial and statistical formulas for data analysis and transformation |
Appearance | 3D support for most chart types Automatic and manual layout and alignment management 3D customization Fully customizable legends Automatic and manual scaling Logarithmic scaling for any base Intelligent data label positioning Annotations, labels, scale breaks, and interlaced strip lines |
Customizations | Real-time chart manipulation Postpaint and prepaint events Drill-down charts and tool tips |
Windows Forms specific | Zooming and scrolling Chart printing |
ASP.NET specific | Support for Ajax click events State management Binary streaming Animated frame rate control |
Several prerequisites must be met before you can use the Microsoft Chart Controls within SharePoint. First, you need to register the chart HTTP handlers for in-memory image generation. To do this, add the following lines (see Figure 14-5) to the root web.config file of your SharePoint web application (commonly at c:inetpubVirtualDirectoriesPORTweb.config).
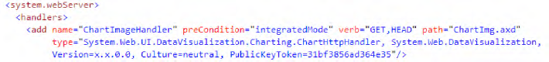
After adding ChartImageHandler as shown in Figure 14-5, add an application settings entry to configure your handler to use in-memory storage of your images (see Figure 14-6).
Other valid values for the Storage parameter of the application settings entry ChartImageHandler include file and session, though we recommend setting to memory. The last preparatory step is to include the new chart tag, either in the web.config under configuration/system.web/pages/controls or directly within the ASPX page declaration.
<add tagPrefix="asp" namespace="System.Web.UI.DataVisualization.Charting"
     assembly="System.Web.DataVisualization, Version=3.5.0.0, Culture=neutral,
     PublicKeyToken=31bf3856ad364e35"/>
Having fulfilled all the prerequisites, you can add a simple chart to an ASPX application page by adding code similar to that shown in Listing 14-1.
Example 14.1. Simple Chart Declaration
<asp:Chart ID="myChart" runat="server">
    <Series>
        <asp:Series Name="Series1" >
            <Points>
                <asp:DataPoint Label="Joerg" YValues="5" />
                <asp:DataPoint Label="Chris" YValues="7" />
            </Points>
        </asp:Series>
    </Series>
    <ChartAreas>
        <asp:ChartArea Name="ChartArea1">
        </asp:ChartArea>
    </ChartAreas>
</asp:Chart>
Figure 14-7 displays the output of the code from Listing 14-1—a simple bar chart.
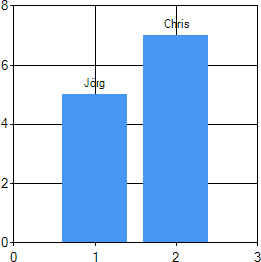
The examples and documentation available with the Microsoft Chart Control are helpful and comprehensive. Using the Chart control is very straightforward. Simply drag a chart control onto an ASPX page, set the properties, and bind data to the chart.
You can either statically declare chart data within the control declaration or use data binding to populate it dynamically. At runtime the server control generates an image (e.g., a .PNG file) that is referenced from the client HTML of the page using a <img/> element output by the <asp:chart/> control. The server control supports caching of the chart image, as well as saving it to disk for persistent caching scenarios. It does not require any other server software to be installed, and will work with any standard ASP.NET page.
A chart image is composed of various elements, including legends, axes, and series. Each such element is mapped to an object in the Microsoft Chart Control namespace. Figure 14-8 shows the elements of a chart control.
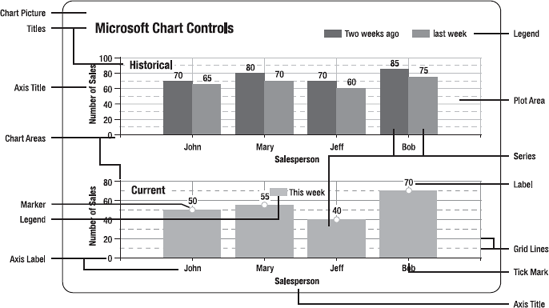
The chart control API is object oriented, extensible, and highly flexible. An unlimited number of key chart elements such as data series or data points in a series are supported. Table 14-3 shows a short description of the key elements.
Table 14.3. Description of Charting Control Elements
Element | Description |
|---|---|
| Defines the area where a chart is plotted. Your chart may contain more than one chart area. You may plot more than one chart per render and you may even overlap charts. |
| Consists of the data to plot on your chart area. |
| (under the |
| Defines properties for the x and y axes, such as appearance and titles. |
| Defines the colors set for your chart. |
| Defines text that may be used to describe a chart, an axis, or any other part of the chart. |
| Defines the legends that will display the data series information. |
| Defines text that may be displayed, for example, close to an axis or point (includes custom labels). |
The Microsoft Chart Control supports various data binding scenarios. It provides a simple and consistent way to visualize data. The most common way to binding data is to use an IEnumerable object, such as a DataView, DataReader, DataTable, DataSet, Array, or List. To understand Chart Control data binding, you first have to be familiar with series and data points. All data for a chart is rendered as a series, and each series consists of data points. Each data point has an X value and one or more Y values, depending on the chart type, that determine where a data point is plotted (DataPoint.XValue, DataPoint.YValues).
There are several data binding methods available (see Table 14-4).
Table 14.4. Data Binding Methods
Method | Description |
|---|---|
| This is a simple binding for X and Y values. It automatically creates series for the columns in the data source. |
| This method allows data binding at design time. |
| This binds data and offers grouping functionality. |
| This binds complex |
| This binds X and Y values to a series. |
| This method is for manually adding points to a series. |
The next few pages show some examples on how to use the various data binding methods in your code.
Chart.DataBindTable
With the Chart.DataBindTable method, you can easily bind a table containing several columns. You can choose one column for the X value, and for each of the other columns a new series will be created automatically.
To demonstrate this, assume there is a SharePoint list called ProductSales. This list contains sales data for several products. Every row has a salesperson name (here, Title) and four article fields (Article1 to Article4) with numeric data (see Figure 14-9).
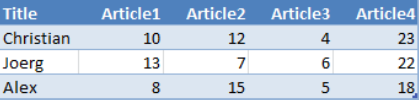
Binding this SharePoint list to a chart control is elementary. You define a CAML query that contains at least the required field names for the chart. Then you call the SPList.GetDataTable method to execute the query and return a DataTable instance. The final step is to bind the DataTable.DefaultView using the Chart.DataBindTable method (see Listing 14-2).
Example 14.2. Binding a SharePoint List via GetDataTable
private void DataBindTableExample()
{
    SPQuery query = new SPQuery();
    query.ViewFields = "<FieldRef Name='Title'/>" +
         "<FieldRef Name='Article1'/>" +
         "<FieldRef Name='Article2'/>" +
         "<FieldRef Name='Article3'/>" +
         "<FieldRef Name='Article4'/>";

    SPList productSalesList = this.Web.Lists["ProductSales"];
    SPListItemCollectionPosition colPos;
    DataTable dt = productSalesList.GetDataTable(query,
            SPListGetDataTableOptions.None, out colPos);

    myChart.DataBindTable(dt.DefaultView, "Title");
}
The example in Listing 14-2 results in a chart like the one shown in Figure 14-10.
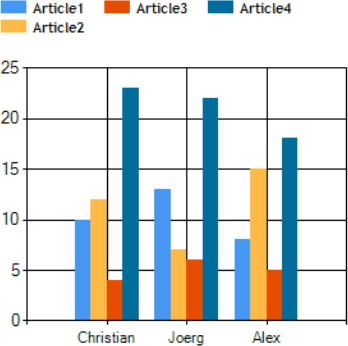
Chart.DataSource
To bind data using the Chart.DataSource property, you first create one or more series and set their XValueMember and YValueMembers property names. If multiple Y values are required, they can be bound if you supply a comma-separated list to the YValueMembers. The binding itself takes place automatically just before rendering, meaning that you don't need to explicitly call Chart.DataBind in your code.
The example in this section uses the same data source as the preceding example (ProductSales). Naturally, it also produces the same output as shown in Figure 14-10. The main difference is that it uses a LINQ data source in conjunction with several static series declarations. Listing 14-3 shows the chart series and the LINQ data source declarations.
Example 14.3. Declarartion of Chart Series and a LINQ Data Source
<asp:Chart ID="myChart" runat="server">
    <Series>
        <asp:Series Name="Article1" XValueMember="SalesName" YValueMembers="Article1" />
        <asp:Series Name="Article2" XValueMember="SalesName" YValueMembers="Article2" />
        <asp:Series Name="Article3" XValueMember="SalesName" YValueMembers="Article3" />
        <asp:Series Name="Article4" XValueMember="SalesName" YValueMembers="Article4" />
    </Series>

    <ChartAreas>
        <asp:ChartArea Name="ChartArea1" ></asp:ChartArea>
    </ChartAreas>
</asp:Chart>

<asp:LinqDataSource runat="server" ID="linqDS" OnSelecting="linqDS_Selecting"  />
The code-behind for this data binding example also looks straightforward (see Listing 14-4). As you can see, the LINQ data source linqDS is simply assigned to the Chart.DataSource property. The implementation of the data source uses a CAML query to retrieve the list items from the SharePoint list ProductSales, and returns an anonymous type containing the properties SalesName and Article1 to Article4. The X and Y value members of the series take those properties and ensure the correct chart rendering (see Figure 14-10 again).
Example 14.4. Data Binding and LINQ Data Source Implementation
protected void Page_Load(object sender, EventArgs e)
{
    // Assign the data source
    myChart.DataSource = linqDS;
}

protected void linqDS_Selecting(object sender, LinqDataSourceSelectEventArgs e)
{
    SPList list = SPContext.Current.Web.Lists["ProductSales"];
    IEnumerable<SPListItem> sales = list.GetItems(
                                          new SPQuery()).OfType<SPListItem>();
    e.Result = from salesItem in sales
       select new
       {
           SalesName = Convert.ToString(salesItem["Title"]),
           Article1 = Convert.ToInt32(salesItem["Article1"]),
           Article2 = Convert.ToInt32(salesItem["Article2"]),
           Article3 = Convert.ToInt32(salesItem["Article3"]),
           Article4 = Convert.ToInt32(salesItem["Article4"])
       };
}
Chart.DataBindCrossTab
The Chart.DataBindCrossTab method supports automatic grouping of unique values in a column. Each unique value in the specified grouped column results in the creation of a new data series. Furthermore, you can bind extended data properties, such as AxisLabel, Tooltip, and Label, to the chart.
The example data for this section is shown in Figure 14-11. For every salesperson (Title) and year (Year), a quantity for Article1 complemented by a sales ranking for that year (YearRanking) is included.
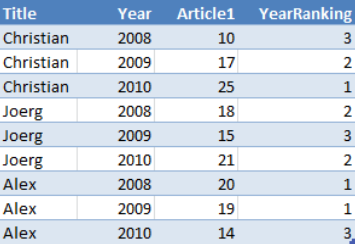
The resulting line chart for this data looks like Figure 14-12. Every salesperson has his or her own series that displays Article1 on the y axis and the Year on the x axis. In addition, the YearRanking is rendered as a label.
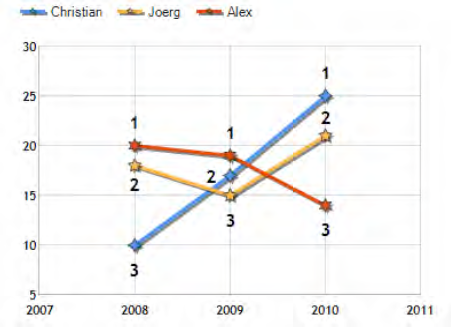
As shown in Listing 14-5, the DataBindCrossTab method takes DataTable.DefaultView as an input parameter. The series are defined by the second parameter (Title) followed by property names for the X and Y values (Year and Article1). Additionally, the last parameter contains an extended data property definition using this syntax:
In the following example, Label=YearRanking is defined, which results in rendering the YearRanking value as labels within the chart.
Example 14.5. Data Binding with Automatic Grouping Using DataBindCrossTab Method
private void DataBindCrossTabExample()
{

    SPQuery query = new SPQuery();
    query.ViewFields = "<FieldRef Name='Title'/>" +
         "<FieldRef Name='Year'/>" +
         "<FieldRef Name='Article1'/>" +
         "<FieldRef Name='YearRanking'/>";

    SPList productSalesList = this.Web.Lists["ProductSalesWithYears"];
    SPListItemCollectionPosition colPos;
    DataTable dt = productSalesList.GetDataTable(query,
            SPListGetDataTableOptions.None, out colPos);

    myChart.DataBindCrossTable(dt.DefaultView, "Title", "Year",
          "Article1", "Label=YearRanking");

    // Set series appearance
    MarkerStyle marker = MarkerStyle.Star4;
    foreach (Series ser in myChart.Series)
    {
        ser.ShadowOffset = 2;
        ser.BorderWidth = 3;
        ser.ChartType = SeriesChartType.Line;
        ser.MarkerSize = 12;
        ser.MarkerStyle = marker;
        ser.MarkerBorderColor = Color.FromArgb(64, 64, 64);
        ser.Font = new Font("Trebuchet MS", 12, FontStyle.Bold);
        marker++;
    }
}
The code in Listing 14-5 follows a similar style to the other data binding methods. You commence by retrieving data via a CAML query into a DataTable. Then you bind the DataTable.DefaultView to the chart. Finally, you can modify the autocreated series and assign custom styles, such as chart types, borders, markers, colors, and fonts.
Points.DataBind and Points.DataBind[X]Y
This data binding method allows you to bind X and Y values to a series. Also, the binding syntax enables you to define extended data properties, such as AxisLabel, Tooltip, Label, LegendText, and LegendTooltip. A simple example looks like:
myChart.Series["mySeries"].Points.DataBind(
        dataView, "Year", "Article1", "Tooltip=YearRanking")
The usage is similar to Chart.DataBindCrossTab, but it is only related to one series, and thus it has no grouping functionality.
Beyond the Points.DataBind method, there are two further methods: Points.DataBindY and Points.DataBindXY. The various methods are defined as follows:
DataPointCollection.DataBind(IEnumerable dataSource, string xField,
                              string yFields, string otherFields)
DataPointCollection.DataBindY(IEnumerable yValue, string yFields)
DataPointCollection.DataBindY(params IEnumerable[] yValue)

DataPointCollection.DataBindXY(IEnumerable xValue, params IEnumerable[] yValues)
DataPointCollection.DataBindXY(IEnumerable xValue, string XField,
                               IEnumerable yValue, string yFields)
As you can see in the definitions, the main difference between the methods is that DataBind has one data source (IEnumerable dataSource), whereas the other methods may have multiple data sources for X and Y values.
The example in Listing 14-6 demonstrates querying data using LINQ on a data model generated using SPMetal and binding the data with the DataBind method.
Example 14.6. Binding an Anonymous Type to a Chart Series Using LINQ
protected void DataBindPointsExample()
{
SPDataContext ctx = new SPDataContext(SPContext.Current.Web.Url);
// Create LINQ join query
var result =
from sale in ctx.ProductSalesWithYears
where sale.Title == "Christian"
select new
{
SalesName = sale.Title,
Year = sale.Year,
ArticlesSold = sale.Article1,
TooltipText = sale.Title + " sold " + sale.Article1
+ " articles in " + sale.Year,
LabelText = "Ranking for " + sale.Year + ": "
+ sale.YearRanking
};
myChart.Series[0].Points.DataBind(result.ToArray(), "Year", "ArticlesSold",
"ToolTip=TooltipText,Label=LabelText");
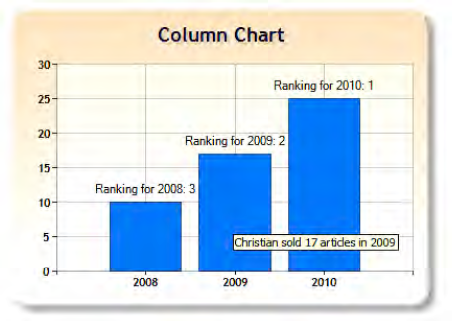
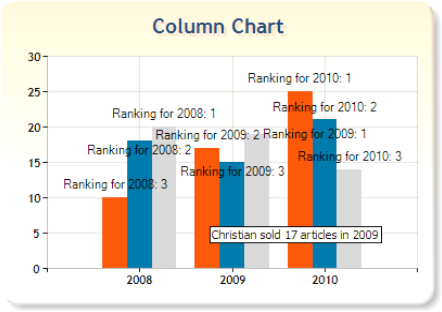
}SPDataContext contains the SharePoint data model for the list ProductSalesWithYears (shown in Figure 14-13). The example uses a LINQ query to retrieve all items containing Christian as Title. The result is prepared for data binding using a new anonymous type. This type contains the properties SalesName, Year, ArticlesSold, TooltipText, and LabelText, which are directly bound to the chart series. The resulting chart looks like Figure 14-13.
Manual Data Population by Adding Data Points
The data binding methods introduced in the preceding paragraphs are sufficient for many scenarios. But if you are ever faced with more complex requirements and you need full control over the data population process, you can also manually add data points to a series. This approach is also useful if you are working with calculated data. The example in Listing 14-7 shows how to iterate through data received using LINQ, including creating series and adding data points.
Example 14.7. Manually Populationg Charts Using LINQ and DataPoints
private void ManualDataPopulationExample()
{
    SPDataContext ctx = new SPDataContext(SPContext.Current.Web.Url);

    // Query the SharePoint list "ProductSalesWithYears"
    var result = from sale in ctx.ProductSalesWithYears
        select new
        {
            SalesName = sale.Title,
            Year = sale.Year,
            ArticlesSold = sale.Article1,
            TooltipText = sale.Title + " sold " + sale.Article1 +
                                       " articles in " + sale.Year,
            LabelText = "Ranking for " + sale.Year + ": " + sale.YearRanking
        };

    // Getting all sales names (Christian, Joerg, Alex)
    var salesNames = (from s in result select s.SalesName).Distinct();

    // Creating a series for every sales name
    foreach (var seriesName in salesNames)
{
// Create a new series
Series newSeries = new Series(seriesName);
newSeries.ChartType = SeriesChartType.Column;
newSeries.BorderWidth = 2;
myChart.Series.Add(newSeries);
var seriesData = from r in result where r.SalesName == seriesName select r;
foreach (var resultItem in seriesData) {
// Creating a DataPoint
DataPoint dp = new DataPoint();
// Assign X and Y values
dp.SetValueXY(resultItem.Year, resultItem.ArticlesSold);
// Assign Label and Tooltip
dp.Label = resultItem.LabelText;
dp.ToolTip = resultItem.TooltipText;
// Add DataPoint to series
newSeries.Points.Add(dp);
}
}
}The code in Listing 14-7 requires an SPDataContext and model classes generated using SPMetal. A LINQ query retrieves all items from the SharePoint list ProductSalesWithYears and creates an anonymous type that consists of some properties. For every different SalesName, a new series is created. Therefore, the example uses a distinct LINQ query that returns all the different SalesName strings. A loop iterates through the salesName strings and creates a new series for each element. A further LINQ query returns all the data for the current SalesName within the loop and creates DataPoint objects. These DataPoint objects are populated with data for X and Y values, and the Label and ToolTip properties are set. Finally, the DataPoint objects are added to the series. The resulting chart is shown in Figure 14-14.
Microsoft has a samples document for Microsoft Chart Controls available for download at http://code.msdn.microsoft.com/mschart). This package contains over 200 chart samples to inspire your own custom charts. To give you a taste of the great visualization possibilities, some well-chosen examples of the chart control sample galleries follow:
Bar and column charts
Line charts
Area charts
Pie and doughnut charts
Point charts
Range charts
Accumulation charts
Financial charts
Bar and Column Charts
Bar and column charts (see Figure 14-15) illustrate comparisons among individual items. Bar charts are mostly used for comparing categories by their values, whereas column charts place more emphasis on comparing values over time. Bar and column charts support one Y value per X value. The number of series within one chart is not limited.
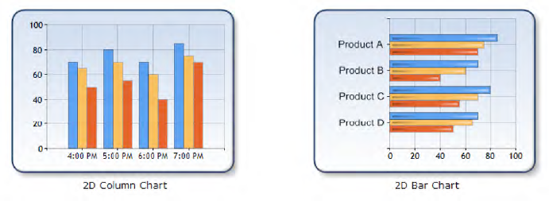
Line Charts
Line charts (see Figure 14-16) can be used to visualize trends along a timeline. Line charts support one Y value per X value. The number of series within one chart is not limited.
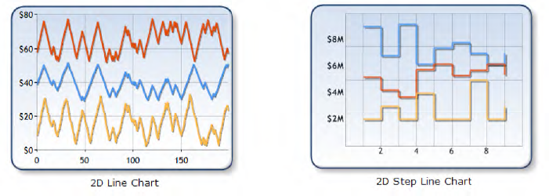
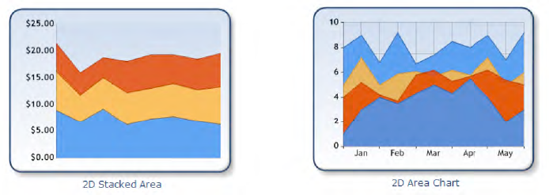
Area Charts
Area charts (see Figure 14-17) emphasize changes of data over time and show the relationship of different parts to a whole. Area charts support one Y value per X value. The number of series within one chart is not limited.
Pie and Doughnut Charts
Pie and doughnut charts (see Figure 14-18) show how proportions of data contribute to the data as a whole. They are both shown as pie-shaped pieces. Pie and doughnut charts support one Y value per X value. The number of series is limited to one series per chart.
Point Charts
Point charts (see Figure 14-19) use single-value points for displaying data. Point charts support one Y value per X value. The number of series within one chart is not limited.
Range Charts
Range charts (see Figure 14-20) display a range of data by plotting two Y values per data point. You can imagine those two Y values as two line charts that can be filled with color or an image. The number of series within one chart is not limited.
Radar Charts
Circular charts (see Figure 14-21), such as radar charts, are primarily used for data comparison. Unlike most other chart types, radar charts have no X values. Nevertheless the X axis is still used for displaying the labels around the chart, as well as spacing between the labels. The number of series within one chart is not limited.
Accumulation Charts
Accumulation charts (see Figure 14-22), such as funnel or pyramid charts, display data that equals 100 percent in total. These chart types have no axes; thus, they support only one Y value per category. The number of series is limited to one per chart.
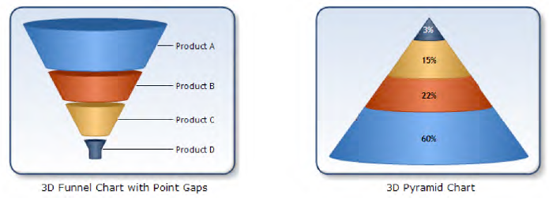
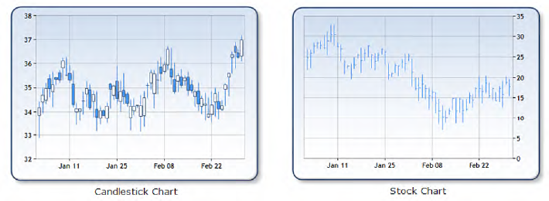
Financial Charts
Candlestick and stock charts (see Figure 14-23) are used to display stock information using four values: high, low, open, and close. The height of a line is determined by the high and low values. For a candlestick chart, the size of the bar and whether it is filled or not depend upon the open/close values. In a stock chart, the open/close values are plotted as small markers.
The Microsoft Chart Controls offer more than 35 distinct, professional chart types that can be used within application pages and Web Parts. If you are ever faced with implementing custom charts or dashboards, this package should be your first option to consider. With direct support for SharePoint list data and easy-to-use data binding techniques, the Microsoft Chart Control is a powerful toolset.
The Google Chart API is a charting service offered by Google. The charts are generated completely on Google servers. The data to be charted is passed within the query string to a URL. The response to such an HTTP request is a PNG image of the chart. Many types of charts are supported, and by embedding the URL into an image tag you can simply include the chart in your own application pages or Web Parts. Originally, Google built the Chart API for internal use in its applications. Later, Google opened up the API to web developers. One critical thing to bear in mind when using the Chart API in your own applications is security: all data that is displayed in charts is sent within the openly readable query string over the Internet to Google's servers. We strongly recommend against sending business-critical data, such as brand new revenue figures, over the Internet.
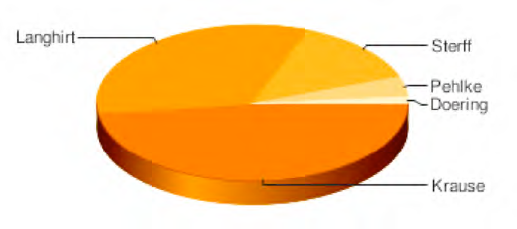
It is extremely easy to use the Google Chart API—simply insert the Chart API URL with some query string parameters into an image tag:
<img src="http://chart.apis.google.com/chart?cht=p3&chd=t:35,24,10,3,1&
                 chs=350x150&chl=Krause|Langhirt|Sterff|Pehlke|Doering" />
The image URL for the Chart API is http://chart.apis.google.com/chart. In addition, there are query string parameters that affect the display of the chart:
cht: Chart type (p= pie chart,p3= pie chart 3D, etc.)chd: Chart data (t= text encoding; data values are separated by commas)chs: Chart size (width and height in pixels)chl: Chart labels (labels corresponding to the chart data values separated by pipes)
The generated chart image looks like Figure 14-24.
Note
The Google Chart API officially does not support HTTPS/SSL. To overcome this there are two possible workarounds. The first is to simply use the SSL URL https://www.google.com/chart instead of http://chart.apis.google.com/chart. Although this is not recommended by Google it currently seems to work. A better solution is to retrieve charts as binary HTTP data directly from the server. Therefore, you can, for example, use an ASP.NET web handler file (.ashx) that accepts the binary data from the Google URL and returns it to your own page running with SSL.
Google offers many chart types for different scenarios. For a good overview of the different types, visit http://code.google.com/intl/de/apis/chart/types.html. Beneath the standard charts, such as line, bar, and pie charts, there are also some extended types. They include Venn diagrams, scatter plots, radar charts, maps, Google-o-Meters, and QR (specialized bar code) charts. Table 14-5 contains some chart examples.
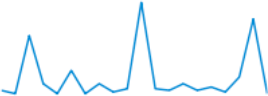


When generating and displaying Google Charts within SharePoint application pages or Web Parts, we strongly recommend you write classes to encapsulate the building of the complex query strings. The objective is to make displaying a chart as simple as instantiating an object, adding data, and calling a method. For example, if you wish to create a line chart, you should be able to write elementary code in this style:
GoogleChart gc = new GoogleChart(ChartTypeEnum.LineLC, 350, 200);
gc.ChartData.AddRange(new int[] {2,50,80,10,40});
gc.ChartLabels.AddRange(new String[] {"A","B","C","D","E" });
imgChart.ImageUrl = gc.BuildUrl();
This code creates an instance of a class called GoogleChart that takes the chart type and the output image size as parameters. After passing the data and the labels, call BuildUrl to assign the output to the ImageUrl property of an ASP.NET Image web control. The implementation of the GoogleChart class is shown in Listing 14-8.
Example 14.8. Helper Class for Using Google Charts
public enum ChartTypeEnum
{
    LineLC,
    LineLS,
    LineXY
}

public class GoogleChart
{
    public String ChartBaseUrl = "http://chart.apis.google.com/chart?";

    public ChartTypeEnum ChartType {get; set;}
    public List<int> ChartData { get; set; }
    public List<String> ChartLabels { get; set; }
    public int ChartWidth { get; set; }
    public int ChartHeight { get; set; }

    public GoogleChart(ChartTypeEnum chartType, int width, int height)
    {
        this.ChartType = chartType;
        this.ChartWidth = width;
        this.ChartHeight = height;
        this.ChartData = new List<int>();
this.ChartLabels = new List<string>();
}
public String BuildUrl()
{
StringBuilder sb = new StringBuilder();
sb.Append(ChartBaseUrl);
switch (ChartType)
{
case ChartTypeEnum.LineLC:
sb.Append("cht=lc");
break;
case ChartTypeEnum.LineLS:
sb.Append("cht=ls");
break;
case ChartTypeEnum.LineXY:
sb.Append("cht=lxy");
break;
}
// Build data string
sb.Append("&chd=t:");
for (int i = 0; i < ChartData.Count; i++)
{
if (i>0) sb.Append(",");
sb.Append(ChartData[i]);
}
// Build label string
sb.Append("&chl=");
for (int i = 0; i < ChartLabels.Count; i++)
{
if (i > 0) sb.Append("|");
sb.Append(HttpUtility.UrlEncode(ChartLabels[i]));
}
// Build chart size
sb.Append("&chs=" + ChartWidth + "x" + ChartHeight);
return sb.ToString();
}
}The code in Listing 14-8 defines a class whose BuildUrl method constructs a chart image URL such as the following:
The next big improvement we can make is to implement an ASP.NET web handler that sends chart requests to Google and returns the binary image data. Consequently, the user's browser never connects to Google—only to the SharePoint server. This technique has the advantage that it also works on secured HTTPS/SSL connections. An example for a web handler that requests data from Google is shown in Listing 14-9.
Example 14.9. GoogleChartHandler.ashx for Requesting Charts from Google
<%@ WebHandler Language="C#" Class="GoogleChartHandler" %>
using System;
using System.Web;
using System.Net;
using System.IO;
public class GoogleChartHandler : IHttpHandler
{
public bool IsReusable { get { return true;} }
public void ProcessRequest(HttpContext context)
{
context.Response.ContentType = "image/jpeg";
context.Response.BufferOutput = false;
// Get the Google image source
string googleImage = context.Request.QueryString["GrabUrl"];
if (googleImage == null) return;
HttpWebRequest request = (HttpWebRequest)WebRequest.Create(googleImage);
try
{
HttpWebResponse MyResponse = (HttpWebResponse)request.GetResponse();
if (HttpStatusCode.OK == MyResponse.StatusCode)
{
using (Stream MyResponseStream = MyResponse.GetResponseStream())
{
// 4K buffer
byte[] buffer = new byte[4096];
int bytesRead;
while (0 < (bytesRead =
MyResponseStream.Read(buffer, 0, buffer.Length)))
{
context.Response.OutputStream.Write(buffer, 0, bytesRead);
}
}
}
}
catch (Exception ex)
{
throw new Exception("Error: " + ex.Message, ex);
}
}
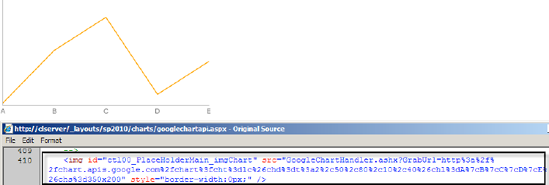
}GoogleChartHandler.ashx expects a GrabUrl query string containing the URL of the Google Chart API to grab. The following line shows how to use it:
imgChart.ImageUrl = "GoogleChartHandler.ashx?GrabUrl=" +
                                              HttpUtility.UrlEncode(gc.BuildUrl());
As a result the image is displayed as if it were received directly from the server. The user is unaware of the source of the image (see Figure 14-25).
Warning
Be aware that all chart data is sent to Google. Even if you use an ASP.NET web handler, the data is sent over the Internet, and because the query string contains the data, it may be readable within log files of switches, routers, proxies, and such. Don't use the Google Chart API for business-critical data!
In 2008 Google released the first version of its Visualization API (see http://code.google.com/intl/de/apis/visualization/, and also the examples in Figure 14-26) The API offers a broad range of very useful functions for visualizing data on web pages. From a technical perspective, the API is provided as a JavaScript library that developers use to display charts and graphs in their own custom web pages.
When building SharePoint applications and Web Parts, developers and power users often need to present data visually. You can simply use the freely offered Google Visualization API, even for use within your intranet or extranet environments.
The big advantage of the Visualization API over the Google Chart API is that the images are rendered within the client, and thus no sensitive data is sent over the network to Google. This makes it viable to use in business-critical scenarios.
The integration of the Google Visualization API is very simple (see Listing 14-10). The following example demonstrates the use of the API within a SharePoint application page.
Example 14.10. Displaying a Chart by Using the Google Visualization API on an Application Page
<%@ Page Language="C#" AutoEventWireup="true"
         DynamicMasterPageFile="˜masterurl/default.master"
         CodeFile="GoogleVisualizationAPI.aspx.cs"
         Inherits="Charts_GoogleVisualizationAPI"
         CodeFileBaseClass="Microsoft.SharePoint.WebControls.LayoutsPageBase" %>

<asp:Content ContentPlaceHolderID="PlaceHolderMain" runat="server">

    <!-- Load the Google AJAX API -->
    <script type="text/javascript" src="http://www.google.com/jsapi"></script>
    <script type="text/javascript">

    // Load the Visualization API and required chart package(s)
    google.load('visualization', '1', {
        'packages': ['piechart']
      });

    // Set a callback to run after loading
    google.setOnLoadCallback(drawChart);

    function drawChart() {

        // Create a visualization data table
        var data = new google.visualization.DataTable();
        data.addColumn('string', 'Author'),
        data.addColumn('number', 'Books'),
        data.addRows([
        ['Krause', 35],
        ['Langhirt', 24],
        ['Sterff', 10],
        ['Pehlke', 3],
        ['Doering', 1]
      ]);

        // Draw the chart
        var chart = new
            google.visualization.PieChart(document.getElementById('myChart'));
        chart.draw(data, { width: 400, height: 240, is3D: true,
            title: 'Book authors and their books' });
    }

     </script>

     <div id="myChart"></div>

</asp:Content>
The result of Listing 14-10 is shown in Figure 14-27. The example displays a pie chart that contains one value per book author. If you move the mouse pointer over the chart, a balloon tooltip will appear.
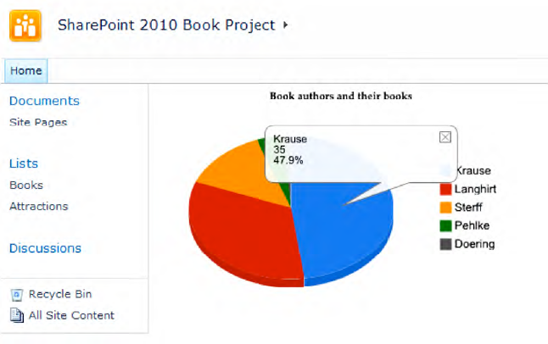
Figure 14.27. Example pie chart from the Google Visualization API embedded in a SharePoint application page
To begin, you have to load the Google AJAX API by referencing the library in your page:
You then load the core visualization libraries and the extra required visualization packages:
After loading, you can define a callback that executes a function after all the requested libraries are loaded:
After loading the Google JavaScript libraries, the callback executes the function that is responsible for drawing the chart. A Google chart usually requires a data table for rendering that has to be passed to the draw function of the relevant chart instance.
function drawChart() {

    // Create a visualization data table
    var data = new google.visualization.DataTable();
    data.addColumn('string', 'Author'),
    data.addColumn('number', 'Books'),
    data.addRows([['Krause', 35],['Langhirt', 24],['Sterff', 10],
                  ['Pehlke', 3],['Doering', 1]]);

    // Draw the chart
    var chart = new google.visualization.PieChart(
                                document.getElementById('myChart'));
    chart.draw(data, { width: 400, height: 240, is3D: true,
                       title: 'Book authors and their books' });
}
As you can see, using the Google Visualization API is very straightforward. Also, if you have an environment that runs secured under HTTPS/SSL, the Google Visualization API can be switched to use HTTPS instead of HTTP:
When requesting the core AJAX library with the HTTPS protocol, all additional libraries that are dynamically loaded by the API are also requested from secured URLs. This means that your users are not burdened by browser error messages because of mixed secured and unsecured content.
Tip
The Google AJAX API is also available for use on secure HTTPS/SSL pages. Just use the HTTPS protocol instead of HTTP: <script type="text/javascript" src="https://www.google.com/jsapi"></script>.
But despite all this simplicity, there is currently (in version 1.0 of the API) some strange behavior when using Internet Explorer 8. If you move your mouse over the pie segments in the chart, Internet Explorer 8 throws several "Object not found" JavaScript errors. This behavior only occurs if the browser is in Internet Explorer 8 Compatibility View, which is usually the default value for intranet pages. If you manually change the browser mode to Internet Explorer 8, it works perfectly. To overcome this issue, you need to change a <meta> tag in the <head> section of your master page. Change the value from IE=8 to IE=EmulateIE7, as follows:
Note
There seems to be a bug in version 1.0 of the API when using Internet Explorer 8 involving showing tooltips at mouseover. To overcome this issue, you have to change a META tag in the master page to render the page with IE 7 compatibility: <meta http-equiv="X-UA-Compatible" content="IE=EmulateIE7" />.
Google offers a Visualization API Gallery (see http://code.google.com/intl/de/apis/visualization/documentation/gallery.html) containing several examples with different chart types. In contrast to the Google Chart API, the Visualizatin API charts are interactive. This means that the charts include hover effects if you move the mouse over the chart. These visual effects can be used in conjunction with an event handling model to interact with the charts. For example, in a bar chart you can catch the click event and show additional information when the user clicks a bar. A selection of the most common chart types is shown in Table 14-6.
Table 14.6. Google Visualization API Chart Types
Chart Type | Example |
|---|---|
Area chart | 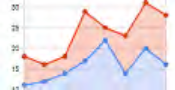 |
Bar chart |  |
Column chart | 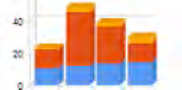 |
Line chart | 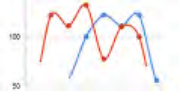 |
Pie chart | 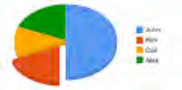 |
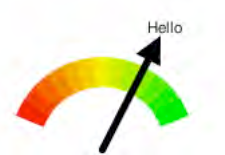
Gauge | 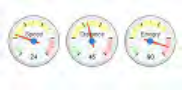 |
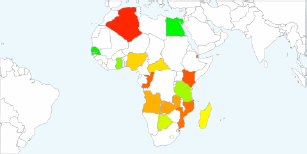
Geo map |  |
Intensity map |  |
Organizational chart | 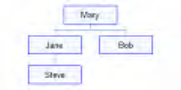 |
Scatter chart | 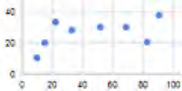 |
Beyond the chart types displayed in Table 14-6, there are many more available from the Visualization API Gallery page.
When using the Google Visualization API within SharePoint, it makes sense to use it in conjunction with the JavaScript client object model. Because all data has to be provided within JavaScript in the form of a google.visualization.DataTable instance, the best way to fill the chart with data is by retrieving data using JavaScript.
As mentioned earlier, the rendering of the charts is done on the client side within the user's browser. This enables you to use the Google Visualization API also for displaying business-critical data because the data is not sent over the Internet to Google.
Warning
Although most chart types are rendered on the client by generating SVG images using JavaScript, there are a couple of old chart types that use the Chart API. Those charts are still sending the data over the Internet to the Google Chart API. Don't use these insecure chart for business-critical data.
Interactive maps are becoming increasingly widespread in modern applications. Maps are used to visualize a broad range of data with a geographical background—for example, to display revenues for different locations.
Although many web applications could make good use of integrated mapping software, development teams often shy away from the complexity of integrating a full-fledged geographical database system. Two technologies—Bing Maps from Microsoft and Google Maps—in conjunction with Ajax and the SharePoint client object model, can significantly simplify this area. This chapter explains how you can easily implement dynamic interactive maps in SharePoint applications, using the Bing Maps API and the Google Maps API for the web interface, and the SharePoint client object model to provide real-time interaction with the server.
Bing Maps from Microsoft belongs to Bing Services, which provides programmatic access to Bing data via APIs. The services include the common Bing API and Bing Maps. The Bing API provides developers easy access to Bing content types such as Images, InstantAnswer, MobileWeb, News, Phonebook, RelatedSearch, Spell, Translation, Video and Web. Technically, the Bing API provides an XML web service through SOAP that enables you to submit queries to and receive results from the Bing search engine.
Bing Maps is an online mapping service that enables users to search, discover, explore, plan, and share information about specific locations. By using traditional road maps, labeled aerial photo views, low-angle high-resolution aerial photos, and proximity-searching capabilities, Bing Maps provides opportunities for developers to incorporate both location and local search features into their applications.
The Bing Maps SDK (available online at www.microsoft.com/maps/isdk/ajax) offers hands-on, task-based demonstrations of the features available in the latest version of the map control, including code samples and links back to the reference SDK.
This section demonstrates how to integrate Bing Maps into your own SharePoint application pages and Web Parts. Examples that show how to bind data from SharePoint lists to a map control will demonstrate ways to impress your users and customers.
As a developer you will nowadays often be faced with the requirement to implement custom application pages that contain map views based on data that resides in SharePoint lists. Both the server-side API from Bing Maps and the SharePoint client object model make it easy to implement custom map views.
To begin, you need to add a reference to the globally hosted JavaScript file for Bing Maps:
<script charset="UTF-8" type="text/javascript"
        src="http://ecn.dev.virtualearth.net/mapcontrol/
             mapcontrol.ashx?v=6.2&mkt=en-us" />
Microsoft delivers Bing Maps through the Microsoft Content Delivery Network (CDN), which is a key pillar of Microsoft's cloud computing strategy. CDN is comprised of multiple worldwide datacenters that allow Microsoft to host Bing Maps content closer to end users. This ensures maximum performance when working with Bing Maps. As a developer, you do not have to worry about performance issues due to content delivery—the cloud ensures the best possible performance.
After adding the JavaScript reference to Bing Maps, you can start adding your own map. Define an HTML control (such as a <div>) in your application page to contain the map:
Next, add JavaScript code to load the map into the defined <div> section:
function GetMap()
{
    var map = new VEMap('myMap'),
    map.LoadMap();
}
To make this code work you have to ensure that it will be executed when the page is loaded. Therefore, you can either add a JavaScript onLoad event to the <body> tag or use the Sys.Application.add_init function from the Microsoft AJAX implementation:
The function passed to this method is executed after all scripts on a page have been loaded. Another approach is to use the SharePoint JavaScript function ExecuteOrDelayUntilScriptLoaded. With this function you can ensure that required SharePoint JavaScript libraries, such as the sp.js library containing the client object model implementation, are loaded before accessing your map.
The complete code of the ASPX application page is displayed in Listing 14-11.
Example 14.11. Integrating Bing Maps Within a SharePoint Application Page
<%@ Page Language="C#" AutoEventWireup="true"
DynamicMasterPageFile="˜masterurl/default.master"
CodeFile="BingMap01.aspx.cs"
Inherits="Maps_BingMap01"
CodeFileBaseClass="Microsoft.SharePoint.WebControls.LayoutsPageBase"
%>
<asp:Content ContentPlaceHolderID="PlaceHolderMain" runat="server">
<script charset="UTF-8" type="text/javascript"
src="http://ecn.dev.virtualearth.net/mapcontrol/
mapcontrol.ashx?v=6.2&mkt=en-us" />
<script type="text/javascript">
function GetMap() {
var map = new VEMap('myMap'),
map.LoadMap();
}
</script>
<div id='myMap' style="position: relative; width: 600px; height: 600px;"></div>
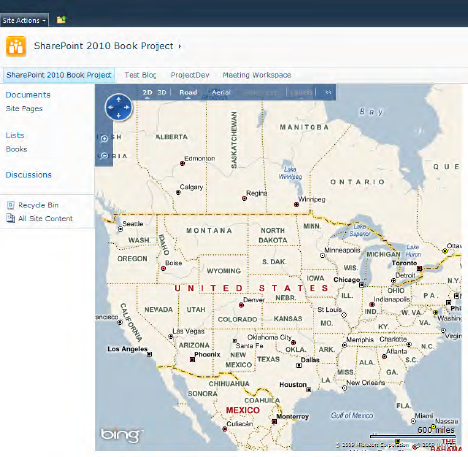
</asp:Content>As you can see, the code for integrating Bing Maps is very simple. The example uses the PlaceHolderMain section of the system master page (default.master) to display the map with a height and width of 600 pixels. The rendered application page is shown in Figure 14-28.
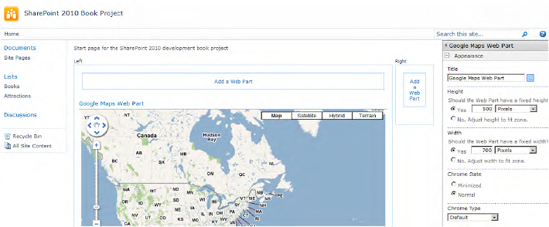
If you wish to integrate the maps functionality into a Web Part, follow these steps:
Include a JavaScript reference to Bing Maps (
RegisterClientScriptInclude).Register custom JavaScript code (
RegisterClientScriptBlock).Ensure your code will be started after page load (
RegisterStartupScript).
An example of implementing a Web Part that contains a Bing map is shown in Listing 14-12.
Example 14.12. Implementation of a Bing Maps Web Part
public class BingMapsWebPart : WebPart
{
    private const String mapsLibrary =
      "http://ecn.dev.virtualearth.net/mapcontrol/mapcontrol.ashx?v=6.2&mkt=en-us";

    public BingMapsWebPart () { }

    protected override void OnLoad(EventArgs e)
    {
// Add script reference
this.Page.ClientScript.RegisterClientScriptInclude(this.GetType(),
"BingMaps", mapsLibrary);
// Add loadMap() function
StringBuilder js = new StringBuilder();
js.Append("var map = null; ");
js.Append("function loadMap() { ");
js.Append("map = new VEMap('myMap'), ");
js.Append("map.LoadMap(); ");
js.Append(" }");
this.Page.ClientScript.RegisterClientScriptBlock(this.GetType(), "JS",
js.ToString(), true);
// Add ExecuteOrDelayUntilScriptLoaded function
this.Page.ClientScript.RegisterStartupScript(this.GetType(), "initMap",
"ExecuteOrDelayUntilScriptLoaded(loadMap, 'sp.js'),", true);
}
protected override void RenderContents(HtmlTextWriter writer)
{
// Render maps DIV tag
String width = Convert.ToInt32(this.Width.Value) + "px";
String height = Convert.ToInt32(this.Height.Value) + "px";
String div = String.Format("<div id='myMap' style='position: relative; "
+ "width:{0}; height:{1};'></div>", width, height);
writer.Write(div);
}
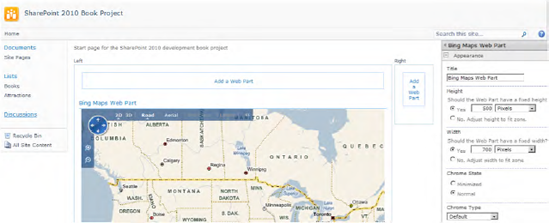
}In Listing 14-12 the Web Part OnLoad method is used to initialize the required Bing Maps JavaScript code. At first the Bing Maps JavaScript library is referenced by using the ClientScript.RegisterClientScriptInclude method. Then the client function loadMap is registered with ClientScript.RegisterClientScriptBlock. The rendered HTML result in the page containing the Web Part looks like this:
<script src="http://ecn.dev.virtualearth.net/mapcontrol/
mapcontrol.ashx?v=6.2&mkt=en-us" type="text/javascript">
</script>
<script type="text/javascript">
//<![CDATA[
var map = null; function loadMap() { map = new VEMap('myMap'), map.LoadMap(); }//]]>
</script>The final required step is to ensure that the loadMap function is called after all the necessary SharePoint JavaScript libraries are loaded. Therefore, the method ClientScript.RegisterStartupScript is used to call the ExecuteOrDelayUntilScriptLoaded function. The rendered HTML result is placed at the end of the Web Part page together with other function calls that need to be executed during the page load:
<script type="text/javascript">
// <
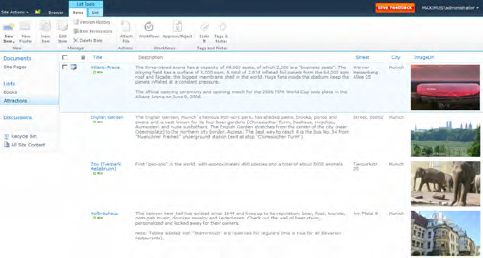
An extension of the example in the previous section could be to read the location data from a SharePoint list. In this situation, you can use the JavaScript client object model to query SharePoint lists and populate the map with this data. First of all, you need to prepare a list containing the location information. The example in this section creates a list containing several tourist attractions—each with a title, description, street, city, and image link (see Figure 14-30).
The JavaScript code to display the items of the Attractions SharePoint list as pushpins in a Bing map is shown in Listing 14-13. After loading the page, the loadMap function is called. This function uses the client object model to access the Attractions list and retrieves all the list items with a CAML query into the ListItemCollection this.allAttractions. After the successful asynchronous execution of the query, the callback function onLoadMapCallback is run. Here, the enumeration this.allAttractions is processed, and for every list item a new pushpin will be created (setPushpin). The setPushpin function is based on the VEMap.Find function, which resolves location names (e.g., Tierparkstr. 30, Munich) into map coordinates. The implemented anonymous callback function of the VEMap.Find function creates a new VEShape instance, populates this instance with data, and finally adds the shape to the map.
Example 14.13. Integrating Bing Maps with the JavaScript Client Object Model
<%@ Page Language="C#" AutoEventWireup="true"
        DynamicMasterPageFile="˜masterurl/default.master"
        CodeFile="BingMaps02.aspx.cs" Inherits="Maps_BingMaps02"
        CodeFileBaseClass="Microsoft.SharePoint.WebControls.LayoutsPageBase" %>

<asp:Content ContentPlaceHolderID="PlaceHolderMain" runat="server">
    <script charset="UTF-8" type="text/javascript"
        src="http://ecn.dev.virtualearth.net/mapcontrol/mapcontrol.ashx?v=6.2&mkt=en-us" />

    <script type="text/javascript">
        var map = null;
        var allPoints = new Array();

        function loadMap() {
            var ctx = new SP.ClientContext.get_current();
            var oAttractionsList =
                ctx.get_web().get_lists().getByTitle("Attractions");
            var camlQuery = new SP.CamlQuery();
            this.allAttractions = oAttractionsList.getItems(camlQuery);
            ctx.load(this.allAttractions);
             ctx.executeQueryAsync(
                Function.createDelegate(this, this.onLoadMapCallback),
                Function.createDelegate(this, this.onFailedCallback));
        }

        // Callback function to load the map
        function onLoadMapCallback(sender, args) {
            map = new VEMap('myMap'),
            map.LoadMap();
            map.SetMapStyle(VEMapStyle.Road);

            var enumerator = this.allAttractions.getEnumerator();
            while (enumerator.moveNext()) {
                var li = enumerator.get_current();
                var location = li.get_item("Street") + ", " + li.get_item("City");
                var title = li.get_item("Title");
                var imageUrl = li.get_item("ImageUrl").get_url();
var description = li.get_item("Description");setPushpin(map, location, title, description, imageUrl);}}// Callback function for errors function onFailedCallback(sender, args) { SP.UI.Notify.addNotification('Request failed: ' + args.get_message() + ' ' + args.get_stackTrace(),false); }function setPushpin(map, location, title, desc, imageUrl) {var result = map.Find(null, location, null, null, 0, 10,true, true, true, false,function (layer, resultsArray, places,hasMore, veErrorMessage) {if (places.length > 0) {var shape = new VEShape(VEShapeType.Pushpin,places[0].LatLong);shape.SetCustomIcon('http://clserver/_layouts/images/search32x32.png'),shape.SetTitle(title);shape.SetDescription(desc + ' <br><br><img src="'+ imageUrl + '"/>'),map.AddShape(shape);allPoints.push(places[0].LatLong);map.SetMapView(allPoints)}});}ExecuteOrDelayUntilScriptLoaded(loadMap, 'sp.js') </script> <div id='myMap' style="position: relative; width: 900px; height: 600px;"></div> </asp:Content>
After page loading, the JavaScript function loadMap is called via the ExecuteOrDelayUntilScriptLoaded function. This function call is necessary because the client object model can only be used after the core SharePoint JavaScript library sp.js and its dependencies are loaded.
Warning
When using the client object model for querying data from SharePoint, you have to ensure that all required JavaScript libraries are loaded first. You can only use the client object model if the core library sp.js is loaded, including all its dependencies. To do this, you can use the JavaScript function ExecuteOrDelayUntilScriptLoaded, which calls a defined function only after the client object model libraries are completely loaded.
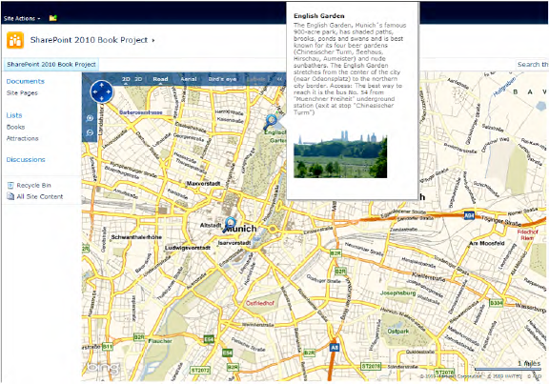
Finally, after querying data via the client object model, the Bing map will contain all the tourist attractions defined in the Attractions SharePoint list. Every list item is marked with a magnifying glass (image URL: /_layouts/images/search32x32.png), and when the mouse pointer is moved over an icon, the information pop-up for the list item is displayed. This information pop-up contains the Title, Description, and ImageURL properties of the list item. Figure 14-31 shows the resulting map for Listing 14-13.
Google Maps is a Google service offering powerful, user-friendly mapping technology and local business information. The Google Maps API lets you embed Google maps in your own web application pages with JavaScript. The API provides a number of utilities for manipulating maps and adding content to them through a variety of services, allowing you to create your own custom map applications. A good starting point for working with Google Maps is the API documentation: http://code.google.com/intl/en/apis/maps.
Using Google Maps within custom application pages is very similar to using Bing Maps, as described previously. The first step is to add a reference to the centrally hosted JavaScript file for Google Maps. In older versions of Google Maps, a free Google API key had to be requested and added as a request parameter to the JavaScript library URL. Since version 3 of the Google Maps API, an API key is no longer required. Hence, you can reference the maps library with the following script tag:
<script type="text/javascript"
        src="http://maps.google.com/maps/api/js?sensor=false" />
Note
Since version 3 of the Google Maps JavaScript API, you no longer need an API key.
As already shown for Bing Maps, Google Maps also needs an HTML element in which to display its map:
PointProperty=Field[{Format}] [,PointProperty=Field[{Format}]]
http://chart.apis.google.com/chart?cht=lc&chd=t:2,50,80,10,40&chl=A|B|C|D|E&chs=350x200
<script type="text/javascript" src="http://www.google.com/jsapi"></script>
google.load('visualization', '1', {'packages': ['piechart']});
google.setOnLoadCallback(drawChart);
<script type="text/javascript" src="https://www.google.com/jsapi"></script>
<meta http-equiv="X-UA-Compatible" content="IE=EmulateIE7" />
<div id='myMap' style="position: relative; width: 600px; height: 600px;" />
Sys.Application.add_init(GetMap);
ExecuteOrDelayUntilScriptLoaded(GetMap, 'sp.js'),
         ExecuteOrDelayUntilScriptLoaded(GetMap, 'sp.js'),
<div id='myMap' style="position: relative; width: 600px; height: 600px;" />
ExecuteOrDelayUntilScriptLoaded(GetMap, 'sp.js'),
To load and display the map, you have to add initialization JavaScript code that loads the map into the <div> element:
function GetMap() {
    var myLatlng = new google.maps.LatLng(39,-77);
    var myOptions = {
        zoom: 3,
        center: myLatlng,
        mapTypeId: google.maps.MapTypeId.ROADMAP
    };
    var mapDiv = document.getElementById("myMap");
    var map = new google.maps.Map(mapDiv, myOptions);
}
In contrast to Bing Maps, Google Maps needs a center location for its map. This example sets the variable myLatlng to the coordinates of North America. With the myOptions property containing information about the zoom level and the map type, a new instance of the google.maps.Map class is created and displayed in the myMap <div> element.
The GetMap function has to be called after page initialization. This can be done by adding the following line:
The complete code for the ASPX application page is displayed in Listing 14-14.
Example 14.14. Integrating Google Maps in a SharePoint Application Page
<%@ Page Language="C#" AutoEventWireup="true"
DynamicMasterPageFile="˜masterurl/default.master"
CodeFile="GoogleMaps01.aspx.cs" Inherits="Maps_GoogleMaps01"
CodeFileBaseClass="Microsoft.SharePoint.WebControls.LayoutsPageBase" %>
<asp:Content ID="Content1" ContentPlaceHolderID="PlaceHolderMain" runat="server">
<script type="text/javascript"
src="http://maps.google.com/maps/api/js?sensor=false" >
</script>
<script type="text/javascript">
function getMap() {
var myLatlng = new google.maps.LatLng(39,-77);
var myOptions = {
zoom: 3,
center: myLatlng,
mapTypeId: google.maps.MapTypeId.ROADMAP
};
var mapDiv = document.getElementById("myMap");
var map = new google.maps.Map(mapDiv, myOptions);
}
ExecuteOrDelayUntilScriptLoaded(getMap, 'sp.js'),
</script>
<div id='myMap' style="width: 600px; height: 600px;">huhu</div>
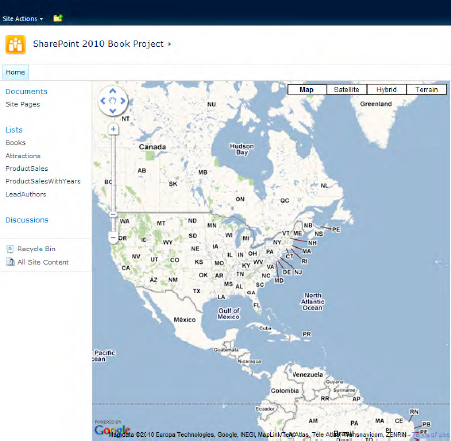
</asp:Content>Compared to the Bing Maps integration, using Google Maps (see Figure 14-32) is also very simple. To begin, you reference the Google Maps JavaScript library and then call the function ExecuteOrDelayUntilScriptLoaded, which itself calls the getMap function to display the map.
Warning
Some very strange behavior occurs when referencing the Bing and Google Maps JavaScript libraries. You must ensure that the script reference tag is always terminated with an end tag (</script>). A normal end-of-the-script reference within the <script> element does not work. The following example is wrong and leads to JavaScript errors:
<script type="text/javascript" src="http://maps.google..." />
However, this example will work without problems:
<script type="text/javascript" src="http://maps.google..." ></script>
This issue occurs with both Internet Explorer and Firefox, neither of which can deal with the shorthand syntax for the script element.
The Web Part integration for Google Maps works very similarly to Bing Maps, as shown in Listing 14-15. The only two differences are the JavaScript reference to Google Maps instead of Bing Maps and the different loadMap implementation. In the Google Maps Web Part example in Listing 14-15, the differences are shown in bold.
Example 14.15. Integrating Google Maps with JavaScript Client Object Model
public class GoogleMapsWebPart : WebPart
{
    private const String mapsLibrary =
        " http://maps.google.com/maps/api/js?sensor=false";

    public GoolgeMapsWebPart () { }

    protected override void OnLoad(EventArgs e)
    {
        // Add script reference
        this.Page.ClientScript.RegisterClientScriptInclude(this.GetType(),
                "GoogleMaps", mapsLibrary);

        // Add loadMap() function
        StringBuilder js = new StringBuilder();
        js.Append("var map = null; ");
        js.Append("function loadMap() { ");
        js.Append("var myLatlng = new google.maps.LatLng(39,-77);");
        js.Append("var myOptions = { ");
        js.Append("    zoom: 3,");
        js.Append("    center: myLatlng,");
        js.Append("    mapTypeId: google.maps.MapTypeId.ROADMAP ");
        js.Append("};");
        js.Append("var mapDiv = document.getElementById('myMap'),");
        js.Append("map = new google.maps.Map(mapDiv, myOptions);");
        js.Append(" }");
        this.Page.ClientScript.RegisterClientScriptBlock(this.GetType(), "JS",
                                                         js.ToString(), true);

        // Add ExecuteOrDelayUntilScriptLoaded function
        this.Page.ClientScript.RegisterStartupScript(this.GetType(), "initMap",
            "ExecuteOrDelayUntilScriptLoaded(loadMap, 'sp.js'),", true);
    }

    protected override void RenderContents(HtmlTextWriter writer)
    {
        // Render maps <div> tag
        String width = Convert.ToInt32(this.Width.Value) + "px";
        String height = Convert.ToInt32(this.Height.Value) + "px";
        String div = String.Format("<div id='myMap' style='position: relative; "
            + "width:{0}; height:{1};'></div>", width, height);
writer.Write(div);
}
}As you can see in Listing 14-15, the integration of Google Maps is very simple. After registering the Google Maps JavaScript library, you have to ensure that the client script for displaying the map (followed by the initial starting script) is run after loading the page by using the ExecuteOrDelayUntilScriptLoaded function. The resulting Web Part looks like Figure 14-33.
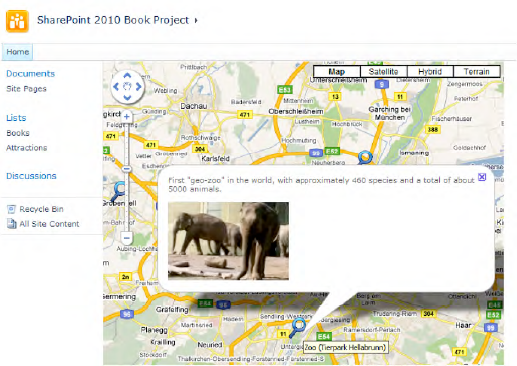
Based on the example for Bing Maps introduced previously this section shows an example for using Google Maps in conjunction with the client object model. The example again uses the Attractions SharePoint list containing several tourist attractions, each with a title, description, street, city, and image link (see Figure 14-34). Every list item is displayed as a marker on the Google map. If you move the mouse over such a marker, a window containing HTML with the description and the image of the attraction comes up (see Figure 14-34).
The example code for the SharePoint application page is displayed in Listing 14-16.
Example 14.16. Implementation of a Google Maps Web Part
<%@ Page Language="C#" AutoEventWireup="true"
    DynamicMasterPageFile="˜masterurl/default.master"
    CodeFile="GoogleMaps02.aspx.cs"
    Inherits="Maps_GoogleMaps02"
    CodeFileBaseClass="Microsoft.SharePoint.WebControls.LayoutsPageBase" %>

 <asp:Content ID="Content1" ContentPlaceHolderID="PlaceHolderMain" runat="server">
    <script type="text/javascript"
            src="http://maps.google.com/maps/api/js?sensor=false"></script>

    <script type="text/javascript">

    var map = null;

    function loadMap() {

        var ctx = new SP.ClientContext.get_current();
        var oAttractionsList = ctx.get_web().get_lists().getByTitle("Attractions");

        var camlQuery = new SP.CamlQuery();
        this.allAttractions = oAttractionsList.getItems(camlQuery);
        ctx.load(this.allAttractions);

        ctx.executeQueryAsync(
Function.createDelegate(this, this.onLoadMapCallback),
Function.createDelegate(this, this.onFailedCallback));
}
// Callback function to load the map
function onLoadMapCallback(sender, args) {
var myLatlng = new google.maps.LatLng(39, −77);
var myOptions = {
zoom: 3,
center: myLatlng,
mapTypeId: google.maps.MapTypeId.ROADMAP
};
var mapDiv = document.getElementById("myMap");
var map = new google.maps.Map(mapDiv, myOptions);
var enumerator = this.allAttractions.getEnumerator();
while (enumerator.moveNext()) {
var li = enumerator.get_current();
var location = li.get_item("Street") + ", " + li.get_item("City");
var title = li.get_item("Title");
var imageUrl = li.get_item("ImageUrl").get_url();
var description = li.get_item("Description");
setMarker(map, location, title, description, imageUrl);
}
}
// Callback function for errors
function onFailedCallback(sender, args) {
SP.UI.Notify.addNotification('Request failed: ' + args.get_message() + '
'
+ args.get_stackTrace(), false);
}
function setMarker(map, location, title, description, imageUrl) {
var geocoder = new google.maps.Geocoder();
var result = geocoder.geocode({ 'address': location },
function (results, status) {
if (status == google.maps.GeocoderStatus.OK) {
map.setCenter(results[0].geometry.location);
// Add marker to map
var marker = new google.maps.Marker({
map: map,
position: results[0].geometry.location,
icon: "http://clserver/_layouts/images/search32x32.png",
title: title
});
var infoWindow = null;// Show info window on mouseover event on markergoogle.maps.event.addListener(marker, 'mouseover', function () {var html = description + ' <br><br><img src="' + imageUrl + '"/>';infoWindow = new google.maps.InfoWindow({content: html,position: results[0].geometry.location});infoWindow.open(map);});// Hide info window on mouseout event on markergoogle.maps.event.addListener(marker, 'mouseout', function () {if (infoWindow) infoWindow.close();});}});}ExecuteOrDelayUntilScriptLoaded(loadMap, 'sp.js'), </script> <div id='myMap' style="width: 600px; height: 600px;"> Loading Google Maps...</div> <a href="javascript:loadMap()">loadMap()</a> <a href="javascript:initAttractions()">initAttractions()</a> </asp:Content>
After page loading, the JavaScript function loadMap is called via the ExecuteOrDelayUntilScriptLoaded function. With the client object model and a CAML query, the list items of the Attractions list are received. Within the callback function onLoadMapCallback, the Google map is initialized. The results of the CAML query are processed within a loop, and for every list item, a marker (google.maps.Marker) is added to the map. The marker is displayed with a magnifying class icon. In addition, the markers get the events mouseover and mouseout attached; these show and hide a google.maps.InfoWindow containing the image and the description of an attraction item as HTML.
Both Bing Maps and Google Maps provide very powerful and robust APIs for quickly realizing integration scenarios in custom web applications and SharePoint application pages and Web Parts. This section will outline some of the pros and cons of both services, and the scenarios in which you might use one instead of the other.
A very important criterion for using either Bing Maps or Google Maps is the protocol of your SharePoint site that hosts the map. If your site is running secured by SSL (https://server), you should ensure that all references in your page (e.g., images, styles, and scripts) are also coming from secured sources. If not, your browser will give users annoying warnings about secure/insecure content on every page reload. Unfortunately, Google Maps does not support SSL in its free API. To access the Google Maps API over a secure (HTTPS) connection, you have to sign up for a Google Maps API Premier account, which is not free. The free Bing Maps API, however, can be accessed by SSL. With Bing Maps, you simply need to change the JavaScript reference from HTTP to HTTPS and add the parameter s=1 to the query string. The normal, unsecured HTTP reference looks like the following:
<script charset="UTF-8" type="text/javascript"
        src="http://ecn.dev.virtualearth.net/mapcontrol/
             mapcontrol.ashx?v=6.2&mkt=en-us" />
To use HTTPS, on the other hand, you have to change the src attribute of the script tag, as follows:
<script charset="UTF-8" type="text/javascript"
        src="https://ecn.dev.virtualearth.net/mapcontrol/
             mapcontrol.ashx?v=6.2&mkt=en-us&s=1" />
Tip
If your SharePoint site uses maps and will run secured over SSL (HTTPS), you should be aware of the fact that Google Maps currently only supports SSL/HTTPS at additional charge. Bing Maps offers free support for SSL/HTTPS.
When using map services, either from Google or Bing, you have to take care of licensing conditions. First of all, the use of map services isn't always as "free" as you might think. Licensing can be a very tricky issue, and the terms for each API are written in pure legalese, so they can be quite difficult for a layperson to understand. Both map services make a distinction between two usage scenarios: free usage and commercial licensing.
The free usage license is offered for use on public-facing web sites. That means you can use map services on web sites that are publicly available on the Internet and that do not charge for access to the maps. There are also limits on how many map loads you can use; Bing maps limits the free usage at 125,000 map page loads per year, whereas Google keeps the limit at its discretion. Also, the terms can change at any time without warning, and uptime is not guaranteed, so you could encounter problems with your maps going offline. It's possible, too, that usage in the future might cease to be free.
If you plan to include map services in your custom business applications, you should consider a commercial license. The commercial license terms contain an uptime service-level agreement (SLA), and remove any unwanted advertisements from your maps. Furthermore, you can use an unlimited number of map loads and features that are not available under the free license.
The price for a commercial license depends upon the traffic, and begins at a few thousand dollars per year. For detailed information, take a look at the licensing conditions and offerings of the map providers.
This chapter described many graphical visualization UI elements available for extending the functionality of SharePoint. The first part contained an introduction to various data access scenarios, with particular emphasis on strategies for dealing with large lists. Different data access methods, including LINQ to SharePoint and direct SQL access with LINQ to SQL, were explained in depth.
The integration of attractive charts into custom application pages and Web Parts is a common requirement. The chapter described how to use the Microsoft Chart Control, including various data binding examples for SharePoint. Other interesting alternatives—the Google Charts API and the Google Visualization API—were also covered.
In addition to charts, maps are another increasingly important element of modern business applications. Both Bing Maps and Google Maps were explained, including many practical examples on how to embed maps into SharePoint.