
CHAPTER 7
Maximizing the Use of Your Data: Being Value Driven
“Ah, but who do you think created the chaos?”
—Grady Booch
Object-Oriented Analysis and Design with Applications
For many years, a doctrine known as the single version of truth (SVOT) permeated how organizations approached the deployment of their data for analytic-based implementations. In 2004, Bill Inmon wrote the following:
There are many reasons why a single version of the truth is so appealing:
- There is a basis for reconciliation;
- There is always a starting point for new analyses;
- There is less redundant data; and
- There is integrity of data, etc.
The appeal of the single version of the truth is valid and strong. It is a worthy goal for organizations everywhere.
“The Single Version of the Truth” (www.b-eye-network.com/view/282)
While an SVOT did not mean that an organization must implement only a single data store, it did mean that multiple data stores should not contain the same, or overlapping, data. In recognizing the disparate needs of an organization, an SVOT does not always align with the way a business does business. This chapter delves into the drivers that require the support of multiple versions of data—even when the data may conflict with the ideals of an SVOT.
Managing multiple versions provides improved capabilities to support the needs of the organization and to provide the necessary contexts for solving business problems using AI, in both operational and analytical environments. The awareness of signals and triggered events are critical in ascertaining the correct set of features to use within an AI model, especially with the use of AI to support real-time situations.
Broader awareness creates an understanding of what type of data should be procured, maintained, and accessed so as to ultimately influence the creation of an information architecture and components that must also be addressed through the architecture.
Toward a Value Chain
Data and information are words that are typically used interchangeably within an organization. But when addressing an organization's data strategy, the terms data and information are distinct. The famed management consultant Peter Drucker once described information as “data endowed with relevance and purpose” (“The Coming of the New Organization,” Harvard Business Review, January 1988). Drucker further expressed that “converting data into information thus requires knowledge. And knowledge, by definition, is specialized.” The organizational theorist Russell Ackoff stated that the difference between data and information is “functional [and] not structural” (Ackoff's Best, John Wiley & Sons, 1999).
Figure 7-1 shows how data, information, and knowledge can form a progressive hierarchy of inferred utility. The progression through the hierarchy is an enrichment process captured by Ackoff's pyramid for data, information, knowledge, and wisdom (DIKW). Data is foundational. Having information is better than just having data. Likewise, knowledge is better than just having information, and wisdom is better than knowledge.
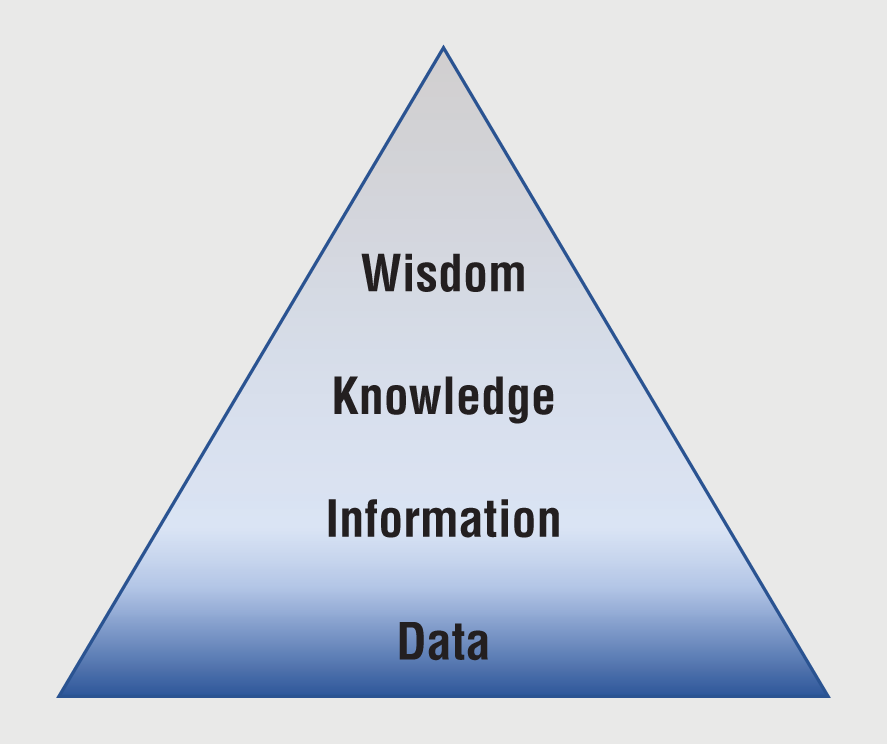
Figure 7-1: Data to wisdom
Prior to Drucker and Ackoff, poets and songwriters had surmised the existence and importance of the relationships between information, knowledge, and wisdom. In 1979, singer-songwriter Frank Zappa wrote in a song titled “Packard Goose”:
Information is not knowledge,
Knowledge is not wisdom,
Wisdom is not truth
The macabre, dour point of view that Zappa established was because the song was associated with a dystopian society. If the lyric had been written for a utopian society, Zappa might have inverted the sentiment. In 1934, the poet T. S. Eliot also wrote about the lost opportunities from failing to learn from experience:
Where is the wisdom we have lost in knowledge?
Where is the knowledge we have lost in information?
Collected Poems, 1909–1962. Harcourt Brace Jovanovich, 1991
The economist Milan Zeleny extended DIKW by adding enlightenment as the pinnacle, which he saw as being that of truth and insight (www.milanzeleny.com/Files/Content/Madeira%20Zeleny.pdf). But Zeleny's clarity was to associate a series of know tags to each layer in the hierarchy. Beyond any inherent definition, each tag phrase served to clearly denote distinguishable aspects between data, information, knowledge, and wisdom:
- Data ➪ Know nothing
- Information ➪ Know that
- Knowledge ➪ Know how
- Wisdom ➪ Know why
The progression reveals why building an information architecture is a goal, as opposed to a goal of building a wisdom architecture. How and why (in terms of the tags know how and know why) need to be innately contextual in order for the progression to work and yield value. Need and circumstance are required to help form a context, and establishing context can be infinite. Information, therefore, forms a plane of observation upon which context can be added.
Further, in 1739, under the pseudonym Poor Richard, Benjamin Franklin, one of the Founding Fathers of the United States, published a version of the proverb “For want of a nail” in Poor Richard's Almanack to demonstrate correlation:
For want of a nail the shoe was lost;
For want of a shoe the horse was lost;
For want of a horse the rider was lost;
For want of the rider the battle was lost;
For want of a battle, the kingdom was lost;
And all for the want of a horseshoe nail.
In the mid-1700s, Franklin used the proverb to warn the colonists not to become too complacent and neglectful about their British adversaries. This is akin to Eliot's question, “Where is the wisdom we have lost in knowledge?” While the proverb's series of correlations begins “For want of a nail,” can the want of a nail be regarded as the root cause for such an unsavory outcome—the loss of the kingdom?
Consider that:
For want of an apprentice, the blacksmith was lost;
For want of a blacksmith, the shop was lost;
For want of a shop, the hammer was lost;
For want of hammer, the nail was lost…
These correlations imply that the means to discover data is an essential aspect of the data scientist's role in building AI models. Feature selection and feature engineering require the ability to establish correlation and context to help drive an understanding. Ultimately, the understanding should be regarded as being holistic.
Referring to Chapter 2, “Framing Part I: Considerations for Organizations Using AI,” Rudyard Kipling's poem, The Elephant's Child, was discussed for his insight that a set of six English interrogatives formed the primitives that can help guide a person to form a holistic viewpoint:
I keep six honest serving-men: (They taught me all I knew)
Their names are What and Where and When and How and Why and Who.
Subsequently, the interrogatives provided the basis for Zachman to build his framework. The Zachman Framework, also mentioned in Chapter 2, is regarded as an ontology because the framework represents “a theory of the existence of a structured set of essential components of an object for which explicit expressions are necessary and perhaps even mandatory” in formulating and demonstrating a complete (holistic) understanding (www.zachman.com/16-zachman/the-zachman-framework/35-the-concise-definition).
Whether the object in Zachman's quote is a nail, a horse, a rider, a kingdom, or something else altogether, the essential components navigate forward or backward along a value chain of data. Suffice to say that a value chain of data is a correlation of facts that are offered within a given context.
To provide utility and guidance for moving forward or backward along a data value chain, the Zachman Framework provides an iterating metamodel for each of the six interrogatives. The metamodel can be used by data scientists to explore the data's narrative to the beginning of the value chain or to the end of the value chain.
The metamodel for each of the interrogatives is as follows:
- For the interrogative what: relationship-thing-relationship
- For the interrogative how: input-transform-output
- For the interrogative where: link-location-link
- For the interrogative who: role-work product-role
- For the interrogative when: event-cycle-event
- For the interrogative why: ends-means-ends
The iterative or recursive aspect of each metamodel implies an unending chain of inquiry that can be established, such that:
- What: relationship-thing-relationship-thing-relationship-thing…, and so on
- How: input-transform-output/input-transform-output/input…, and so on
- Where: link-location-link-location-link-location…, and so on
- Who: role-work product-role-work product…, and so on
- When: event-cycle-event-cycle-event-cycle…, and so on
- Why: ends-means-ends-means-ends-means…, and so on
In addition to the recursive property of the metamodel, it also contains fractal properties. Therefore, for every binary relationship that is associated with an object, the correlations can change orientation. The change in orientation is somewhat akin to a drill-up, drill-down, or drill-across capability that is associated with business intelligence analytics.
Drilling up can help to correlate or link a given object to a higher-level object or concept. Drilling down could help to correlate or explore the decomposition of an object into a smaller object that retains meaningfulness to a business (in this case, meaningfulness for a business is always defined by establishing a context). Lastly, drilling across would help to correlate an object to a peer object.
An example of drilling up from one object to another is a CPU that is used in a laptop computer. A drill-down example could be that the CPU contains a given number of cores. A drill-across might be that the laptop is associated with an externally connected storage device.
Regardless of the granularity associated with a given object, the metamodel retains its fractal nature. The metamodel pattern to explore an object always remains consistent. The recursive nature of the metamodel, both forwards and backwards, is likely to possess a finite number of endpoints because an organization only manages a quantifiable volume of data. However, through extrapolation and interpolation processes that can be performed on the quantifiable data points, an organization can investigate the means to explore infinite endpoints.
Chaining Through Correlation
To discover or explore possible correlations beyond those that may be self-evident or empirically derived, the metamodel provides the underpinning to guide exploration. For each digital asset, the “what” metamodel indicates that there is likely to be a preceding relationship to another digital asset (the “thing” in the metamodel). If a relationship to another digital asset does not exist or cannot be found, the digital asset represents the earliest discoverable value in the value chain and can potentially be a value associated with any root-cause analysis or diagnostic. Additionally, the relationships can contribute toward the data scientist's approach toward feature selection for a model.
Exploring the relationship forward, the digital asset is potentially itself a dependency on another digital asset (the recursive nature of the metamodel). If there are no other digital assets that are related, the value chain is potentially at its current endpoint.
If the information and knowledge being gained from exploring the relationships both forward and backward appear to tell an incomplete or disparate story, the data scientist might infer that other sources of data need to be considered for which the data can be further correlated.
The “how” metamodel correlates the known transformations and processes that are directly or indirectly associated with a digital asset. Often transformations and processes leave their own wake in terms of digital assets such as audit logs, operational metadata, and parametric data, etc.
“Where” is the foundation to form correlations associated with geometry. The use of the term geometry would incorporate digital or communication networks, data centers, and any type of location—whether stationary or mobile, real or virtual, terrestrial or extraterrestrial. “Who” correlates actors, whether a person or a machine, that are involved in the creation of a work product. “When” recognizes the existence of time between events. The aspect of time represents a given cycle. Finally, the “why” metamodel helps to understand motivation by correlating broad outcomes and causation: an ends and a means.
Each primitive metamodel is, therefore, the basis for examining each aspect of “For the want of a nail,” whereby the aggregate examination is holistic. However, each metamodel can be combined with one or more of the other metamodels to establish a composite metamodel that can be used to develop complex lines of inquiry and understanding. For example, combining “who” and “when” provides a correlation and an understanding of work products over time.
For a data scientist, the primitive metamodels provide a means to understand data through analysis, while composite metamodels provide for a means to understand data through synthesis. Synthesis is then the means to draw upon more than one viewpoint of understanding to form additional correlations and to establish or build context.
AI is part of the contextual progression that can be realized from an underlying information architecture. AI can be correlated to being part of the knowledge layer, where the knowledge comes from uncovering patterns from across the data for which AI models have been given visibility and access. Knowing why, a reference to wisdom in Zeleny's know-tag model, can in part require feedback for which an information architecture must be able to preserve if and when captured.
Information is the organization of data where data is enriched through the use of definitions, relationships, and provenance. As mentioned previously, data is inert—but so too is information. Neither data nor information is self-organizing nor self-aware. Making information operable requires a computer program or a model. AI can provide both and can also surmise inference based on a given context.
Enabling Action
Any action that is taken through the use of a machine or by a person reflects a level of observation from which the action was deemed appropriate and relevant. For example, if an AI model is calculating a score based on uncovering a pattern, a computer program can take the next appropriate step based on that score. The score and the next step are acts associated with knowledge.
AI is therefore providing additive value and transcends the value of information alone. Plain vanilla data, such as sales figures and customer retention rates, can be meaningless if solely analyzed as standalone figures. But once data is enriched by combining it with other data, the data can be transformed into something with higher value (e.g., information). AI is a vehicle (a means) to generate value (an ends).
Sales figures from a single month would not provide an organization with any significant knowledge as to how the organization is actually performing. By providing some historical context, such as the inclusion of financial figures from preceding months, the information possesses utility. This utility enables the organization to uncover insights and act appropriately.
AI models have the ability to correlate and combine ever-increasing volumes of data to yield even greater insights. An underlying information architecture fosters an ability to make the data discoverable and to organize the data in such a way as to drive affinity.
Discovery becomes an important topic, as no organization functions with a single database for the enterprise's data. Furthermore, no organization could exist with just one single database for the enterprise's data.
The needs of an organization, when combined with real-world physics, make seeking a single version of the truth (a single database for a single fact) a misplaced ideal. Should a single version of the truth be possible, an information architecture would not be necessary. The basis of an information architecture is therefore predicated on the fact that multiple versions of data exist and that supporting multiple versions of data is, in fact, desirable. The key use of an information architecture is to help enforce integrity specifically because a single version ideal cannot be achieved.
A single version of the truth concept relies on achieving one unchallengeable source within an organization to deliver all of the crucial data and information required to run a business. The crucial data may include customer details, supplier details, product information, service contracts, and so on. By using a single version of truth, the perception of control is achieved.
The single version is viewed as being reliable and can be used by every department and line of business. The single version is not specific to any one part of the business and therein lies the rub: an inability to directly support personalized needs. Personalization was a topic covered in Chapter 3, “Framing Part II: Considerations for Working with Data and AI.”
Not having or not striving for a single version of truth can be considered as a means to promote a discombobulated and chaotic proposition for an organization. However, within the ability to architect a solution lies the innate opportunity to meaningfully manage and sustain a solution to avoid any untoward side effects and outcomes. As such, an information architecture affords the ability to manage multiple versions of the truth and to sustain a viable solution over time.
While deploying multiple sources for what is supposed to be the same data can lead to confusion and mistakes, the outcome does not have to be that way. Organizations that seek to manage a deployment based on multiple versions of the truth are not subscribing to the overt creation of alternative facts—whether intentionally or unintentionally.
Expanding the Means to Act
Multiple versions of the truth accommodate data value chains and recognize that not everyone within an organization needs to consume data in precisely the same way. Specialized data assets provide the opportunity to align information to a person's job for the purposes of promoting efficiencies. For example, certain tasks can be made easier when information is organized in a graph database, such as fraud detection, whereas a graph database is not necessarily the appropriate repository for all types of analytics.
Taking an architected approach to building a multiple-version data topology allows the data scientist to discover and explore the features associated with each instantiation of data, because the adoption of a multiple-versions-of-truth approach does not dictate that each version must be an exact mirror. Each version represents data that is in accordance with the data's place in the value chain and organized within a specific schema. A schema in one version may be a fully denormalized flat file, another might use a relational model organized around the principles of third-normal form, and another schema might be based on a dimensional model, a graph model, a document store, etc.
Consider the way in which a data scientist might prepare models for an organization's marketing department and an organization's accounting department related to marketing spend. The models built for the marketing department might be oriented toward certain predictions relating to campaign effectiveness and marketing expenditures. The models for the accounting department might focus on features for predicting cash flow and predicting when invoices are actually going to be paid.
The outcomes from the models for the marketing and accounting departments are different, and the difference does not imply that one or both are incorrect. Having data stores that are oriented toward the requisite features relevant to a given department can help the data scientist in building a model as well as helping the individuals who query the data stores for self-service analytics.
Within the context of the DIKW pyramid, both the single version of truth and the multiple versions of truth represent information. However, as knowledge and wisdom represent higher levels of attainment from the use of data and information, the multiple-versions-of-the-truth paradigm can help to directly organize data and information that is closer to its contextual use. Therefore, the creation of information architecture helps the architect to think through design concepts for managing multiple versions of the truth, and multiple versions of the truth can be a practical device for establishing contextual versions of the truth.
The pathway from data to wisdom provides a line of sight for the creation of a data-centered value chain through the use of multiple versions oriented toward contextual use. The insight generated from a specialized data store is likely to be greater than the sum of the parts. Being able to curate data is a core practice in building an information architecture that supports multiple versions of the same data. Curation is not an act of gathering as much information as possible; curation is about providing sufficient information as to drive knowledge. And, knowledge requires context. Curation provides a general bounding scope that makes the search for knowledge practical.
Curation
Curation is a field of endeavor that involves assembling, managing, and subsequently presenting some type of collection. To curate, you generally need someone or something to act as a curator because data is not, as already mentioned, self-organizing (self-assembling, self-managing, or self-presenting).
For example, a curator in a museum will research, select, and acquire pieces for the institution's collections and will oversee interpretation, displays, and exhibits. When a person visits a museum, not everything that is on display is representative of everything that the museum has acquired or can possibly access for its display. Overall, curation is an ability to dutifully subselect—to cherry-pick and to meaningfully arrange.
A curated set of data is chosen so as not to overwhelm or to mislead. Curated data can provoke interest, improve understanding, and foster efficiency. Curated data is not data that is randomly placed and interspersed. Data curation is an activity that has historically been ignored, due to constraints involved with cost, storage, and processor speeds, and with organizations preferring to create encompassing homogenous datasets for general-purpose use.
The ability to curate data for discrete communities of interest helps to avoid having a logical or physical central melting pot for every piece of data—the mythical single version of the truth. “Logical” is used in the sense that the data itself may be spread over multiple locations and across multiple technologies.
Data is a digital asset. As such, it is easily replicated without any loss of precision. Therefore, the same data asset within a data topology may appear in more than one data zone. This is an essentially different task from that which is afforded to a museum curator, who must pick only one place to showcase a tangible artifact. Data curation and data topologies are not constrained to finding the best home for a single piece of data, but rather, the best homes (i.e., the most applicable data zones) to place the data, so as to maximize the data's potential to drive value—via a person, piece of code, or a model.
Curated data affords the user an ability to access assembled and managed data for a broad spectrum of uses while being focused on supporting the user's needs—creating a set of data that supports a personalized work experience. For example, curation is a process that can make separating raw data from cleansed and standardized data that is repeatable and straightforward for a data scientist. If the data scientist just requires current production records, those records can be curated from a data store that also includes historical records. If the data scientist needs an end-to-end view of a supply chain, the end-to-end view can be curated to make navigation easy and reliable. If the data scientist needs to seek observations to help improve support for knowing-your-customer (KYC), irrelevant data can be separated from the curated set.
Within the capabilities of a given set of data-oriented technologies, a data topology promotes data curation to support enterprise views, line-of-business views, departmental views, group views, and even the discrete views for an individual businessperson—where each represents a personalized subset.
Establishing a data topology is the starting point to allow for data curation. As discussed in Chapter 5, “A Look Forward on Analytics: Not Everything Can Be a Nail,” a data topology is organized around data zones and includes a series of data flows and the data topography. Collectively, the data zones comprise a zone map, much like a museum map with all of the different viewing rooms based around themes and topics. Each data zone is themed and provides the basis for assembling, managing, and presenting digital assets—something that data or information cannot achieve without aid.
Data zones are created based on an area of business interest. The data zone represents a subset (or a collection) of data that is reasonably aligned to an area of interest but loosely enough so as not to constrain insight.
Data curation is an exercise of a control. Controls can be viewed as foundational toward building trustworthy data for use in business-critical situations. Controls are normally added through the use of data management and data governance. As an example, consider a bank looking to perform risk data aggregation across different lines of business into a common risk-reporting platform that is in accordance with the Basel Committee on Banking Supervision (BCBS) 239 standard (www.bis.org/publ/bcbs239.pdf). The data needs to be highly accurate and accompanied by the correct data lineage to help ensure that all of the reports are acceptable. Banks rely on their ability to produce compliant reports for key decision-making regarding how much capital to carry. Without the data lineage, there would be little assurance that the data is, in fact, accurate. Curating the data can help meet the needs of the users and help work toward ensuring compliance.
By using data governance and integrated data management capabilities, organizations can manage, automate, and execute operational tasks that can make offering curated data at a personalized level to make an employee's job easier to perform and more efficient.
Data Governance
As discussed in Chapter 3, data governance is an essential element for organizing data and can be used to provide mechanisms to perform the oversight necessary to ensure that the data is appropriately used for decision-making. To that end, data governance is both a tools-based process and a human-based process. Some of the human processes can be as simple as assigning a data steward or a data custodian to a new dataset.
Data governance practices can be formalized through the creation of a data governance council, a group that can establish data definitions and standards and ensure that the needs of the organization are taken into account when designing a data topology.
Here too, the tooling for data governance can assist by recording the assigned person or team that is acting as the data steward, providing a dashboard to the data council, and seeking to leverage AI-based automation through cognitive classification that can assist with standards.
When considering goals for a data governance initiative, the following factors should be taken into account:
- Quality and consistency: Being able to ascertain the level of quality and consistency in the data so that the data can prove useful to business users and data scientists alike while making important discoveries and decisions
- Policies and standards: Ensuring that the policies and standards can be adequately stated for ingesting, transforming, and using data and that, subsequently, they are observed or enforced uniformly throughout the organization
- Security, privacy, and compliance: Even with digital democracy, limiting access to those with need and justification
- Data lifecycle management: Making provisions for data to be off-boarded (archived or hard-deleted) as well as onboarded. In addition, this includes being able to understand how data decays over time so that the appropriate datasets are accessed.
Figure 3-5 in Chapter 3 illustrated how data governance could be applied proactively or reactively by an organization. The factors listed here can be incorporated into Figure 3-5's controls lifecycle: ensure, assure, insure, and reassure.
The effectiveness of data governance depends on how a governance body decides to react and adapt to the cultural environment within the organization. To that end, data governance may have to continually adjust its modus operandi or help to influence a change in the organizational behavior. In either case, data governance must manipulate or tweak its operations. In Figure 7-2, this tweaking is called dialing.
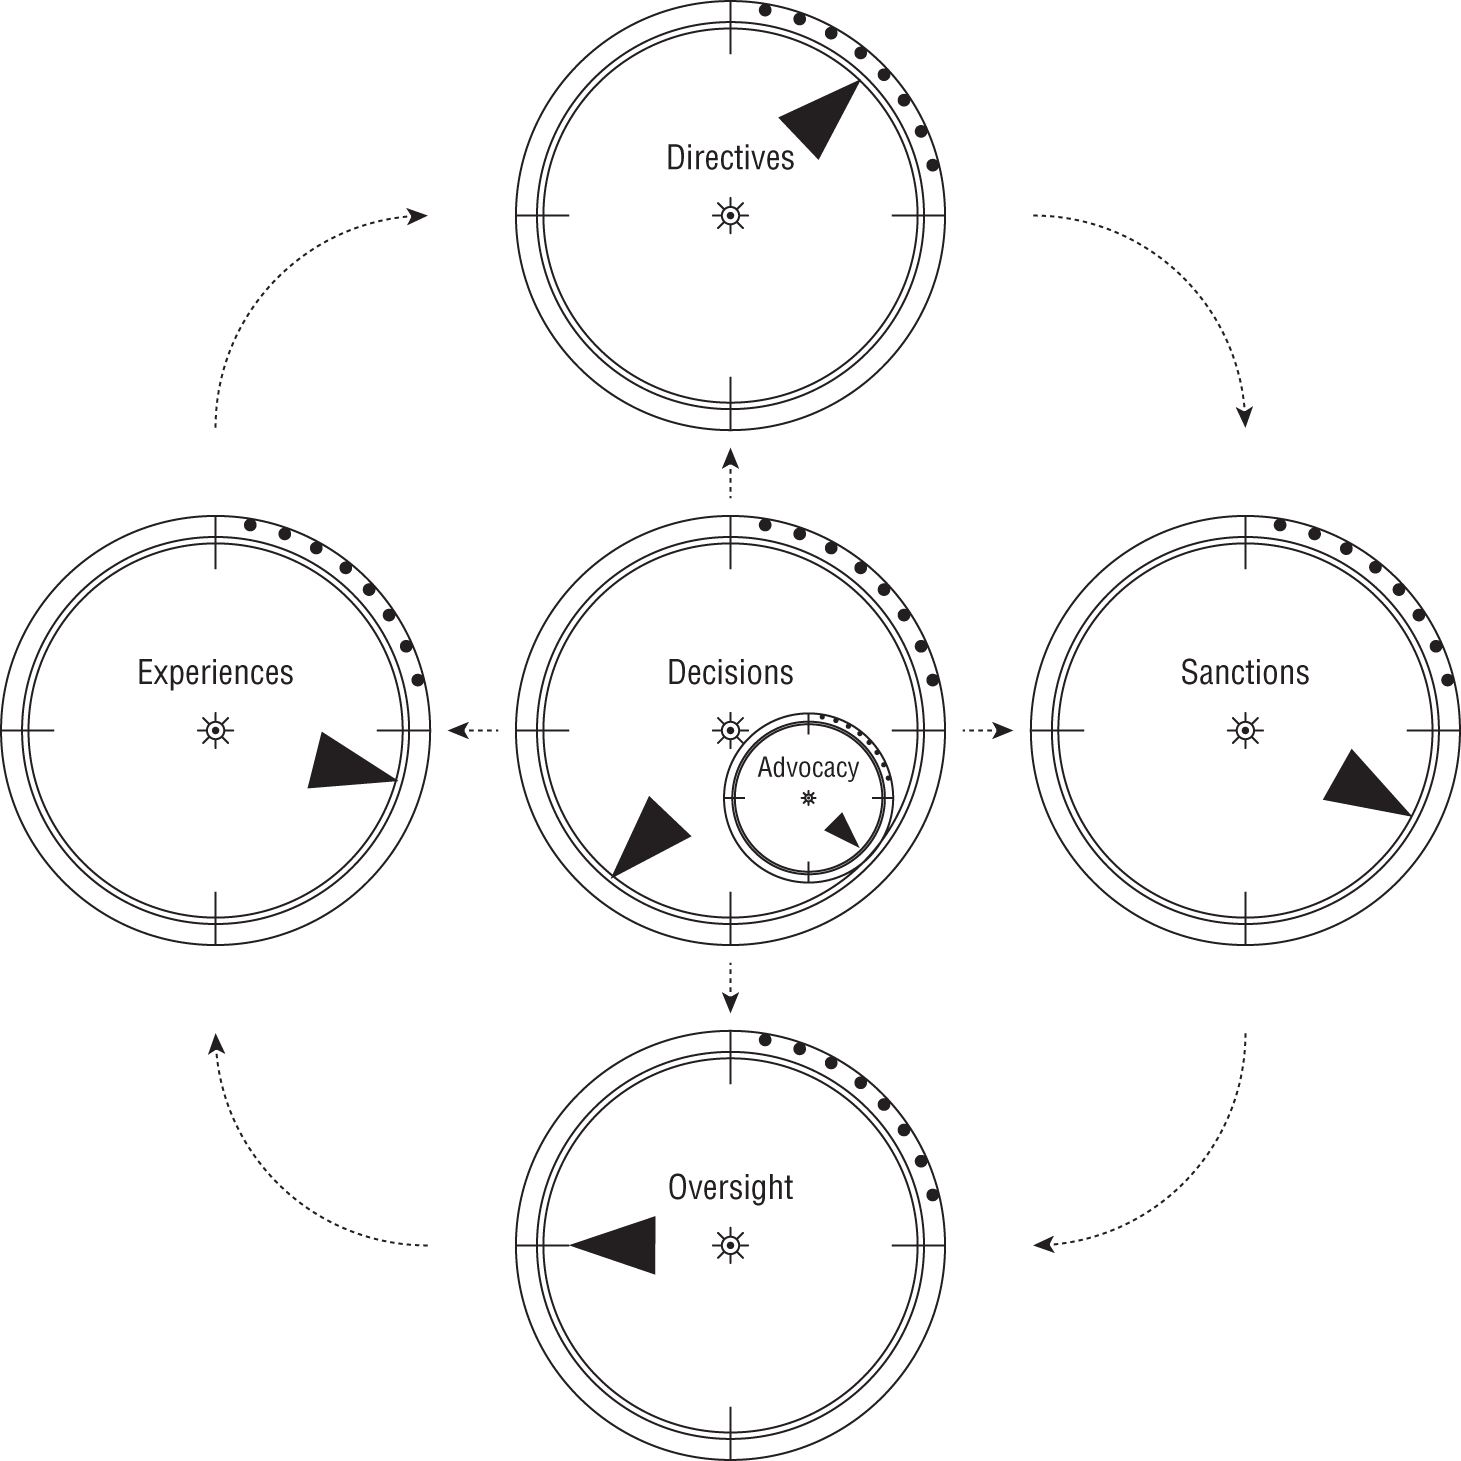
Figure 7-2: Dialing data governance
The model in Figure 7-2 gives an overview of the data governance operational adjustment process. The process consists of five primary dials with one subdial. The dials are named as follows: Experiences, Directives, Sanctions, Oversight, Decisions, and Advocacy.
The collection of dials identifies core operations that can be tuned to meet the cultural style and objectives for data governance within an organization.
- Experiences are related to the evaluation of operational experiences for deployed solutions and are to ensure that quality and integrity are preserved and sustained. In addition, compliance and regulatory requirements are intended to be met.
- Directives include the development of policies and guidance, as well as the interpretation of other sources of influence, both internal and external.
- Sanctions can involve licensing or certifying that data stores are trusted and being used as intended. Additionally, data consumers and data providers are authorized so that an inventory is maintained to assist in tracking the provenance of all data.
- Oversight relates to the activities that are necessary to ensure that integrity, compliance, and consistency are achieved and sustained.
- Decisions are ones that result from performing research on data-related issues, holding meetings to address any concerns that a community of interest may have, and working with other governance bodies within the organization to ensure symmetry in decision-making.
- Advocacy is to promote the successes achieved by the organization to the organization as a whole. Advocacy becomes the promotional arm of data governance.
The dials are impacted and adjusted as the data governance body strives to improve its processes in these five areas by assessing need and determining risk. Within data governance, risk combines the probability of noncompliance with the consequence of noncompliance and, finally, how to optimally mitigate an issue should noncompliance occur.
In many cases, a deployed environment provides the context for data governance to fully rationalize the synergies or outcomes between intention and practice. As such, the data management underpinnings are extremely important to a data governance practice.
Integrated Data Management
In the discussion of the value chain earlier in this chapter, the progressive hierarchy DIKW was used to illustrate that how you choose to organize business facts can have a significant bearing on how useful those facts are when they're being used. The usefulness for how facts can drive action from insight was illustrated through Zeleny's know tags, specifically, the tags for knowing how and knowing why. The how and why know tags aligned to knowledge and wisdom in the DIKW hierarchy.
To illustrate an example of data, we can use a person's vital signs, which represent measures for essential body functions, such as the heart rate. Other vital signs would include the breathing or respiration rate, body temperature, and blood pressure. Blood pressure is an interesting data point as it is made up of two separate facts: a systolic reading and a diastolic reading. Depending on your design preferences, you may choose to store blood pressure in a multitude of ways, including whether to use a single feature or two features.
Systolic blood pressure is a measure of the pressure in your blood vessels when your heart beats, while diastolic blood pressure is a measure of the pressure in your blood vessels when your heart is resting between beats. If the systolic and the diastolic readings are stored in a single feature, it would be essential for most users that the systolic reading appears ahead of the diastolic. Blood pressure is generally captured in terms of millimeters of mercury (mmHg)—but it is possible that other units of measure could also be used.
Blood pressure may be stored as a single value such as “120/80.” Possible alternatives may include “120 80,” “120|80,” “120-80,” “120/80 mmHg,” and “120/80 mm Hg.” Normally, the data's metadata would include a description as to how to decipher the reading. But if data is being collected from multiple points of origin, the format may turn out to be nonstandardized. Standardizing disparate formats and the metadata would be one way that information can be produced (relative to the DIKW hierarchy). If you are storing blood pressure readings as two separate and distinct values, the name of the feature or the metadata should clearly delineate which reading is which.
If individual vital signs represent data, information would be the result of correlating the measures with an identifiable individual and other pertinent facts. The information could be further enriched if a series of vital signs were collected over time as part of a longitudinal comparison for the individual.
By adding context, knowledge (in terms of DIKW) would result if a practitioner or a model could synthesize data points so as to understand whether or not some form of an intervention is likely to be required, while wisdom (per DIKW) would be a demonstration in the accuracy of selecting an appropriate intervention. Furthermore, accuracy should be incorporated as additional data points that are captured as part of a feedback loop and to further support aspects of wisdom.
Understanding value, as well as the contexts for which facts will be used during the course of business, will serve to significantly influence your design choices. Realistically, you'll want to serve data in a multitude of forms, which is also why data curation and data governance must be considered important topics of consideration for building an information architecture for artificial intelligence at the scale of the enterprise.
The activities for value recognition/generation, curation, and governance are to a large extent optional, while data management activities can be considered more mainstream. Each decision point or each design point regarding value, curation, and governance will make use of the set of data management activities.
The use of an integrated platform for managing all aspects of a data topology is often preferable over stitching together a series of different point products. As data is ingested, metadata can be captured. As the data is transformed, the data is refined. As the data flows, the data lineage can be automatically captured.
Rules can be applied to inspect the data for quality so that whatever data becomes available for consumption, the information has gone through a series of data quality checks such as the data's perceived accuracy and the precision by which the data represents its real-world corollary. Other data quality checks can include the data's legitimacy, validity, reliability, consistency, timeliness, relevance, completeness, comprehensiveness, availability and accessibility, granularity, and uniqueness.
To be effective, a data management platform requires data. Before the data can be consumed, the data must first be acquired or ingested. As acquisition may not always be as straightforward as pulling data from an SVOT, an integrated data management function must work in tight coordination with a data governance practice.
Onboarding
A managed data ingestion process helps to simplify the onboarding process for new datasets, and subsequently, a repeatable process has a positive impact on the development of new use cases and applications. Managed data ingestion also serves as a well-defined data pipeline throughout all of the zones across the data topology.
There are various options for incorporating data into a data zone. These options may be based on whether the information is being acquired internally via the completion of a transaction, externally acquired via a data stream, simply through the movement from one data zone to another, and so on. Incorporating data in a managed way means that you have control over what data is actually ingested, where the data originates, when the data arrives, and where in the zone map the data is stored.
Using the concept of the data zone means that certain data is intentionally duplicated. This feature is regarded as controlled redundancy because the use of data governance provides insight as to where the data is located. Controlled redundancy is the means to create multiple versions of the truth that are adequately managed to ensure integrity.
A managed ingestion process can be used to raise notifications and capture log entries so that the environment can be adequately diagnosed should an ingestion process fail. These capabilities can aid in remediation and help with restarting a process.
Additionally, over time, streaming workloads are likely to be increasingly used as data feeds. Service level agreements (SLAs) via policies can be used to determine whether the stream payload is exhibiting acceptable behaviors. An SLA is a vehicle to make explicit acceptable terms and conditions between multiple parties. Typically, one party is providing something, and another party is receiving something. Both parties may be internal to an organization. The SLA often outlines both the conditions that are used to identify or interpret a failed condition and the actions that are necessary to remediate a failed condition.
Metadata needs to be captured through a batch process or a streaming process regardless of data being presented to any of the data zones. A batch process is an interchange of data that normally occurs at a prescribed time based on a schedule. A streaming process is an interchange that is continuous. Data quality checks are also a requisite need for streamed data. Record formats, as appropriate, need to be validated for correctness and that the content values conform to range checks, specific values, or referential integrity checks.
Data zones follow a prescribed data flow for distributing and moving data. While the data flow itself can be agnostic to the organization of data, the receiving data zone receives data for a given purpose, and that purpose often requires the data to be organized.
Organizing
When data is stored, data encryption for added security may be a requirement to consider. In addition, data may need to be redacted (masked) or obfuscated (tokenized) and then protected with the appropriate level of access control.
The implication for services such as security is that they need to be provided enterprise-wide across the entire zone map and that there has to be inherent support for multiple business groups.
Multiple business groups need to coexist and gain access to cataloging aspects for their business data. While this can be efficiently accomplished, time must be spent to make sure the governance team fully understands the permission levels required.
For example, protected health information (PHI) will legally require privacy controls for an organization operating in the healthcare industry. Violators—organizations that do not respect PHI—can be financially penalized. The European General Data Protection Regulation (GDPR), mentioned in Chapter 2, also seeks to enforce not only what information is kept but also how that information is used.
The data preparation stage, which is further described later in this chapter, is often where sensitive data, such as financial and health information, is manipulated. Sensitive or private data can be completely removed through a process known as redaction or masking.
Alternatively, sensitive or private data can be converted to an innocuous value in a process known as obfuscation or tokenization. The technique to obfuscate should be unidirectional and not subject to techniques of reverse engineering. Unidirectional obfuscation helps to safeguard the data by ensuring that a mathematical process cannot uncover the original values.
Determining the best format to store data must be considered. Data may need to be held in a raw format, the format by which the data was first collected within the data topology. Depending on the user community, the raw format is not always going to lend itself to being in a readily usable state for consumption—a topic previously covered in the discussion of personalization (Chapter 3) and multiple versions of the truth and controlled redundancy earlier in this chapter.
For example, data scientists, as well as citizen data scientists (individuals whose primary job function is outside of the field of statistics but who are able to create or generate a machine learning model or an AI model), may require features organized in a certain manner to complement the algorithms that are being used. An example is separating (parsing out) an embedded county code from a telephone number. (The telephone number +1.212.555.1212 would become two features: +1 and 212.555.1212.)
Analytical queries that are performed on a columnar data store can often return results faster than those using a traditional row-oriented data store. Data compression is also another consideration when storing large volumes of data. Many unstructured datasets that are not text-based may enter a data zone in a format that is already compressed, such as those that are used for audio and video.
Automating aspects of the data lifecycle management process can be required, for example, to help address SLA needs in supporting certain queries. If fast data access may be required for data that is less than 30 days old, a memory-resident data store may be required.
Additionally, the scenario for managing data that is 31 to 90 days old may permit slightly slower response times and may require the use of solid-state flash drives. Beyond 90 days, the SLA might tolerate even slower data access times, and the data might be migrated to slower commodity disks for a period of up to 7 years. After 7 years, the data may then need to be physically removed or archived to a data zone that has been explicitly designated for archival purposes.
A designated archival zone may also be mapped to another part of the data topography within the data topology whereby the pre-archive zones are associated with an on-premise fog computing node, and the archival data zone with a public cloud provider.
As data can be managed across the zone map, an indexing mechanism for the data topology is warranted. Many indexing capabilities are incorporated into data catalogs.
Cataloging
A catalog helps data scientists and business users quickly discover data assets that can be accessed, categorized, and shared. Data assets can include business data, and it can also include analytical models.
A catalog as a function of data governance helps users understand what exists within the data topology. Users also need to know the data's properties, lineage, provenance, ingestion histories, the level of data quality, and other KPIs associated with the life history of data.
Data scientists and other data professionals often experience a situation where their time is disproportionately consumed during problem solving. Instead of working on the core problem, they burn significantly more time on finding and preparing the appropriate data. As a result, data scientists may feel pressured to rush through important activities such as model building, visualizations, and reporting.
A core part of an information architecture includes the ability to control data and to prevent it from becoming invisible or unmanaged. Often organizations encounter situations where the more data that is added to the data topology, the harder the data becomes to find, store, and govern. To help thwart any potential problems, a catalog becomes a vital tool. A data scientist or a business analyst must always be able to determine the following:
- Where exactly is the organization's data?
- What does the data truly represent?
- Where did the data originate?
- How accurate is the data?
- Can the data be trusted for the purpose for which the data is needed?
- Can the data be used for purposes other than which the data was originally intended?
- How should the data be accessed?
- Do I have permission to see the data?
The profile of the data, including the meta-triad attributes for business metadata, technical metadata, and operational metadata, should be readily accessible. This information needs to be abstracted so users can understand it and use that data effectively for insight. This is the role of the data catalog within the data topology.
The data catalog needs to be searchable, whether for the source system, schema attributes, subject areas, or time ranges. A cognitive search is essential for business users to maximize the use of the data topology in a swift and agile way.
With a data catalog, users can uncover datasets that have already been curated so that they do not have to spend time cleaning up and preparing the data all over again. Being able to select datasets required for model building without having to involve an IT department shortens the analytics timeline.
While a catalog can provide many features, the information that makes up the catalog is metadata.
Metadata
Metadata is extraordinarily important in the efforts to manage a data topology effectively. Metadata helps to avoid data dumping, which is a situation where persisted data results in consuming disk space without ever providing any business value.
Metadata is critical for ensuring data is leveraged to its fullest extent. Whether the data is manually collected or automatically created during the ingestion process, metadata allows users to locate the data they need to analyze. Metadata also provides clues for future users to help with understanding the contents of a dataset and how the underlying data can be leveraged and reused.
As the data topology grows and more information is flowed across the zone map, the use of metadata becomes intrinsic to conducting daily business and decision-making. Metadata becomes a vital asset.
The meta-triad consists of business metadata, technical metadata, and operational metadata.
- Business metadata is used to capture the definition of what the data means to the analytics user and includes business names, descriptions, tags, data quality measures, and masking rules.
- Technical metadata is used to capture the form and structure of each dataset and includes the type of data such as text, JSON, Avro, and the structure of the data in terms of fields and their types.
- Operational metadata is used to capture lineage, data quality, profile, and provenance of the data and includes source and target locations of data, the dataset size, the number of records, and the data lineage associated with all data flows.
Without all of these types of metadata being created and actively curated, the data topology may result in a failed information architecture. Metadata can also be used to capture the contextual use of data within a data zone. As such, metadata can provide a basis for data-driven data preparation approaches to organizing and enriching data.
Preparing
While raw data has utility and use, the term raw implies that refined data must either exist or be required. Data preparation refines the data, making it easier for business users to access. Ideally, refinement can be carried out without the need to rely on IT to perform an activity.
While access to raw data can be vital, the data scientist can also benefit from access to prepared data. Data preparation is required as part of delivering contextual data assets to each business community within the organization. Inevitably, data can arrive into the data zone with various types of errors, corrupted formats, or duplications. Often the imperfect data is contextually associated with the next series of data points, which are associated with the value chain and should be remediated.
Adequately preparing and cleansing the data is necessary and should be accomplished with the understanding of data security, data quality, and data visibility.
Data preparation activities can include the following:
- Data tagging to aid searching and organizing the data
- Converting data formats so that queries are easier to create and potentially faster in their execution
- Completing complex workflows to integrate updated or changed data
Data preparation should generate metadata for data lineage, transformations, and exercised queries as a byproduct of the preparation. Additionally, when generating refined data from any raw data, fields for data provenance should be created. The data provenance helps trace individual records or fields back through the data lineage to the source. Additionally, format conversions may be required as part of the data preparation such as transforming data from a row-wise organization to a columnar data format.
Other issues can also arise. Source systems are not immutable and may change over time, potentially frequently. Datasets may need to be managed as a time series over a period of time.
Not every data store is preplanned. Certain data stores are dynamically provisioned, but the data should still be prepared for use.
Provisioning
Self-service consumption can be an essential part of a successful data topology. Different types of users consume data in different ways and look for different things. The need to access data in different styles should be self-evident based on the number of different job roles and responsibilities that exist within an organization. Overall, provisioning provides for empowered users to gather data of their choosing and recognizes that different users may want to work with data in different formats from various sources of data.
Take, for example, the simple activity of reviewing quarterly company revenue. The CFO's office may want to look at the fiscal quarter's physical revenue (monies that have been deposited into a corporate bank account or a line of credit that has been drawn down). The sales department may want to look at revenue for purchase orders that have been received during the quarter, while marketing may want to look at the revenue associated with the quarter's business pipeline. Each need looks for comparable things differently and in a different manner. But each user and even the data scientist would prefer to access the data in a self-service manner, without the formal aid of IT.
Several personas are attributed to the analytical users of a data topology.
- A senior manager may seek trends or aggregations to make an important business decision and might look at the predictive analytics of sales based on history and analytical models that were built by a data scientist. Within the data topology, the data could be ingested from numerous data sources including both streamed and batched data. The data would have been massaged through the data zones as a series of data flows to help produce a final dataset with insights that can be presented in a visual format.
- A data scientist typically consumes data to develop and build a model. By performing discovery or exploratory ad hoc analysis, the data scientist can iterate on their models to prove or disprove a hypothesis. Data scientists who build and test their models find utility in having access to complete datasets from the relevant part of the value chain for which they are interested. A data scientist is likely to write scripts in Python or other appropriate languages to further manipulate the data and generate engineered features.
- A business analyst may try to correlate multiple datasets together to manufacture an aggregated or holistic view of a scenario. A materialized view can be sliced and diced using transitional business intelligence approaches or other visualization tools. With self-service capabilities and tools, a business analyst can be given a data zone to curate data for their needs and take control of their own requirements. For example, a business analyst might need to investigate the impact of severe weather on projected sales. Based on historical data from public datasets and combined with in-house datasets from the data topology, the business analyst can search the data catalog to see what datasets have been cleansed and standardized and then run queries against that data.
- Another persona type is the downstream system, such as an application or another platform that receives either raw or refined data via an extract or an API. For example, if the downstream application is a database, a data zone can send the final aggregated data to the downstream system for subsequent processing.
Multi-Tenancy
With many persona types in an organization, multi-tenancy allows for one or more logical software instances to be created and executed on top of primary software. Multi-tenancy provides for multiple personas to work in a software environment at the same time, each with their own separate user interface, resources, and services.
A managed approach to data topology can help avoid the need for separate business units to sponsor discrete business-unit-owned data topology environments. A data topology should be established, from the onset, with multi-tenancy in mind. A multi-tenancy topology will exhibit characteristics that can address overarching integrity through lineage, contextual use/understanding, metadata, and any transformations that have been applied.
- Tracking the source and lineage of any data loaded into the data topology provides traceability. The lineage can help an organization determine where the data came from, when the data came to the data topology, how many records were contained in the data, and if the dataset was created from other datasets. These details help establish accountability and can be used to perform impact analysis on the data.
- Context can be attributed to the data if the purpose for which the data was collected is tracked and augmented with any employed sampling strategies or business glossary entries. Collecting provenance and context can provide productive alternative types of insight during the analytical lifecycle as users seek to derive insights from the actual data.
- Each time new data is loaded into a data zone from the same source, an operational metadata entry should be produced. Operational metadata would also apply as a means to record any changes from the original data that have been introduced via an update. If a large organization had many retail stores and each retail store had many point-of-sale terminals, any upgrades would likely take place over a period of days or weeks. During the transition period, a data zone could receive mixed formats. Some might be associated with the old terminals, and the others might be associated with the upgrade. Keeping track of the versions and the metadata is part of the logging.
- As changes occur, operational metadata should track when the data was changed, by whom, and by what method the change was accomplished.
- Driving transformations through the use of metadata (such as the technique of using a decision table) can significantly help with streamlining. Transformations may involve converting data from one format to another. For example, machine learning algorithms are easier to assemble when working on a completely denormalized record.
- While performing a transformation is a necessity when producing refined data, the type of transformation should subsequently be discoverable. Tracking the data lineage should also expose how individual fields were transformed.
- Managing all of the metadata requires an independent metadata data store. The data store should be able to manage all forms of metadata, including business metadata, technical metadata, and operational metadata.
Within an integrated data management platform, multi-tenancy can make upgrading software easier as a central application or codebase can be updated instead of multiple instances needing to be updated, and the changes can be made instantly available to all users. Additional layers can also be incorporated to provide for customizations while still maintaining an underlying codebase that can remain constant for all users. Multi-tenancy can also benefit because dedicated resources are not required to be reconfigured after an upgrade has taken place.
Summary
This chapter identified how the pyramid for data, information, knowledge, and wisdom could provide the logic to understand the separation between data and information, followed by the necessary contexts for knowledge and wisdom. The pyramid helps to shape why information architectures are developed rather than wisdom architectures.
To support knowledge and wisdom, the use of multiple versions of the truth helps to promote curated data stores for personalization and organizational efficiencies. But to ensure integrity, data governance is required to make the information architecture plausible.
The use of an integrated data management platform must also provide a basis to provide a practical environment for which to deploy the information with considerations for onboarding data, data preparation, data cataloging, metadata support, provisioning, and organizing data along with the support for multi-tenancy. Data should be deliberately organized so as to turn as much data as possible into information. Information becomes the natural bedrock to insight and to driving knowledge-based decision-making and wisdom-based action.
In the next chapter, various organizational needs are accessed for addressing democratized and nondemocratized data for purposes of performing analytics and AI that support prediction, automation, and optimization.