
Tracing of a program right from the beginning can often be used as an advanced debugging technique. Tracing allows a developer to trace program execution, find caller/callee relationships, and figure out all functions executed during the run of a program.
Python comes with a default trace module as part of its standard library.
The trace module takes one of the –trace, --count, or –listfuncs options. The first option traces and prints all the source lines as they are executed. The second option produces an annotated list of files, which shows how many times a statement was executed. The latter simply displays all the functions executed by running of the program.
The following is a screenshot of the subarray problem being invoked by the –trace option of the trace module:
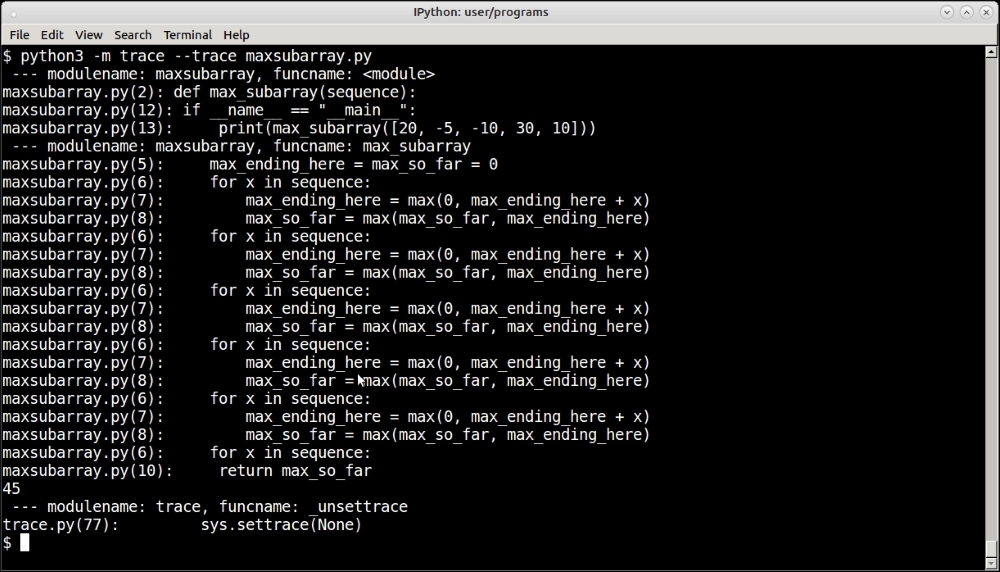
Tracing program execution using the trace module by using its –trace option.
As you can see, the trace module traced the entire program execution, printing the lines of code one by one. Since most of this code is a for loop, you actually see the lines of code in the loop getting printed the number of times the loop was executed (five times).
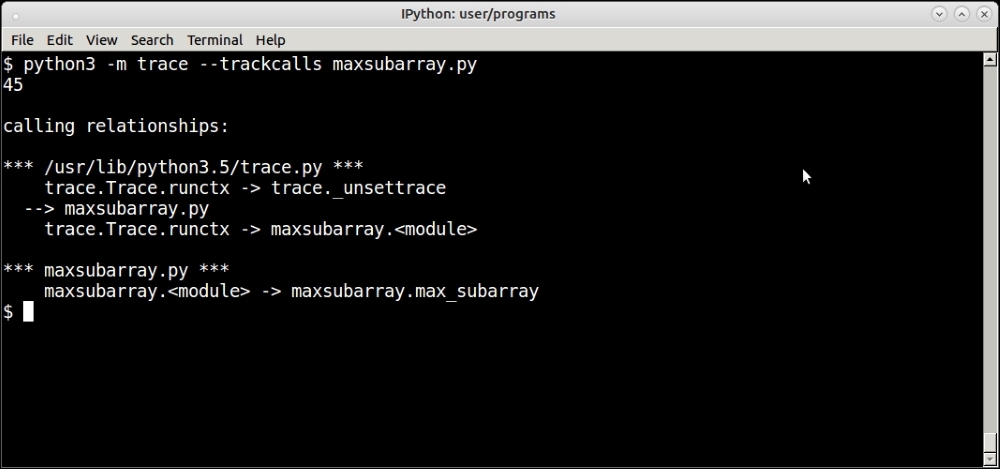
The –trackcalls option traces and prints the relationships between the caller and callee functions.
There are many other options to the trace module such as tracking calls, generating annotated file listings, reports, and so on. We won't be having an exhaustive discussion regarding these, as the reader can refer to the documentation of this module on the web to read more about it.
When debugging servers and trying to find out performance or other issues on production environments, what a programmer needs is not often the Python system or stack trace as given by the trace module, but to attach to a process in real time and see which functions are getting executed.
The lptrace package allows you to do this. Instead of giving a script to run, it attaches to an existing process running a Python program via its process ID, such as running servers, applications, and the like.
In the following screenshot, you can see iptrace debugging the Twisted chat server that we developed in Chapter 8, Architectural Patterns—The Pythonic Approach, live. The session shows the activity when the client andy has connected:
The iptrace command debugging a chat server in Twisted
There are lots of log lines, but you can observe how some well-known methods of the Twisted protocol are being logged such as connectionMade when the client has connected. Socket calls such as accept can also be seen as part of accepting the connection from the client.
strace is a Linux command, which allows a user to trace system calls and signals invoked by a running program. It is not exclusive to Python, but it can be used to debug any program. strace can be used in combination with iptrace to troubleshoot programs with respect to their system calls.
strace is similar to iptrace in that it can be made to attach to a running process. It can also be invoked to run a process from the command line, but it is more useful when running attached to a process such as a server.
For example, this screenshot shows the strace output when running attached to our chat server:
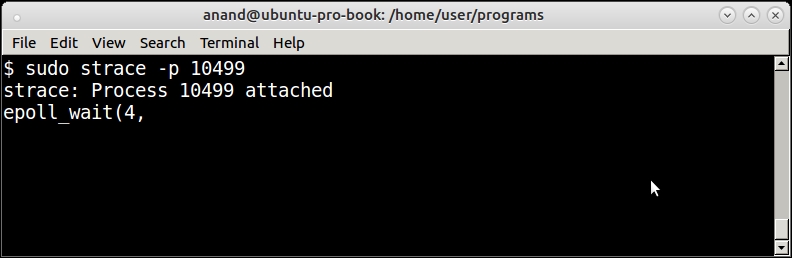
The strace command attached to the Twisted chat server
The strace command corroborates the conclusion of the lptrace command of the server waiting on an epoll handle for incoming connections.
This is what happens when a client connects:
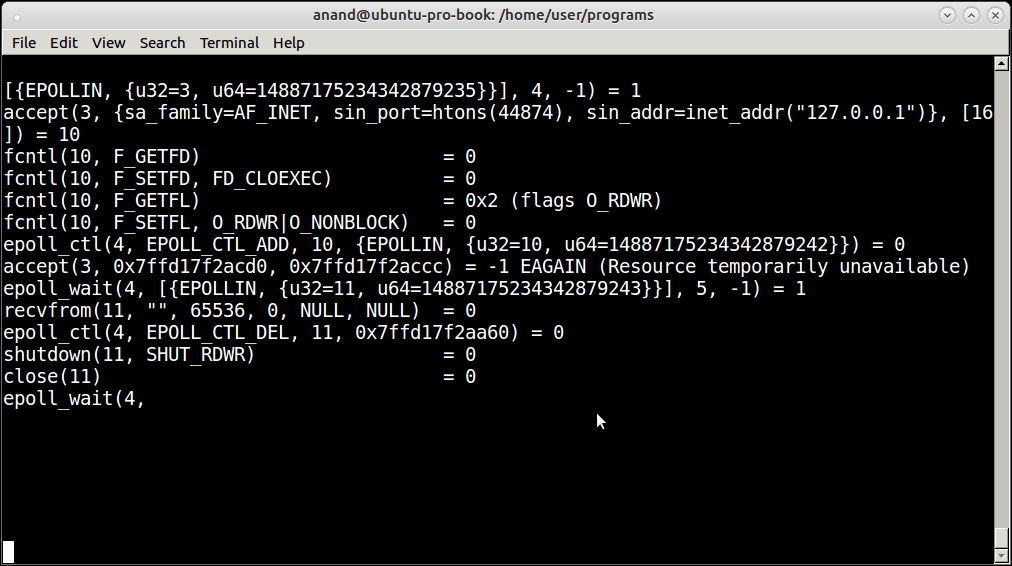
The strace command showing system calls for a client connecting to the Twisted chat server
strace is a very powerful tool, which can be combined with tools specific for the runtime (such as lptrace for Python) in order to do advanced debugging in production environments.