

teSting eStimation 175
The above sample is 100% of the distribution of effort across various phases.
But note that function points or any other estimation methodology only gives
you the total execution estimation. So you can see in the above distribution we
have given coding 100%. But as previously said it is up to the project manager
to change according to scenarios. From the above function point estimation
the estimation is 7 days. Let’s try to divide it across all phases.
Phase Percentage distribution effort Distribution of men/
days acrossphases
Requirements 10% of total effort 0.9 days
Design Phase 20% of total effort 1.8 days
Coding 60% of total effort 7 days
Testing 10% of total effort 0.9 days
Total 10.6 days
Table 35 Phase-wise effort distribution of man days
The table shows the division of project men/days across the project. Now
let’s put down the final quotation. But first just a small comment about test
cases.
The total number of Test Cases
5 (Function Points) raised to a power of 1.2.
(a) hoW can you estimate the numBer of acceptance
test cases in a project?
The number of acceptance test cases 5 1.2 * Function Points.
20–25% of the total effort can be allocated to the testing phase. Test cases
are non-deterministic. That means if the test passes it takes “X” amount of
time and if it does not then to amend it takes “Y” amount of time.
Final Quotation
One programmer will work on the project for $1,000 a month. So his 10.6 days
of salary comes to around $318.00. The following quotation format is a simple

176 Software teSting interview QueStionS
CustomerSampleFP.xls is provided on the CD which has all the estimation
details you need.
GSC Acceptance in Software industry
GSC factors have been always a controversial topic. Most software companies
do not use GSC, rather they baseline UAFP or construct their own table
depending on company project history. ISO has also adopted function points
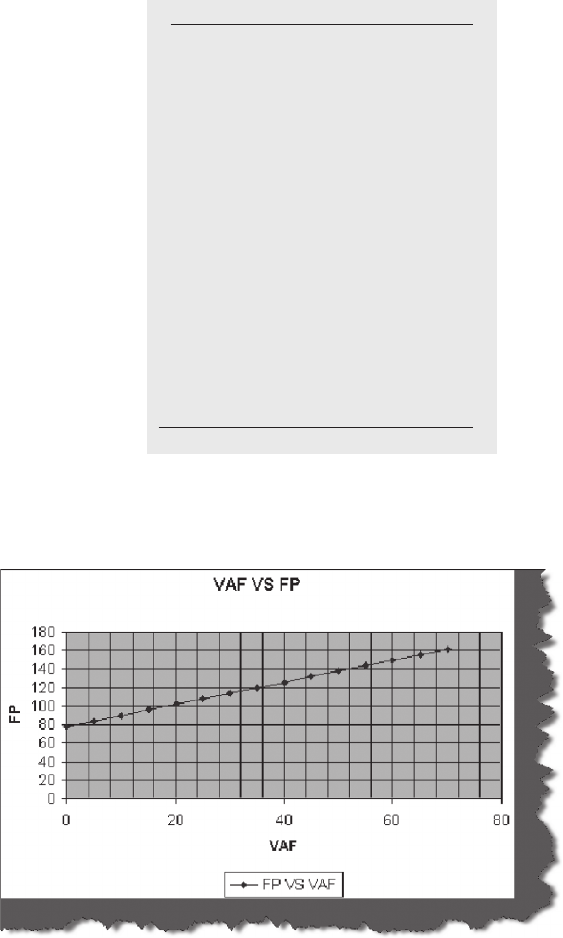
as units of measurement, but they also use UAFP rather than AFP. Let’s do
a small experiment to view the relationships between FP, AFP, GSC, and
VAF. In this experiment we will assume UAFP
5 120 and then lot graph
with GSC in increments of five. So the formula is
VAF
5 0.65 1 (GS/100).
Here’s the table with the values in the formula plotted.
format. Every company has its own quotation format. http://www.microsoft.
com/mac/resources/templates.aspx?pid5templates has a good collection of
decent templates.
Table 36 Final bill
XYZ SOFTWARE COMPANY
To:
TNC Limited, Western road 17, California.
Quotation number: 90
Date: 1/1/2004
Customer ID: Z- 20090DATAENTRY
Quantity Description Discount Taxable Total
1 Customer Project 0% 0% $318.00
Quotation Valid for 100 days
Goods delivery date within 25 days of half payment
Quotation prepared by: XYZ estimation department
Approved by: SPEG department XYZ
teSting eStimation 177
FP GSC
78 0
84 5
90 10
96 15
102 20
108 25
114 30
120 35
126 40
132 45
138 50
144 55
150 60
156 65
162 70
Table 37 GSC acceptance
FIGURE 158 FP versus VAF

178 Software teSting interview QueStionS
The following are the observations from the table and plot:
The graph is linear. It also captures that the nature of
complexity is linear.
If the GSC value is zero then the VAF is 0.65. So the graph starts
from UAFP
* 0.65.GSC 5 35 AFP 5 UAFP. So the VAF 5 1.
When GSC
, 35 then AFP . UAFP. That means complexity
decreases.
When GSC
. 35 then AFP . UAFP. That means complexity
increases.
Readers must be wondering why 0.65? There are 14 GSC factors from
zero to five. So the maximum value of VAF
5 0.65 1 (70/100) 5 1.35. So that
VAF does not have any affect, i.e., UAFP = FP, the VAF should be one. The
VAF will be one when the GSC is 35, i.e., half of 70. So, in order to complete
value “1”, value “0.65” is taken. Note that the value is 0.35 when the GSC is
35, to complete the one factor, “0.65” is required.
But the following is the main problem related to the GSCs. The GSCs
are applied throughout FPs even when some GSCs do not apply to whole
function points. Here’s the example to demonstrate the GSC problem.
Let’s take the 11th GSC factor “installation ease.” The project is of 100
UAFP and there is no consideration of the installation done previously by the
client so the 11th factor is zero.
n
n
n
n
GSC with installation easewith ZERO
GSC Value (0–5)
Data communications 1
Distributed data processing 1
Performance 4
Heavily used configuration 0
Transaction rate 1
Online data entry 0
End-user efficiency 4
Online update 0
Complex processing 0
continued

teSting eStimation 179
GSC with installation easewith 5
GSC Value (0–5)
Data communications 1
Distributed data processing 1
Performance 4
Heavily used configuration 0
Transaction rate 1
Online data entry 0
End-user efficiency 4
Online update 0
Complex processing 0
Reusability 3
Installation ease 5
Operational ease 4
Multiple sites 0
Facilitate change 0
Total 23
Table 39 GSC with installation ease 5
VAF 5 0.65 1 (18/100) 5 0.83. So the FPs 5 100 * 0.83 5 83 function
points. But later the client demanded a full-blown installation for the project
with auto updating when the new version is released. So we change the
installation ease to 5.
GSC Value (0–5)
Reusability 3
Installation ease 0
Operational ease 4
Multiple sites 0
Facilitate change 0
Total 18
Table 39 GSC with installation ease zero
..................Content has been hidden....................
You can't read the all page of ebook, please click here login for view all page.