
Six Sigma 109
(i) What are the different kinds of variations used
in six sigma?
Variation is the basis of Six Sigma. It defines how many changes are happening
in the output of a process. So if a process is improved then this should reduce
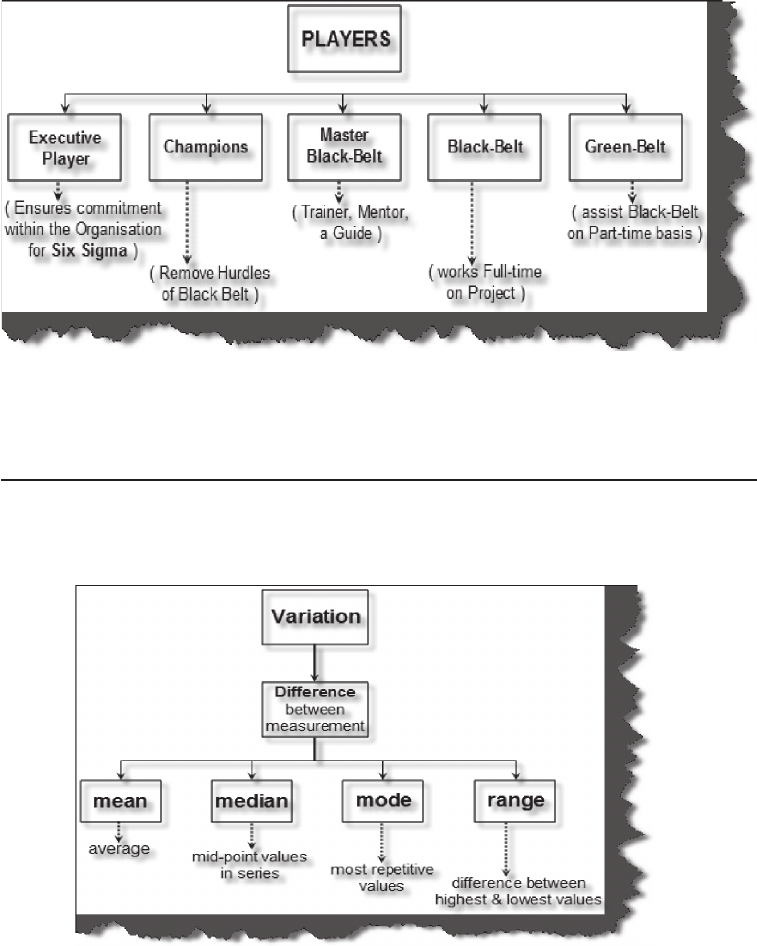
Figure 99 Six Sigma key players
Figure 100 Different variations in Six Sigma

110 Software teSting interview QueStionS
Figure 101 Measuring variations using mean
variations. In Six Sigma we identify variations in the process, control them, and
reduce or eliminate defects. Now let’s discuss how we can measure variations.
There are four basic ways of measuring variations: Mean, Median, Mode, and
Range. Let’s discuss each of these variations in more depth for better analysis.
Mean: In the mean measurement the variations are measured and compared
using averaging techniques. For instance, you can see from the following figures
which shows two weekly measures, how many computers are manufactured.
We have tracked two weeks; one we have named Week 1 and the other Week
2. So to calculate variation using mean we calculate the mean of Week 1 and
Week 2. You can see from the calculations in the following figure we have
5.083 for Week 1 and 2.85 for Week 2. So we have a variation of 2.23.
Median: Median value is a mid-point in our range of data. The mid-point
can be found by finding the difference between the highest and lowest value
and then dividing it by two and, finally, adding the lowest value to it. For
instance, for the following figure in Week 1 we have 4 as the lowest value
and 7 as the highest value. So first we subtract the lowest value from the
highest value, i.e., 7 2 4. Then we divide it by two and add the lowest value.
So for Week 1 the median is 5.5 and for Week 2 the median is 2.9. So the
variation is 5.5-2.9.

Six Sigma 111
Range: Range is nothing but the spread of values for a particular data
range. In short, it is the difference between the highest and lowest values in
a particular data range. For instance, you can see for the recorded computer
data of Week 2 we have found the range of values by subtracting the highest
value from the lowest.
Figure 102 Median for calculating variations
Figure 103 Range for calculating variations
..................Content has been hidden....................
You can't read the all page of ebook, please click here login for view all page.