3.2 Unified Evolving Network Model: Reproduction of Heterogeneous Connectivity, Hierarchical Modularity, and Disassortativity
As mentioned above, several remarkable structural properties have thus far been characterized in biological networks via network analysis.
A well-known feature of networks is heterogeneous connectivity, which indicates that the node degree k (the number of edges that the node has) approximately follows a power–law distribution: P(k) ∝ k−γ. The exponent γ, called the “degree exponent,” is empirically known to be between 2 and 3. This power–law degree distribution implies that a few nodes (hubs) integrate numerous nodes while most of the remaining nodes do not; this feature is clearly different from that of the Poisson (homogeneous) distribution obtained from classical (ER) random networks. To reproduce heterogeneous connectivity, the BA model was proposed. This model has two mechanisms: the growth mechanism, in which an added node connects to existing nodes, and the preferential attachment (PA) mechanism, in which the existing node i is selected with the probability Πi = ki/∑ jkj, where ki is the degree (the number of edges) of node i. The BA model generates heterogeneous networks with the power–law degree distribution P(k) ∝ k−3 [12].
The other structural property of networks is hierarchical modularity. Most real-world networks are clustered; this is characterized by the clustering coefficient C. The clustering coefficient of node i (Ci) is defined as 2Mi/[ki(ki − 1)], where Mi is the number of edges among the neighboring nodes of node i. In real-world networks, there exists a power–law relationship between Ci and ki with the exponent −1, that is, ![]() ; the ER model and the BA model do not represent this relationship because the network is randomly constructed with a given degree sequence. This power–law relationship is reproduced by the hierarchical organization of modules (small dense networks) [13]; thus, it is referred to as hierarchical modularity. Furthermore, the triad formation [14] and the merging module [15] also reproduce this property. Although there are several models, the most important aspect is the proportional relationship between the degree of node i and the number of modules including node i (the number of edges among the neighbors of node i).
; the ER model and the BA model do not represent this relationship because the network is randomly constructed with a given degree sequence. This power–law relationship is reproduced by the hierarchical organization of modules (small dense networks) [13]; thus, it is referred to as hierarchical modularity. Furthermore, the triad formation [14] and the merging module [15] also reproduce this property. Although there are several models, the most important aspect is the proportional relationship between the degree of node i and the number of modules including node i (the number of edges among the neighbors of node i).
In addition, disassortativity [16] is also a well-known property. The correlation of the degree between a node and its neighboring node (hereafter referred to as “degree correlation”) is useful for explaining disassortativity. Disassortativity indicates negative degree correlations. The ER model and the BA model indicate no such correlation because their networks are randomly constructed. In such a random network with a given degree sequence, the probability of transition from nodes with degree k to nodes with degree k ', P(k ' |k), is k ' P(k ')N/(2E) [17]. Thus, the expected degree of neighboring nodes is ∑k'k ' P(k ' |k) =![]() k2
k2![]() /
/![]() k
k![]() , where
, where ![]()
![]()
![]() denotes the average over all nodes. This result indicates that the degree correlation is independent of degree k (i.e., there is no correlation).
denotes the average over all nodes. This result indicates that the degree correlation is independent of degree k (i.e., there is no correlation).
This is particularly caused in the BA model due to the preferential attachment in which a node (node i) gets new edges with the probability Πi that is proportional to its own degree, that is, Πi = ki/∑ jkj. Due to this preferential attachment, the transition probability is almost similar to the above equation.
We cannot neglect preferential attachment because this mechanism provides heterogeneous connectivity. To solve this problem, we need to consider information other than the degree. This information is based on studies on competition dynamics [18] and weighted networks [19,20], which discuss the effects of fitness on a network structure. Here, we also refer to this information as fitness. By considering this information, the networks have negative degree correlations [21,22].
As mentioned above, these different structural properties are explained by different models; thus, the theory for network evolution is complicated. For a simple understanding of this theory, we need to construct a new convenient model that includes several models. In this section, we introduce a simple unified model for reproducing heterogeneous connectivity, hierarchical modularity, and disassortativity.
3.2.1 Network Model
Our model includes growth by merging modules and the fitness-driven (FD) mechanism (see Ref. 23 for biological implications of this model).
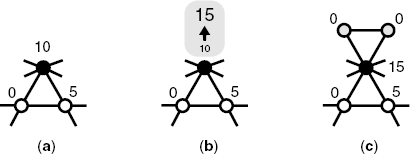
Figure 3.2 Schematic diagram of the growth process of our model network with a = 3, m = 1, and ξ = 5. (a) Selection of node(s) by the FD–PA mechanism, Equation 3.1. The filled node is selected by the FD–PA mechanism. Each number in the figure indicates the fitness of a corresponding node. (b) Updating of the fitness. The selected node's fitness increases according to the updating rule, Equation 3.2. (c) Merging new modules. As a result, (a − m) new node(s) are added and filled with gray, their initial fitness is considered as zero.
Taken together, our model networks are generated by the following procedures.
When a > m and ξ ≥ 0, the model network evolves in time steps. In addition, our model is equivalent to the BA model with the specific condition: a = 2, m = 1, and ξ = 0.
3.2.2 Degree Distribution
In this section, we present the analytical and numerical solutions for the degree distribution of our model.
In order to describe the degree distribution, we employ the mean-field-based analysis [12,22]. The standard approach cannot be directly applied due to the inclusion of the fitness updating. We express the degree and fitness as
(3.3) ![]()
and investigate the time evolution of Fi. Since the fitness updating rule is represented as fi ← fi + ξ, Fi satisfies
indicating the proportional relationship between Fi and ki.
The time evolution of Fi is described as
where ∑jFj ≈ [a(a − 1) + mξ]t. The solution of the equation with ![]() as an initial condition for Equation 3.5 is
as an initial condition for Equation 3.5 is
where β = [m(a − 1 + ξ)]/[a(a − 1) + mξ]. Because s/t denotes the probability that Fi is larger than a given F, Equation 3.6 is rewritten as
which corresponds to a cumulative probability. From Equation 3.7, the probability distribution for F is given as
where γ = (1/β) + 1. Finally, substituting Equation 3.4 into Equation 3.8, we obtain the degree distribution
(3.9) ![]()
where B(a, ξ, γ) = A(a, ξ)γ−1[ξ/(a − 1) + 1]−γ/(γ − 1). The degree distribution obeys the power law with the degree exponent
demonstrating that our model network contains the scale-free feature.
In order to confirm the analytical predictions, we performed numerical simulations of networks, generated using our model. Figure 3.3 shows degree distributions with a = 5, N = 50, 000, and different values of m ![]() [1, 4] and ξ
[1, 4] and ξ ![]() [0, 15]. These degree distributions follow the power law, reflecting the scale-free feature.
[0, 15]. These degree distributions follow the power law, reflecting the scale-free feature.
Figure 3.3 Degree distributions P(k) with a = 5 and N = 50, 000 (shifted for clarity). Different symbols correspond to different numerical results. Solid lines represent the relationship P(k) ∝ k−γ, where γ is predicted by Equation 3.10. (a) ξ dependency with m = 2. (b) m/a dependency with ξ = 7.
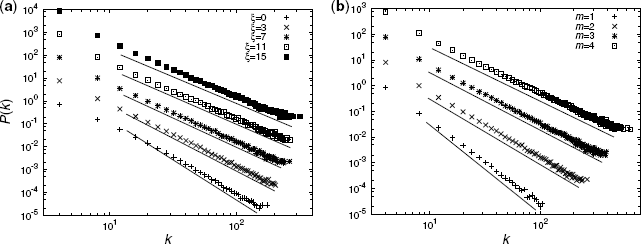
Figure 3.3a shows the degree distributions with m = 2 and different values of ξ. The degree exponents decay with increasing ξ. Figure 3.3b shows the degree distributions with ξ = 7 and different values of m. The degree exponents decay with increasing m. The numerical results and theoretical predictions are in excellent agreement, demonstrating that γ is a function of m/a and ξ.
3.2.3 Degree-Dependent Clustering Coefficient
In this section, we show the analytical and numerical solutions of the degree-dependent clustering coefficient.
First, we provide the analytical solution for the degree-dependent clustering coefficient of our model. Since our model grows due to the merging of modules (see Fig. 3.2), the number of edges among neighbors of node i is approximately described [15] as
where Si corresponds to the number of selections of node i with the PA, as in Equation 3.1. In our model, because the degree of node i is expressed as ki = Si(a − 1), Equation 3.11 is rewritten as
indicating the proportional relationship between Mi and ki. Finally, substituting Equation (3.12) into the definition of the clustering coefficient (i.e., Ci = 2Mi/[ki(ki − 1)]), we obtain the degree-dependent clustering coefficient
(3.13) ![]()
The degree-dependent clustering coefficient follows the power law with the exponent −1 when a ≥ 3, reflecting the hierarchical modularity of our model network.
Next, we present the numerical results of the degree-dependent clustering coefficient of our model in order to verify the analytical solution. In Figure 3.4, we show the degree-dependent clustering coefficient with a = 5, N = 50, 000, and different values of m ![]() [1, 4] and ξ
[1, 4] and ξ ![]() [0, 15].
[0, 15].
Figure 3.4 Degree-dependent cluster coefficient C(k) with a = 5 and N = 50, 000. Different symbols correspond to the different numerical results. Solid lines represent the relationship ∝k−1. (a) ξ dependency with m = 2. (b) m dependency with ξ = 7.
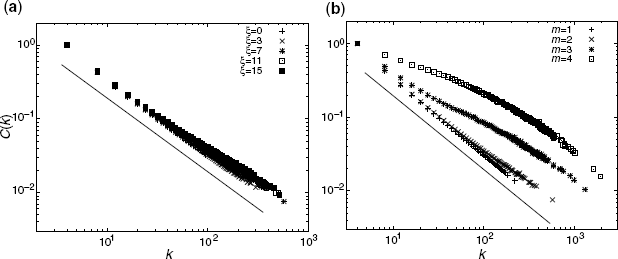
Figure 3.4a shows the degree-dependent clustering coefficient with m = 2 and different values of ξ. C(k) follows the power law with the exponent −1 despite the varying ξ values. Figure 3.4b shows degree-dependent clustering with ξ = 7 and different m values. Moreover, C(k) follows the power law with the exponent −1 for a large value of k. For a small value of k, the cut-off becomes more prominent with increasing m as it moves further away from the approximation of Equation 3.11.
The degree-dependent clustering coefficient follows the power law with the exponent more or less equal to −1, reflecting the hierarchical modularity of networks.
3.2.4 Average Clustering Coefficient
To examine the parameter-dependency of the modularity (clustering property) for the entire network, we employ an average clustering coefficient C. The coefficient is defined as ![]() . A high value of C implies that the network has high modularity.
. A high value of C implies that the network has high modularity.
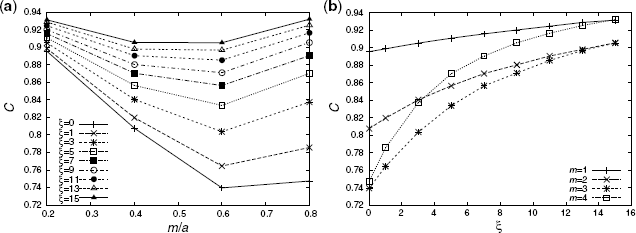
Figure 3.5 shows the numerical result of C in our model network with a = 5, N = 12, 800, and different values of m ![]() [1, 4] and ξ
[1, 4] and ξ ![]() [0, 15]. C tends to increase by a greater extent for smaller m/a and larger ξ. Since the small and large m/a lead to different effects on C, Figure 3.5a shows a valley in the middle of m/a. In the case of small m/a, C can remain high because the modules combine via a few common nodes. In contrast, in the case of large m/a, C is low because the networks tend to be randomized, which is due to the fact that the modules combine via many common nodes. In this case, however, the FD mechanism helps to increase the fitness of the nodes in the modules, inducing the formation of a cluster with high-edge density. As a result, C increases with m/a. Due to the trade-off mechanism, a valley-shaped curve is obtained. In addition, C is less sensitive for large ξ.
[0, 15]. C tends to increase by a greater extent for smaller m/a and larger ξ. Since the small and large m/a lead to different effects on C, Figure 3.5a shows a valley in the middle of m/a. In the case of small m/a, C can remain high because the modules combine via a few common nodes. In contrast, in the case of large m/a, C is low because the networks tend to be randomized, which is due to the fact that the modules combine via many common nodes. In this case, however, the FD mechanism helps to increase the fitness of the nodes in the modules, inducing the formation of a cluster with high-edge density. As a result, C increases with m/a. Due to the trade-off mechanism, a valley-shaped curve is obtained. In addition, C is less sensitive for large ξ.
Figure 3.5 The dependency of the average clustering coefficient C (a = 5 and N = 12, 800) on the parameter (a) m/a and (b) ξ.
3.2.5 Degree Correlation
The degree correlation is a structural property that characterizes assortativity of the networks and represents the average degree of the neighbors of nodes with degree k. This correlation is defined as
(3.14) ![]()
where δ(x) is Kronecker's delta function. This function returns 1 when x = 0 and returns 0 otherwise. Γi denotes the average nearest-neighbor degree and is expressed as
(3.15) ![]()
where V(i) corresponds to the set of neighbors of node i.
Here, we provide the numerical solutions for the degree correlation of our model. Figure 3.6 shows the degree–degree correlations with a = 5, N = 50, 000, and different values of m and ξ. The correlations follow the power law; ![]() with −1 < ν < 0 as a rough observation. Negative and larger values of ν are observed for larger m/a and ξ.
with −1 < ν < 0 as a rough observation. Negative and larger values of ν are observed for larger m/a and ξ.
Figure 3.6 Degree correlations ![]() with a = 5 and N = 50, 000. (a) ξ dependency with m = 2. The solid and dashed lines correspond to ∝k−0.3 and ∝k0.2, respectively. (b) m dependency with ξ = 7. The solid line represents the relationship ∝k−0.8.
with a = 5 and N = 50, 000. (a) ξ dependency with m = 2. The solid and dashed lines correspond to ∝k−0.3 and ∝k0.2, respectively. (b) m dependency with ξ = 7. The solid line represents the relationship ∝k−0.8.
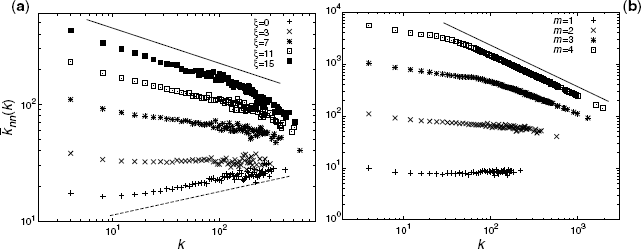
Figure 3.6a shows the degree correlations with m = 2 and different ξ values. The exponent ν decays with increasing ξ. Figure 3.6b shows the degree–degree correlations with ξ = 7 and different m values. The exponent ν decays with increasing m.
Due to the fitness updating and the PA mechanism, the degree correlations follow the power law, reflecting the disassortativity of the networks. As previously reported, disassortativity is not reproduced if we only consider the PA mechanism [15,21].
3.2.6 Assortative Coefficient
The assortative coefficient (AC) [16] can be considered to be a compendium parameter of the degree correlations and is defined as
(3.16) ![]()
where ki and kj are the degrees of two nodes at the ends of an edge and ![]()
![]()
![]() denotes the average over all edges. In other words, the AC is the correlation coefficient for the degree correlation
denotes the average over all edges. In other words, the AC is the correlation coefficient for the degree correlation ![]() and takes the values −1 ≤ r ≤ 1. The relationship between the AC and the network structures is described as follows:
and takes the values −1 ≤ r ≤ 1. The relationship between the AC and the network structures is described as follows:
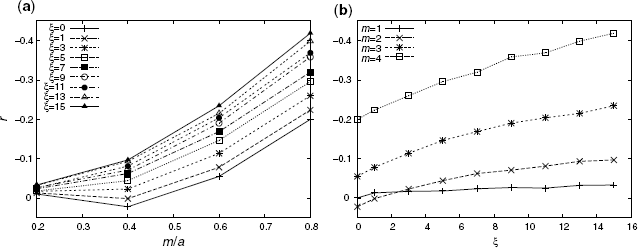
Figure 3.7 shows the numerical solutions of the AC for our model with a = 5, N = 12, 800, and different values of m ![]() [1, 4] and ξ
[1, 4] and ξ ![]() [0, 15]. For larger m/a and ξ values, the large negative AC is generally observed. For smaller ξ
[0, 15]. For larger m/a and ξ values, the large negative AC is generally observed. For smaller ξ ![]() [0, 1], on the other hand, the valley-shaped curves (once, r takes positive instead of negative values) emerge because positive degree correlations are exhibited in the case of m/a ≤ 0.5 [15]. For larger ξ
[0, 1], on the other hand, the valley-shaped curves (once, r takes positive instead of negative values) emerge because positive degree correlations are exhibited in the case of m/a ≤ 0.5 [15]. For larger ξ ![]() [3, 15], assortative coefficients r monotonically decrease (upward curve) with increasing m/a.
[3, 15], assortative coefficients r monotonically decrease (upward curve) with increasing m/a.
Figure 3.7 Assortative coefficient r with a = 5 and N = 12, 800. The dependency on the parameter m/a (a) and ξ (b). The vertical axes of (a) and (b) are inverted for clarity.
3.2.7 Comparison with Real Data
In order to validate our model, we compare the structural properties of biological networks with those of our model networks. We construct two different types of networks: the gene regulatory [24] and the metabolic [25] networks of E. coli. The gene regulatory network is represented as a set of graphs consisting of nodes and edges, which correspond to genes and the interactions among genes, respectively. For simplicity, we extract the largest component from the networks and replace the directed and/or weighted edges with undirected and/or unweighted edges. Moreover, we remove the multiple edges and self-loops. The metabolic network is transformed by the same procedures.
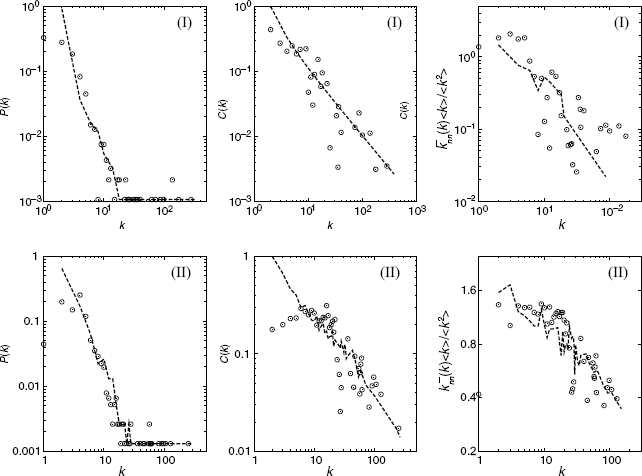
In Figure 3.8, we show the structural properties of the biological networks and our model networks. Our model is found to be in good agreement with the data of the real network, demonstrating that our model reproduces the three previously mentioned remarkable structural properties that are widely shared among biological networks.
Figure 3.8 Comparison between structural properties of biological networks and those of model networks. The left column shows the degree distributions, P(k). Degree-dependent clustering coefficients C(k) are in the middle column. Degree–degree correlations ![]() constitute the right column. These degree–degree correlations are divided by
constitute the right column. These degree–degree correlations are divided by ![]() k2
k2![]() /
/![]() k
k ![]() for normalization. The symbols and dashed lines denote the data of biological networks and our model networks, respectively. (I) Gene regulatory network in E. coli [24] and our model with a = 3, m = 1, and ξ = 20. (II) Metabolic networks in E. coli [25] and our model with a = 3, m = 2, and ξ = 1. The size of the model network is the same as the total number of nodes of the biological network. The parameters a, m, and ξ are determined by minimizing the distributional distance, which corresponds to the Kolmogorov–Smirnov statistics (distances) for degree distributions between the predicted distributions and the empirical distributions.
for normalization. The symbols and dashed lines denote the data of biological networks and our model networks, respectively. (I) Gene regulatory network in E. coli [24] and our model with a = 3, m = 1, and ξ = 20. (II) Metabolic networks in E. coli [25] and our model with a = 3, m = 2, and ξ = 1. The size of the model network is the same as the total number of nodes of the biological network. The parameters a, m, and ξ are determined by minimizing the distributional distance, which corresponds to the Kolmogorov–Smirnov statistics (distances) for degree distributions between the predicted distributions and the empirical distributions.