PART 3
DEVLOPING A TRADING SYSTEM
Designing a Trading System That Fits You
Jack Schwager’s primary conclusion in the first two Market Wizard books is that all great traders develop systems that fit who they are. I tend to agree that this is one of the secrets to success. Here are some of the criteria you might want to think about in designing a system that fits you.

Systems, Like Pants, Should Fit You
1. You need to know who you are. How can you design something that fits you if you don’t know who you are?
2. Once you know who you are, you can determine your objectives and design a system to fit those objectives.
3. What are your beliefs about the big picture, and to what extent must your system be able to fit those beliefs? For example, if you believe that the U.S. dollar is doomed to collapse over the next 5 to 10 years, how will that affect your thoughts about developing a trading system? If you believe we are in a long-term bear market, how will that affect your thoughts about trading systems? And will you be able to trade well even if you are wrong about the big picture?
4. You can trade only your beliefs about the market, and so you need to understand what those beliefs are. What specifically do you believe about the market, and how does that give you an edge? When you understand these criteria, you can design a specific system with which you are comfortable.
Let’s take a look at an example of a belief. Suppose you believe that markets are not really random because there are big trends that don’t fit the price movements you’d expect in random markets. You perhaps believe that the best way to make money in the markets is to find and capitalize on those trends. If this were your primary belief, do you think you could do the following:
• Buy things that are out of favor, things that nobody likes? Probably not because this doesn’t fit the primary belief that you believe gives you an edge.
• Sell high and buy low the way a band trader is likely to do? Probably not because that is a very different mentality.
I could give lots of examples of beliefs and lots of examples of things that might be hard for you to do because they don’t fit those beliefs. I hope you’ve gotten the idea by now. You must determine what you believe about the markets that will give you an edge because you can trade something easily only if it fits your beliefs.
5. Next you must understand the various parts of a system and the beliefs that you have about each of those parts. For example, what do you believe about setups, entries, stops, profit taking, and position sizing strategies? Again, you can comfortably trade only your beliefs. For example, suppose you want to catch trends but believe in tight stops. This means that you easily could get whipsawed in and out of trades a lot but that when you do catch a big trend, your total reward will be many times your initial risk.
6. One of my beliefs is that a trading system is characterized by the distribution of R multiples that it generates. R refers to the initial risk in a trade, and R multiples refers to the profits and losses expressed as a ratio of that initial risk. We’ll discuss what that means in much more detail shortly. The distribution of your R-multiple trade results will have a mean and a standard deviation that tell you a lot about how easy it is to trade your system. Thus, you must decide what kind of mean and variability a system’s R-multiple distribution must have in order for you to be willing to trade that system.
7. You also must also ask yourself, “What other criteria must my system meet for me to be able to trade it comfortably?” Although I can give you lots of suggestions, this is still a matter of personal comfort and a big part of developing a system that fits you. Here are some sample criteria:
• Does the system fit my beliefs?
• Do I really understand how the system works?
• Do I understand how the system will perform in various market types?
• Do I trust my initial testing of the system?
• Do I feel good about trading it? Do I feel confident that I can trade it easily in my schedule without making any mistakes?
8. You also must ask yourself, “How can I use position sizing strategies to meet my objectives, and what is the probability, given the system’s R-multiple distribution, that I will be able to do that?” If you have an accurate sample of R multiples, you can probably answer this question through simulations.
Finally, you must ask yourself what you will do to make sure your system fits all these criteria well enough for you to be comfortable trading it. If it doesn’t meet some of your criteria that well, what will you do to make it fit? Or will you change your criteria?
Trading Concepts
There are many different types of traders, and one way to classify them is by the basic concept that they trade. Some concepts are diametrically opposed (for example, trend following versus band trading), but you can trade any of them if you believe in it enough and practice low-risk ideas.
• Trend following. The basic idea here is that you buy what’s clearly going up and sell it when it stops going up. Similarly, you sell short what’s clearly going down and buy it back when it stops going down. The key to doing this is to have a method by which you define when to enter and exit that gives you low-risk trades.
• Fundamental market analysis. The basic idea here is based on the supply-and-demand concept in economics. You need to analyze the market to find out where demand may exist and buy there (ideally, before it occurs). When you think the price is high enough that demand may drop off, you sell. You could assume that when the supply is low, demand will increase and start the market moving, but that isn’t always the case. Let me give you an example in an area that I know well: rare U.S. stamps. Certain nineteenth-century stamps were issued in a very limited supply, and fewer than 100 are known to exist today. However, there isn’t much demand for these stamps, and so the prices are pretty reasonable. However, if just 50 collectors were willing to spend $100,000 on very rare U.S. nineteenth-century stamps, the prices would go up 10-fold or more.
• Value trading. You buy things that are way undervalued, assuming that one day the market will catch up with their value. There are probably thousands of ways to value stocks, and some are more useful than others. If you decide you like value trading, your job is to find one of the more useful methods.
• Band trading. Certain instruments (stocks, commodities, and currencies) trade in bands. You buy something when it touches, crosses, or gets close to the lower band and sell it when it does the same thing for the upper band. It doesn’t matter which order you do this in. The key to band trading is to understand how to develop useful bands.
• Seasonal tendencies. Perhaps the real key to understanding seasonal tendencies is that what you find must have a fundamental basis for its existence. You can always use a computer to find meaningless correlations. For instance, say you buy XYZ in the last week in March because it went up for the next three days in 18 of the last 20 years. That could easily be a statistical fluke. What you are looking for is something like this: the stock market tends to go up between November and May because pension money tends to pour into the market during that period.
• Spreading. This really gets into the realm of the professional traders who can create long and short positions with a lot of potential to move but with a much lower risk profile. For example, you can buy a December option and short the March option. You can buy one currency and short another. These are common practices among professionals who can do large trades very cheaply.
• Arbitrage (practiced primarily by professionals). Here you find a loophole in the way things are done that gives you a huge edge. For example, before currency trading was available, one of my clients discovered that he could buy sugar in London in sterling and buy it in New York in dollars. He would spread the two markets to trade the dollar-sterling relationship, and he was the only one doing that. He said that in those days he’d have to unload one of his spreads if anyone wanted to trade sugar. Of course, this situation didn’t last too long because people figured out what he was doing, but while it lasted, he said, it was like taking candy from a baby. The secret to arbitrage, of course, is to be able to find the loopholes and figure out how to capitalize on them.
• Intermarket analysis. Here we make the assumption that the price of one commodity (or product) is a function of what many other commodities are doing at the same time. It’s not just a simple relationship among a few things. Thus, gold may be related to the price of oil, silver, the dollar, and a number of other currencies. These relationships change over time. Thus, the key to trading this concept is to evaluate a number of different inputs simultaneously to find the relationships that currently exist. Of course, this just lets you know the current relationship; you then have to use the key low-risk concepts common to all systems to make money from the relationship.
• There is an order to the universe. Here there are a number of subconcepts, including (1) waves of human emotion, (2) physical events that may influence human behavior, and (3) a mathematical order to the universe. All these concepts can be traded if they fit you and you use the appropriate low-risk techniques.
All these concepts describe the reasoning for trade setups that one might look for in the market. Setups are a small part of trading, but because people think that picking the right investment is so important, these types of concepts were developed. Trading styles actually are named after the setups.
Setups Are Not as Important as You Think
I noticed at the beginning of my career as a trading coach that when people talked about a trading system, they really were talking about the setup to a system. Setups are a very small part of what is necessary for a complete trading system, yet people still claim their setup conditions are their systems.
When you see the setups in a stock, you have an increased probability that the stock will go up. But it is through position sizing strategies and managing the ratio of reward to risk throughout the trade that produces the great profits in the trade.
Let’s look at one of the most famous systems around: William O’Neil’s CANSLIM system. What is CANSLIM? It’s an acronym for O’Neil’s setups: Current quarterly earnings; Annual earnings increases; New product, new management; Supply and demand; Leader or laggard; Institutional sponsorship; and Market direction. When people talk about CANSLIM, they mostly discuss what each of the letters stands for in some detail. However, the CANSLIM setups, in my opinion, are the least important aspect of what makes that system successful or unsuccessful.
The following is a brief discussion of some of the setups you might want to consider:
1. Failed test setups. These setups occur when the market wants to test some area. For example, the Turtles used to trade 20-day breakouts, and so a 20-day high is considered a test area, and its failure to continue is what might be called a failed test setup.
2. Climax reversal setups. Here the price goes parabolic to a new high and then falls. These setups are often the start of big moves in the opposite direction.
3. Retracement setups (often used by trend followers). Here the market is identified as being in a clear trend (the first part of the setup), then it reverses for a short while (the second part of the setup), and then the trend continues.
4. Time setups. These occur when you think that some move is due at a particular period as a result of some “mysterious order to the universe” concept. If you have one of these, the time at which the setup is about to occur might be considered the setup.
5. Price-data-in-sequence setups. I gave an example of this in the description of the retracement setup above, but there are many different kinds.
6. Fundamental data setups. For example, an analyst may conclude that there is pent-up demand for a commodity. Demand usually means there is a potential for the price to rise, and so the decision that demand is rising might be considered a setup.
7. Volume data setups. For example, the Arms Index, which involves volume data, might be considered a setup.
8. Component data setups. If you are trading an index such as the S&P 500, you could find important information that suggests a move by looking at what some of the individual stocks are doing. That’s just one example of component data.
9. Volatility setups. When volatility contracts extensively, it’s often comparable to a spring waiting to uncoil and thus could be considered a setup.
10. Volatility breakouts. When volatility is suddenly very large, it usually signals the end of a move or the beginning of a new move in the opposite direction.
11. Business fundamentals setups. Value investors have different ways to determine when a stock is undervalued, and that usually is a setup for them to buy. Warren Buffett has a number of business fundamentals that he reviews about each stock before he buys. These are all examples of what might be called business fundamentals setups.
12. Overbought or oversold setups. When the market is overbought in the short term, swing traders sometimes get a good short-term high reward-to-risk short trade. Similarly, when the market is oversold, they often get a good short-term high reward-to-risk long trade.
Entering the Market
Tom Basso and I were giving a systems workshop, but we were emphasizing the importance of psychology, exits, and position sizing strategies. Someone in the workshop said, “I suppose you could make money with just a random entry.” Tom said he hadn’t thought about that, but he went home and tested his exits and his position sizing method with a random entry system, and sure enough, it made money.
I was fascinated by the idea and decided to prove it for myself. I designed a system that traded 10 commodities over a 10-year period from 1983 to 1992. It was always in the market on all 10 positions. When it exited, it needed to reenter immediately long or short on the basis of a coin flip. My exit was three times the average true range of the last 20 days, and I risked 1% of my million-dollar account per position. It required a million-dollar account to always be in the market in 10 futures positions. I also added in $100 for slippage and commissions for each position, and so I had to overcome a huge amount of costs plus random entry.
With random entry, you are giving up any advantage that a particular entry has. The only way you can make money is to catch a strong trend occasionally and make sure that your losses are not too big and that you practice proper position sizing strategies.
My results agreed with Tom Basso’s: the method made money consistently. It didn’t make a lot of money, and you would have to live through some nasty drawdowns, but over the 10 years it made money.
Why do people make a fuss about entry? I touched on this in talking about setups. People are brainwashed to think investment or trading success is all about picking the right stock. It’s not!
Let me tell you about the first stock I bought when I was 16. I found the stock that had the highest per-share earnings growth the prior year according to the 1961 review of the year by Fortune magazine. Thus, there was some research involved in my decision but no particular entry. Once I discovered it, I bought 100 shares for $800. That was my entry. I then watched it go up to $20 per share and then go back down again. Eventually it went to zero. My understanding is that a lot of people go through this sort of experience.

People Are Brainwashed to Think That Success Is Picking the Right Stock
You could say that I bought the wrong stock. I could have bought Microsoft or Berkshire Hathaway in their infancy and made a fortune with my $800. However, for every stock like that, there are a thousand that eventually disappear, including many Fortune 500 companies. I basically ignored every important rule that I now teach people simply because I thought that to be successful I just had to pick the right stock. I could have had a 25% trailing stop. In that case, my initial risk would have been $200 (a 25% drop). When the stock reached $20, a 25% trailing stop would have had me sell at $15. I would have made $700 for a 3.5R profit. I didn’t pick the wrong stock. I just didn’t understand the rules for making money.
Let me repeat that statement: Success is not about picking the right stock. Of the original 30 Dow Jones Industrials, only one remained in 2009: General Electric. Most were dropped from the index, went bankrupt, or were absorbed by another company. That eventually happens to most companies. Picking the right stock and holding it until you die is not the magic formula for success unless you are very, very lucky.
However, today many, many people have this sort of bias. They are looking to pick the right stock and figure out how and when to buy it. For those of you with that interest, Chapter 9 of the second edition of Trade Your Way to Financial Freedom has everything you need to know about entry.
I discuss channel breakouts, moving averages, pattern recognition, prediction, volatility breakouts, oscillators, and more because so many different entry signals have been developed over the years. The key is to make sure you don’t think it’s the most important part of your trading, because it isn’t. As we’ve already proved, you can make money trading with a random entry.
The Source of the Stock Selection Myth
Since most people believe that stock selection is the key to making money, I’d like to share with you the source of that myth: mutual funds.
Mutual funds by charter are supposed to be fully invested. Furthermore, their job is not to make money but to outperform the market, which most of them cannot do. They cannot outperform the market because they generally invest in their benchmark index (for example, the S&P 500) and charge you fees to manage your money.

Let Profits Run
If you must be fully invested, you cannot really practice position sizing strategies or proper risk control. Even asset allocation, which is actually a position sizing method, seems like an exercise in deciding which assets to invest in at any specific time.
Mutual funds, by the way, don’t get paid for performance; they get paid by the amount of assets they manage. In other words, they get paid if they keep your money.
When the market goes up, most funds make money and most people are happy to be a little richer. The fund managers go on CNBC and talk about which stocks they like.
When the markets go down, most funds lose money.
Most people don’t understand that the best traders get out of mutual funds and become hedge fund managers so that they can really trade. Very little of what hedge fund managers do involves stock selection. It has to do with cutting losses short, letting profits run, and practicing proper position sizing strategies to meet their objectives.
Improving on Random Entry
For swing and day trading, measures of being oversold or over-bought are pretty good setups. One of the better oversold reactions is five days down. When the market or a stock has been down five straight days, it is due for an upward correction. However, the ideal entry is when you get some movement in your favor and can set up a high reward-to-risk trade. When the stock makes a new high (or perhaps, if you want more confidence, three new highs—could be hourly or daily bars), you would set your stop just below your swing low. This would be your initial risk or 1R.
Ashton Dorkins and Larry Connors1 found that stocks that closed down for five consecutive days outperformed a benchmark index by 0.63% a week later, which suggests some edge for such a setup. This would improve further if the stocks were above the 200-day moving average. Of course, they had no stop; these stocks might lose much of their edge with a stop. But what if you have a profit target such as the prior high before it started going five days down? How many points of movement is that away from your entry?
Figure 3-1 shows such an entry at $61.60 at the close, after an even better setup of six days down, in which the initial risk (to the prior day’s low) is about 90 cents. The potential reward is the high seven days ago of $67. So there is a potential gain of $5.40. Thus, the reward-to-risk ratio of this rate is 6 to 1. Even if it reaches only $64, where there is some potential resistance, the reward-to-risk ratio is still 2.67 to 1.
Thus, not only do you have an edge for this stock to outperform its benchmark index, you also have the potential of a 6-to-1 reward-to-risk ratio if you are correct. That’s what I call an improvement on random entry.
We’ll look at how this could be traded with exits, later in this section. See page 169.

Figure 3-1 Entry after Six Down Days and an Inside Up Day
Exits Are the Keys to Making Money
As I mentioned earlier, I proved to myself that one can make money with random entry. When you employ random entry, you are giving up any advantage that your particular setup and entry edge have. The only way you can make money is to catch a strong trend occasionally, make sure your losses are not too big, and practice proper position sizing strategies.
How can your exits help you catch a strong trend? In a random entry system, when you exit, you’ll enter back into a trade again and lose another $100 in slippage and commissions. Thus, you want your initial exit to be large enough to make sure that you don’t exit very often. At the same time, you don’t want to enter into a trend in the wrong direction, which would cause you to pile up huge losses. Thus, to make the random entry system work, I needed an initial stop that was big enough to keep me in the market while it was just making random noise movements or moving sideways. I chose to exit at three times the 20-day volatility or average true range.
I like to keep things simple, and so I made the abort exit and the profit-taking exit very similar. I trailed three times the 20-day average true range from the closing price. Thus, if the price moved in my favor, so did the trailing stop, and if the volatility shrank, the stop also would move in my favor. The stop was moved only in my favor, never against me.
As a result of this exit, I was able to stay in sideways markets for a long time and not get stopped out. If I entered against a trend, I was stopped out quickly and hoped the random entry would reenter in the direction of the trend. Also, if I was lucky enough to enter in the direction of the trend, my stop kept me in the trend for a long time. It was that easy. With that simple exit, the random entry system was able to follow the golden rule of trading (cutting losses short and letting profits run) and thus make money overall.
The first kind of exit you need to know about is the abort exit. This is the exit that defines your initial risk, or what I’ve been calling 1R.
In reality, there are two kinds of initial exits: tight ones (1R is small much like our earlier example of 46 cents for the SLB trade) and wide ones (1R is big—like the 3× ATR for the random entry system). Each has some distinct advantages. The wide exit keeps you in a trade for a long time and gives it a chance to start working for you. Thus, if you like to be right and you want to stay in the trade a long time, you have more of a chance with a wide exit. Examples of this include the three times volatility exit mentioned for the random entry system and a 25% retracement exit, which works fairly well for stocks. If you want to buy and hold stocks as long as you can, simply use a 25% trailing stop as an exit, adjusting it up whenever the stock makes a new high.2

A Tight Stop Will Produce a Small R
The other type of initial exit is the narrow exit, which defines 1R as a very small amount. If you want to be right and stay in the trade a long time, you don’t want this sort of exit because you’ll be stopped out a lot. Your stop is usually within the noise of the trade, so you’ll be stopped out within a day or two. However, if you want large R-multiple gains and are willing to trade short term, you’ll find some advantage to tight initial exits.
Let’s look at an example. Suppose you buy a $50 stock when it breaks out from a consolidation with power. If you put your stop below the consolidation, say, at $45, you’ll probably be right a lot. However, if the stock goes up $10 in price, you will have made only twice your risk, or 2R.
Suppose you put your stop in at $49, a dollar away. If the move has power behind it, the stock should keep moving and you won’t be stopped out. Furthermore, if the stock goes up $10, you’ve now made a 10R profit, or 10 times your initial risk. In fact, you could be stopped out three times in a row, getting three 1R losses, and then make your 10R profit. You are right only 25% of the time, but your total profit is 7R.
At this point you might be thinking, “Yes, you make 7R, but you started out with a very small risk.” That’s where position sizing algorithms come into play. What would happen if you risked 1% of your account on every trade? If you are up 7R, you’ll be up about 7%, no matter how big or small R is for one unit.
Exiting a Trade beyond the Initial Stop
When you design an exit for your system, one of the key things to consider is the purpose behind that exit. You might have five possible purposes for an exit:
1. Produce a loss but reduce the initial risk
2. Maximize the profits
3. Keep you from giving back too much profit
4. Maintain a reward-to-risk level of at least 1 to 1
5. Psychological reasons
Rather than cover each of these exits, I’ll focus on one particular goal and show you how to use exits to meet that goal. Let’s say your goal is to follow a trend as long as it lasts. However, you want to have a wide initial stop so that you won’t be whipsawed once you get into the market. You also want to give the position plenty of room to move. Finally, you want to capture as much of your profit as you can once you reach a 4R target. Note how these objectives fit a particular set of beliefs about the market. Your system always has to conform to your beliefs about the market or you won’t be able to trade it.
To meet your initial goal, you need a wide stop. Let’s say you pick three times the volatility of the last 20 days, as I described for my random entry system. That gives you plenty of room to make sure that the random noise of the market will not take you out of your position.
Second, you want to give your position plenty of room to move as it is going up. Again, all you have to do here is trail your three times volatility stop to meet this objective. Thus, every time you make a new high, your stop will move up to trail from that point.
Third, once you’ve reached 4R, you don’t want to give much profit back. Thus, you decide that when your target is reached, you will shrink your stop from 3 times the volatility to 1.6 times the volatility. It’s that simple. Your worst case at this point is that the market will retrace immediately and you will get stopped out. However, your new stop is probably only about 0.5R now, and so if you were immediately stopped out, you’d still have about a 3.5R profit. Of course, the market could continue to climb, and you are giving yourself a chance for a 10R profit or more.

Some Exits Help Maximize Your Profits
All these stops are simple. I came up with them just by thinking about the types of stops that you might want to use to meet the stated objectives. No testing was involved, and so they are not overoptimized. No rocket science is involved. They are logical and make sense for meeting the objectives. They are simple. Note that you also have three different exits but that only one will be active at any one time: the one that is closest to the market price.
If you want to master exits for your trading system, you must learn the different types of exits available to you. Notice what each exit is designed to accomplish. Then, when you decide how your system is supposed to work, you’ll find it easy to develop an exit that meets your goals.
Remember that your real goal in designing a trading system is to develop one that works well in one or two market types. That’s pretty easy to do. As mentioned elsewhere in the book, the mistake most people make is to try to fit one system to multiple market types. You don’t have to do that.
Start Thinking in Terms of Reward and Risk
One of the cardinal rules of good trading is always to have an exit point before you enter into a trade. This is your worst-case risk for the trade. It’s the point at which you would say, “Something’s not working with this trade, and I need to get out to preserve my capital.”
Most sophisticated traders have some sort of exit criteria that they like. However, if you are a novice and don’t know how to do this, I recommend 75% of your entry price if you are an equity trader. That is, if you buy a stock at $40, get out if the stock drops to $30 or below. If you are a futures trader, calculate the average true range over the last 20 days and multiply that result by three. If the contract drops to that level, you must get out of the position.
Your initial stop defines your initial risk. In the example of our $40 stock, your initial risk is $10 per share, and I call this risk 1R, where R stands for risk. If you know your initial risk, you can express all your results in terms of your initial risk.
Say your initial risk is $10 per share. If you make a profit of $40 per share, you have a gain of 4R. If you have a loss of $15 per share, you have a 1.5R loss. Losses bigger than 1R could occur when you have a sudden big move against you.
Let’s look at a few more cases. If the stock goes up to $110, what’s your profit in terms of R? Your profit is $100 and your initial risk is $10, and so you’ve made a 10R profit. This is interesting because portfolio managers like to talk about 10-baggers. By a 10-bagger, they mean a stock that they bought at $10 per share that goes up to $100—in other words, a stock that goes up in value 10 times. However, I think a 10R gain is much more useful to think about and much easier to attain.
When our 1R loss was $10 per share, the stock had to go up by $100 to get a 10R gain. However, to fit the portfolio manager’s definition of a 10-bagger, it would have had to go up 10 times the price you bought it for, rising from $40 per share to $400. What would that $360 gain be in terms of R multiples when your initial risk was $10? That’s right: It would be a 36R gain.
As an exercise, look at all your closed trades last year and express them as R multiples. What was your initial risk? What was your total gain and total loss? What’s the ratio of each profit or loss to the initial risk? If you didn’t set your initial risk for your trades last year, use your average loss as a rough estimate of your initial risk.
Let’s look at how eight trades might be expressed as ratios of the initial risk. Here we have three losses: $567, $1,333, and $454. The average loss is $785.67, and so we’ll assume that this was the initial risk. (I hope you know the initial risk so that you won’t have to use the average loss.) The ratios that we calculate are the R multiples for the trading system. This information is shown in Table 3-1.
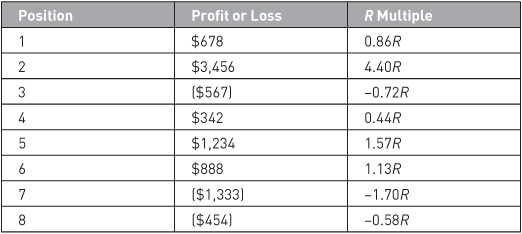
TABLE 3-1 Expressing Profit or Loss as R Multiples
When you have a complete R -multiple distribution for your trading system, there are a lot of things you can do with it. You can calculate the mean R multiple. The mean R multiple, what I call the expectancy, tells you what you can expect from your system on the average over many trades in terms of R.
“Mean” R Is the Expectancy
Although I recommend that you have a minimum of 30 trades before you attempt to determine the characteristics of your R-multiple distribution, we’ll use the eight examples in the table. Here the mean R multiple is 0.68R. What does this tell you? The expectancy tells you that on the average you’ll make 0.68R per trade. Thus, over 100 trades, you’ll make about 68R.
The standard deviation tells you how much variability you can expect from your system’s performance. In the sample our standard deviation was 1.86R. Typically, you can determine the quality of your system by the ratio of the expectancy to the standard deviation. In our small sample the ratio is 0.36, which is excellent. After 100 or so trades, I’d expect this ratio to be much smaller; however, if it remains above 0.25, we have an acceptable system.
Thinking about Reward and Risk throughout the Course of a Trade
Recently, I consulted with a fund manager who was a strong fundamentalist. He was really good at predicting when a strong, fundamentally based trade would start, and he was good at knowing at what price he was wrong about the trade. However, in my opinion, those were the only major things he had going for him. He didn’t understand reward to risk, and he didn’t understand the impact of position sizing strategies.
He predicted that if the Singapore dollar dropped below $1.80 (it was at $1.85), it would move to $1.20 over the next 10 years. Thus, he would be risking 5 cents for a potential move of $0.60 or a 5-to-1 reward-to-risk ratio. However, when the Singapore dollar reached $1.35 in early 2009, his stop was still at $1.80. Now he was risking $0.55 for a remaining potential move of $0.15. His reward-to-risk ratio was now 1 to 3.67—with his risk being more than three times his reward. And when he gave back 20 cents, his investors were shocked, even though he insisted he was still right about his prediction. He didn’t understand that he should never let his reward-to-risk ratio fall below 1 to 1 throughout the trade.
Figure 3-2 shows what he should have done. When the price dropped below $1.70, he should have lowered his stop to break even. Then, he would have been risking only $0.10 of profit to make $0.50. Keeping his original stop would have given him a 3-to-1 reward-to-risk ratio.
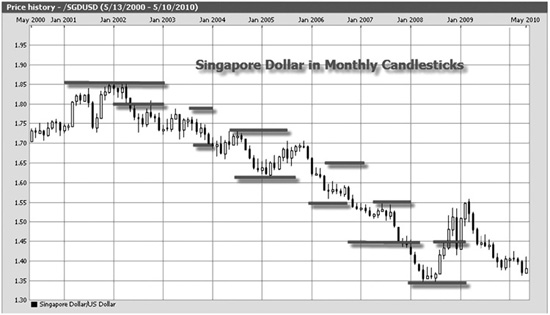
Figure 3-2 Using Exits to Maintain a Good Reward-to-Risk Ratio
When the price formed a bottom at about $1.60 and started moving up, he should have moved his stop to $1.73. He then would have been risking $0.13 in profits to make an additional $0.40 and still would have had a 3-to-1 reward-to-risk ratio.
When the price moved to about $1.55, even though it was still moving down, he had a nice profit and should have locked in about half of that profit by putting his stop at about the $1.65 level. He would have been risking $0.10 to make $0.25—still a good reward-to-risk. But at this point he would have locked in a 1.5R profit.
After the Singapore dollar formed a based at about $1.55 and started moving down past $1.45, he could have lowered his stop to $1.56, risking $0.11 to make $0.25, which was still better than a 2-to-1 reward-to-risk ratio.
When the price hit $1.35 and started moving up, he could have lowered his stop to $1.45. He then could have had a profit potential of $0.15 and a risk of 0.10, which was still favorable. He would have eventually been stopped out at this level, but he would have locked in a profit of $0.35 or 3.5R.3
Had he kept his original stop, he would still be in the trade, but he would have been risking $0.40 to make $0.15, which doesn’t make sense. In addition, he would be at risk of giving back a profit that had taken six years to accumulate. That’s why you should think in terms of reward-to-risk ratios throughout the course of your trade.
Thinking about the Reward-to-Risk Ratio as the Exit in a Swing Trade
In Figure 3-1 on page 168, I showed you the trade in SLB after six days down with a 6-to-1 potential reward to risk. So what would happen in that trade if you kept the reward to risk in mind as an exit throughout the trade? For example, each day the trade opened higher. Thus, you could have put your stop under the low of the prior day. This would have meant that even after day 1 you would have had a small profit locked it. You can see from Figure 3-3 that this could have been done in this example.
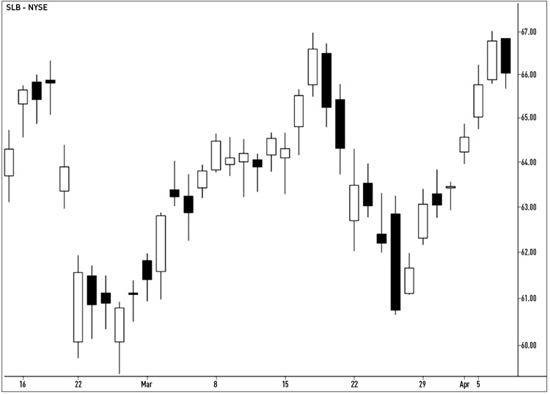
Figure 3-3 Raise the Stop to Just Below the Prior Day’s Low
What if the price didn’t go up each day? You’d keep the stop at the same point until the price reached a new high and then raise your stop. And in each case you’d be locking in more profit and still be giving yourself at least a 1:1 reward-to-risk ratio for the remainder of the trade.
Furthermore, the worst reward to risk would be at the final day when your stock closed at its target price. If you wanted to allow for the potential that it would move higher, your risk would be just under the prior day’s low of 66.85. You’d have a risk of 1.15 points for the potential of a higher gain. You’d have been stopped out the next day. Your other alternative would have been to take off the position as soon as the target was reached.
One of Your Most Important Tasks: Keep Up with the R Multiples of Your Trades
One of the easiest ways to keep track of the R multiples in your trading system and its expectancy is to calculate them on a daily basis. Keep a daily spreadsheet with some simple information on it. You need only five basic columns:
1. An identifier column (what trade it was and when it was purchased)
2. Your entry risk (the difference between the entry price and the initial stop times the number of shares purchased)
3. How many shares or contracts
4. The total gain or loss when you sold the stock (yes, you can subtract commissions)
5. The R multiple (column 4 divided by column 2)
You might want other columns, such as the entry price, whether you are long or short, the exit price, and the percent risk taken on the trade. However, these columns are not critical to obtain the R multiples and the expectancy of your trades.
When you do this kind of exercise, you gain important information. First, you are forced to write down and know your initial stop. There is no cheating when you do this; you must know the initial stop. This exercise alone will save you money. It will force you to have an initial stop and show you whether you are paying attention to it. If most of your losses are less than 1R, you are paying attention. If most of your losses are more than 1R, you are not paying attention to the stop or you are trading instruments that are so volatile that you cannot possibly expect to get out at those stop levels.
The second thing this exercise forces you to do is define what 1R is in each trade in the simplest way possible. You’re asking yourself, “What is my total, worst-case risk going into this trade?” and writing the answer down on paper. Again, this value is the entry price minus the stop price multiplied by the total number of shares purchased. Here 1R is confounded with the position sizing method, but it also is in the profit and loss, and so the position sizing method cancels out.
Third, this exercise forces you to calculate the R multiple for each trade. When you close out the trade, you compare it with the initial risk. Is it bigger or smaller than the initial risk, and by what magnitude? This information is very valuable.
Fourth, this process forces you to start thinking about the reward-to-risk ratio in each trade you make. You begin to learn that you should never take a trade unless the potential reward is at least three times as big as the potential risk you face. And the reward-to-risk ratio should continue to be no worse than 1 to 1 as the trade progresses.
Fifth, this exercise provides an easy way to calculate the expectancy of your system on an ongoing basis. You simply add up the R multiples for all your trades and divide the total by the number of trades. The resulting value is the current expectancy of your system. By doing this exercise, you’ll know where you stand every day. You’ll know the expectancy of your system—how much you’ll make per trade on average as a function of your initial risk—and know why it changes.
For example, when I asked one of my clients to send me a spreadsheet of his scalping trades, it became clear to me that his trading was not at all as he’d described it. Those trades are shown in Table 3-2. In addition, the R multiples are sorted in Table 3-3. For example, his system had 60% winners and risked a few cents per share on 1,000 shares to gain a few cents per share on those shares. In other words, his 60% system had winners and losers that were both about 1R. The fact that he didn’t know the distribution of his R multiples—as most traders don’t—shows why this is such an important exercise. Although he was right about the system being correct 60% of the time, he was wrong about the R-multiple distribution. Half his profit came from a single trade (trade 7). Although only 40 trades were given in the sample, I expect that this was typical of his trading.
Another interesting aspect of his trading was four consecutive losses, all of which were 1.5R or bigger. He also had six losses in eight trades. This is another nasty contingency that one may have to contend with while trading such a system even though the system has a reliability of 60%.
In addition, he had a number of losses that were 2R or more. I tend to suspect that many losses that big are psychological mistakes. Eliminating those mistakes is very important to doing well in trading.
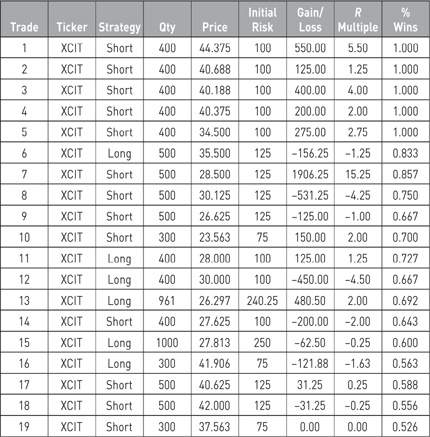
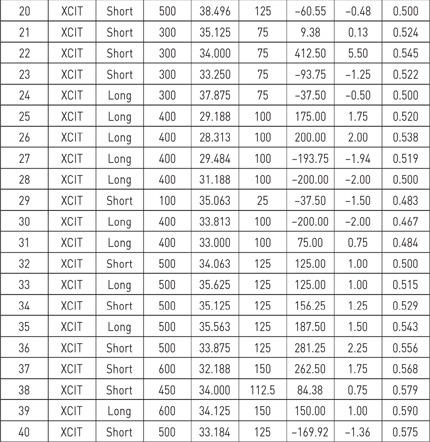
TABLE 3-2 A Set of Scalping Trades


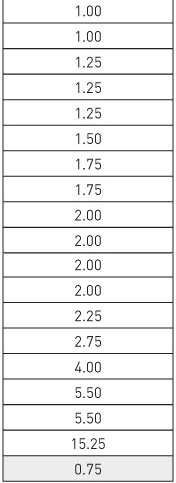
TABLE 3-3 R Multiples Sorted
You can plug all of these R multiples into a simulator, such as the one that comes with my Position Sizing Game, and start simulating what real trading would be like. Doing this can give you a lot of good information about what it is like to trade this system.
Exercise
Make a table similar to Table 3-3. For each trade you make, put down your worst-case risk at the outside: how much would you lose if you were stopped out? This amount defines 1R for you. When you sell the position, write down the total profit or loss for you. Divide this figure by 1R and you will have the R multiple for the trade.
On an ongoing basis, sum your R multiples and divide by the number of trades. This will give you an ongoing expectancy for your system. Notice how each trade affects it.
Overall, I would recommend that you collect 100 to 200 trades like this. At that point you will have a good idea about the expectancy of your system. In addition, you will have a fairly accurate picture of the distribution of R multiples in your system, allowing you to simulate it. Remember to look at market type, and take trades only for the market type for which your system is designed.
Six Keys to a Great Trading System
As people study trading, most of them are exposed to a lot of misinformation. It’s almost as if there were an intelligence agency putting out misinformation to make sure that the average person cannot trade profitably. Thus, it’s very important for you to understand the six factors in great trading:
1. Reliability. What percentage of the time do you make money? Most people emphasize this. They want to be right on every trade because they were taught in school that 70% or less is failure. However, you can be right about 30% of the time and still make good money.
2. The relative size of your profits compared with your losses. We’ve already discussed thinking about your trades in terms of R multiples. You want your losses to be 1R or less and your profits to be large multiples of R. This is essentially the golden rule of trading: cut your losses short, and let your profits run. It’s one of the keys to success, but it is very hard for most people to do.
3. The cost of your trading. When I first started trading, it cost about $125 each time one got in and out of the market. Trading costs were atrocious. Now you can get in and out for as little as a penny per share. However, trading costs still can mount up in an active account. Several years ago I was trading very actively. I was up about 30% on the year, and I noticed that my trading costs totaled more than my profits. Thus, even with today’s massive discounts, it can still cost a lot to trade.
4. Trading opportunity. For example, if you can make an average profit of 1R per trade and you make 50 trades per year, you’ll be up 50R. However, if you can make that trade 500 times, you’ll be up 500R.
5. The size of your trading capital. When your account is small, it’s very difficult to make good returns, but when your account gets to a decent size, making good returns becomes much easier. Some accounts are just too small to trade. The reverse also occurs. When your account is so big that you can move markets just by entering or exiting, it becomes much more difficult to make good returns.
6. Position sizing strategies. Position sizing strategies tell you how much to risk throughout the course of a trade. It is probably responsible for 90% of your performance variability; that’s how important it is.
Most people want to be right most of the time. However, you can be right 99% of the time and still be wiped out in any of the following scenarios:
1. You don’t have enough money to trade, and the one time you are wrong you are wiped out.
2. Your position size is too big, and the one time you are wrong you are wiped out.
3. One loss is so big (regardless of your position sizing method) that it wipes out all your profits (perhaps you have small stops and your loss is a 100R loss).
Common Elements of Success
Most people don’t realize that at any particular time four or five people may go long a position and another four or five may go short or unload a position. Each of them can have different systems and different ideas, and all of them can make money. They may have different ideas about the market, but they trade it because they’ve figured out that it is a low-risk idea. A low-risk idea is an idea with a positive expectancy that’s traded at a position sizing level that can survive the worst-case contingency in the short run and realize the long-term expectancy. I would add that such ideas are low-risk ideas only if they are traded in the market type for which they were designed.
All traders can make profits—even with different concepts, different systems, and some taking the opposite sides of the same position—when they all use systems with 10 common characteristics:
1. They all have a tested, positive expectancy system that’s proved to make money for the market type for which it was designed. We’ve been discussing how that’s done. This is either a mechanical system or a discretionary rule-based system.
2. They all have systems that fit them and their beliefs. They understand that they make money with their systems because the systems fit them.
3. They totally understand the concepts they are trading and how those concepts generate low-risk ideas.
4. They all understand that when they get into a trade, they must have some idea of when they are wrong and will bail out. This determines 1R for them, as we discussed previously.
5. They all evaluate the ratio of reward-to-risk in each trade they take. For mechanical traders, this is part of their system. For discretionary traders, this is part of their evaluation before they take the trade. In many cases, they evaluate the reward-to-risk ratio throughout the course of a trade, never letting it go below 1 to 1.
Can you begin to see how those five qualities will start to generate success? However, there are five more qualities that are just as important and in some cases even more important than the ones just listed. Before moving on, reread the prior sections and see if you can determine what they might be.
6. They all have a business plan to guide their trading. I’ve been talking about the importance of this plan for years. Most companies have a plan to raise money; similarly, you need a plan to help you treat your trading like a business.
7. They all use a position sizing method. They have clear objectives written out, something that most traders/investors do not have. They also understand that position sizing strategies are the key to meeting those objectives and have worked out a position sizing algorithm to meet those objectives. We’ll discuss this later.
8. They all understand that performance is a function of personal psychology, and they spend a lot of time working on themselves. This area has been my key focus for many years: teaching traders to become efficient, rather than inefficient, decision makers.
9. They take total responsibility for the results they get. They don’t blame someone else or something else. They don’t justify their results. They don’t feel guilty or ashamed about their results. They simply assume that they created them and that they can create better results by eliminating mistakes.
10. This leads to the tenth key quality: understanding that not following your system and business plan rules is a mistake. We’ve discovered that the average mistake can cost people as much as 4R. Furthermore, if you make even one mistake per month, you can turn a profitable system into a disaster. Thus, the key to becoming efficient is to eliminate such mistakes.
The “It Didn’t Work” Mentality
One of the least productive things you can say in furthering your market research is, “It didn’t work.” I frequently give my clients research assignments, telling them a great area in which they can do research. I may see them again later only to find out that they are working on something entirely different. When I ask about the research area to which I had directed them, the response is usually, “It didn’t work.”

The “It Didn’t Work” Mentality
That response totally shuts off productive research as if there were no potential in the area at all. A much better response would be, “It didn’t work because. …” This sort of response indicates why it didn’t work and perhaps even suggests an alternative course of action.
Let me give you a few examples of how this mentality has been used to shut down very productive areas of study.
One of my clients came up with what I thought was a very productive profit-taking exit. The exit started out with a wide stop, and the stop stayed wide as long as the market was moving strongly. However, when the market started to level off or when the advance started to slow, the stop would get much tighter. The net result was that one seldom gave back much profit. Doesn’t that sound excellent? I thought so, especially since his system always gave a reentry signal if the market started to move again. However, about nine months later this trader was into a drawdown. I asked how his stop was doing, and he said he had abandoned it. When I asked why, his response was, “It didn’t work when I added my position sizing algorithm.” There was no explanation why, which might have resulted in an alternative solution. Instead, the choice was simply to say, “It didn’t work” and move on.
I had been working with another client in developing a good system. We had discussed high R-multiple trading, and he had informed me that he had a setup that could be used in the context about which I was talking. He reasoned that this setup would give him signals with profits about five times as big as he was risking. Furthermore, the signals made profits, he thought, about 40 to 50% of the time. I thought that the signal sounded great and suggested that he take only those signals for a while. In addition, he was to research the exact parameters of the signal and send me a daily e-mail. What happened? He never took a single signal. Instead, he stopped sending me e-mails and told me that the signal didn’t work. I asked him to send me data showing me why it didn’t work. His response was that he’d get to it one day but to leave him alone until he’d gotten around to it. “After all,” he said, “I’ve already told you it didn’t work.”
Once again, a potentially great idea was killed by three little words: “It didn’t work.”
Those are just two examples of dozens that I can think of, and every one of them illustrates an important point: the way you think about something can totally change your relationship with an idea. Edison was said to have had 10,000 failures before he invented a working light bulb. He may have said “It didn’t work” after any one of them, but those words didn’t stop him. Instead, he determined why the method didn’t work and used that information to find another good idea. At no time did he abandon the idea permanently by saying, “It didn’t work!”
Know When It Doesn’t Work
When you have a system or an idea, you must know when it truly doesn’t work. This is the logical extension of giving up on a good idea because you think it doesn’t work. When you’ve researched something well enough to know (1) you are not getting the performance you want and (2) the reason you are not getting that performance, you’ve taken an important step toward knowing that something doesn’t work. Usually, the knowledge of why something doesn’t work will give you important knowledge about what to pursue next.
For example, let’s look at the idea of maximum adverse excursion (MAE), the idea that losing trades don’t go too far against us. In other words, you calculate the MAE in each winning trade to see how far it went against you. This gives you an idea for limiting your stops, but when you try to apply it to your trading, you may encounter some problems. Some profit increase does occur, but it may not be that significant for you compared with the complexity of the MAE addition. Let’s say you decide that MAE doesn’t work for you because (1) some losing trades exit at the MAE when they would have exited at much less of a loss if more room had been provided by a larger stop and (2) some big R-multiple winners are cut off and become losses. Since reentry isn’t allowed, those big winners are never realized. These two reasons cancel the effect of increasing the potential R multiple of those winning trades.
You might take this concept and decide that that’s all you want to do with it. It didn’t work, and you know why. That’s fine.
However, you also can use the reasons for “failure” as logical stepping points for your next research idea. For example, I noticed that in the few cases in which big R multiples are cut off, a reentry signal almost always will catch them. When you conduct trading research and determine why something didn’t work, it will always give you a reason. This reason could point you to areas that could give you much more profitable results.
Trading Reality Check
Having modeled success in numerous areas—the trading process, the design of systems, understanding and using position sizing strategies, and developing personal wealth—I’m amazed to see how we are almost hardwired to do all the wrong things. It’s as if we were put on this planet to determine how many ways, and to what extent, we can mess up our lives. How do you respond to a loss? Have you run simulations of your trading? Have you really worked on yourself and determined that it’s all you? What decisions have you made about your trading and yourself?
Let’s look at a simple example. Knowing what you know after reading this far, you should have many ideas for how to improve your trading. Is there not a good reason to spend a month (or six months) developing a good business plan and implementing many of these ideas? Of course not, so what is stopping you?
If you don’t immediately feel the urge to carry out this task, it’s time to do a little homework to recognize your self-defeating patterns and excuses. I’d like you to sit down and write several paragraphs on “The Story I’d Tell Myself If I Did Not Produce Meaningful Change in My Trading and Myself.” Be honest with yourself. What are your typical excuses?
Here is one possible excuse: “I was desperate. I was running out of money and needed to do something now. I really didn’t want to go back to work, so I had to make money now. As a result, I really didn’t have time to do a proper business plan. Instead, I just made trades in the market.”
You also have patterns of behavior, justifications for failure or not doing something, rationalizations for how you are, and so forth. So what is it? You might begin your rationalization with, “After going through Dr. Tharp’s Super Trader book, I did nothing toward creating meaningful change in my trading because. …” Or your story might even be worse: “After buying 20 books to improve my trading, I have not looked at any of them because….”
You might get away with sabotaging yourself by not making a plan or even not determining what you need to do. However, for the 30 minutes it takes to do this exercise, give yourself a break and be brutally honest with yourself. You know that you’ll con yourself in order not to make progress. Treat this exercise as a test to determine exactly how you con yourself. Can you be honest and tell it like it is, or is it more important to justify the excuses and be a failure?
Do a reality Check on your Trading
Go ahead. Take 30 to 60 minutes right now and start writing your excuses.
What did you write? If you were honest with yourself, you justified your limitations. You probably created a record that includes many of the major thoughts and beliefs you use to undermine virtually every endeavor you try. Furthermore, the more honest you’ve been with yourself, the more valuable this exercise will be for you.
What It Takes to Have Confidence
Here is an e-mail I received from a client:
Dear Dr. Tharp,
Overconfidence presents a trading conundrum. I find I can’t trade big or successfully without lots of confidence. But when I’m at my most confident, the point where I lose all anxiety, I tend to have my biggest losses. How can a trader retain a healthy level of anxiety while remaining confident enough to “stay big”?
First, you have to know yourself. This isn’t a small step. Most people are not willing to go inside themselves and explore because they are afraid of what they might find. Instead, they just say, “I already know myself.” But what if you have unlimited potential and don’t know how to tap into it because you are not willing to explore how you are blocking yourself?
Once you know yourself, you can set up objectives that you are comfortable with and a trading system that really fits you. That’s part of having the confidence to trade your system.
Let me ask you some questions, all of which are necessary to have a system that fits you:
• Have you written down your beliefs about the big picture, and does your trading system fit the big picture?
• Have you written down your beliefs about the market (what works and what doesn’t), and does your system fit that?
• Have you written down your beliefs about each part of a trading system, and does your system fit that?
• Is your system mechanical, or is it a rule-based discretionary system? If it’s neither, then you can never correct mistakes.
• Are your objectives clear, and do you have a position sizing algorithm that’s designed to meet your objectives?

When You Perform All These Steps, Your Trading Will Flourish
• Do you know what types of markets your system will work in and when it will fail?
Typically, if your trading system fits all those criteria, you’ll feel really confident trading it. If it does not, here are more questions for you to answer:
• What are your criteria for feeling confident about a trading system?
• Do you understand how your system will perform in the six kinds of markets? (I’ll address this later.) Here I don’t mean just its average performance but the statistical outliers (that is, 2 standard deviations away from the mean). Are you happy with that? Also, if your system is performing well above average, do you realize that and understand that below-average performance usually will follow?
• Have you collected enough data to know your systems R-multiple distribution?
• Have you simulated trading that distribution so that you will know what to expect?
• Can you live with the results of that simulation, knowing the performance you are likely to get if your R-multiple distribution is accurate?
• Do you have a worst-case contingency plan? Do you know how to keep most of those potential disasters from wiping you out? This is an important part of confidence. If you are not there, you shouldn’t be trading.
• Last, do you have a daily procedure to keep you on track? These procedures are designed to (1) keep you disciplined and, more important, (2) prevent mistakes or at least prevent you from repeating mistakes. One such procedure is discussed in the last part of this book.
Trading is really a business. Most businesses fail because of lack of planning. Treat trading like a business, not a hobby. If you haven’t done these things, you’ll typically be the most confident at the end of a winning streak and then have your biggest losses, just as you said. If you have done these things, you’ll understand the big picture for you and your performance will be much more consistent and elevated.
I’ve seen major trading entities that did not cover many of these points with their traders. Most of them performed poorly or eventually failed. Also, I’ve coached some entities (as well as many individuals) to encompass these points, and when they do that, they tend to flourish. What about you?