FOREWORD
Would you like to live in paradise? There’s a place where the average daily temperature is 66 degrees, rainy days occur on average only every five days, and the sun shines most of the time.
Welcome to Dallas, Texas. As most know, the weather in Dallas wouldn’t qualify as a paradise climate. The summers begin their ascent almost before spring arrives. On some days, the buds nearly wilt before turning into blooms. During the lazy days of summer, the sun frequently stokes the thermometer into triple digits, often for days on end. There are numerous jokes about the devil, hell, and Texas summers.
Once winter is in full force, some days are mild and perfect golf weather. Yet others present frigid temperatures, snow, and the occasional ice storm. It’s good for business at the local auto body shops, but it makes for sleepless nights for the insurance companies. The winters certainly don’t match the chills of Chicago or the blizzards of Buffalo. Nevertheless, Dallas is far from paradise as its seasons ebb and flow.
The yearly average temperature, though, is paradise.
Contrary to the studies that show investors that they can expect 7% or 9% or 10% by staying in the market for the long run, the stock market isn’t paradise either. Like Texas summers, the stock market often seems like the anteroom to investment hell.
While historically the average investment returns over the very long term have been some of the best returns available in the United States, the seasons of the stock market tend to cycle with as much variability as Texas weather. The extremes and the inconstancies are far greater than most realize. Let’s examine the range of variability to truly appreciate the strength of the storms.
From 1900 through 2009 (109 years), the annual change for the Dow Jones Industrial Average reflects an average gain of 7.1% per year. During that time, 64% of the years had positive returns and 36% had negative returns. Only 6 (about 5% of the time) of the years ended with changes between +5% and +10%. Most of the years were far from average—many have seen enough drama to drive an investor’s pulse into lethal territory.
And it is really worse than that. The 7.1% number comes from the average annual returns. The compound returns are only 4.1%! If you have a 20% down year, you need a 25% increase just to get back to break even. Much of the actual return from the stock market has been dividends. In the early years of the market analysis, dividends were routinely 4% to 5%. Now they are closer to 2%!
The stock market swings from high valuations to low valuations and back to high over very long periods of time that we call secular bull and bear markets. These cycles are on average 17 years long. Being in a secular bull market can be very rewarding. From 1982 through 1999, you were up 13 times in broad stock market averages in the United States and even more in smaller niche indexes.
But secular bear markets are most decidedly not fun for the buy-and-hope investors who “invest for the long term.” Investors waited over 16 years for a profit from 1966 through 1982. Taking inflation into account, it was 1992, over 26 years, that investors had to wait until they had additional buying power.
To put that into perspective, if you had invested in 20-year Treasury bonds in 1966 and rolled them over every year, 43 years later you would have been ahead of the S&P 500. Stocks for the long run, indeed!
Want to know your likely returns from buy-and-hold investing over the next 10 years? It turns out that the correlation between the valuation of the market when you buy and the returns you get 10 years later is very high.
Figure F-1 shows the annual 10-year real returns (after inflation) based on the P/E (price/earnings) ratios of when you invest. Unfortunately, we are in the period of the highest valuations, which suggests that returns over the next 10 years will not be “average.”
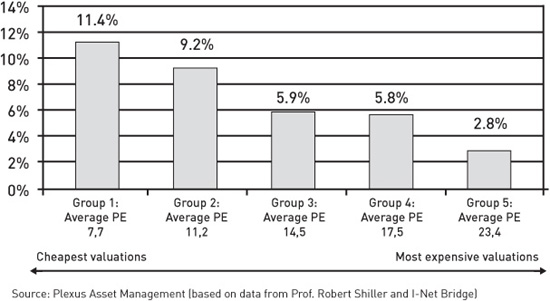
Figure F-1 Ten-Year Forward Average Real Returns for the S&P 500 Index, Based on P/E Ratios from 1871 to 2010
The cheapest quintile had an average P/E of 7.7 with an average 10-year forward real return of 11.4% per annum, whereas the most expensive quintile had an average P/E of 23.4 with an average 10-year forward real return of only 2.8% per annum. This analysis clearly shows the strong long-term relationship between real returns and the level of valuation at which the investment was made.
This pattern is even more pronounced when we break average returns into deciles (10 parts). Figure F-2 shows the averages and the ranges of returns starting with increasing P/E ratios.
Stock market returns have just gone through a “lost decade.” And the above analysis suggests that period could be extended even further. And given the sovereign debt crisis, the clear fiscal crisis in the United States, rising taxes, and more, volatility could be even higher in the future. The opportunity for buy-and-hold investing may still be far into our future when valuations are much better and another secular bull cycle has started. Hoping for a bull market today, with the current high valuations, is not my recommended investment strategy.
So, what’s an investor to do in the meantime?
One of the things you can do is to take control of your portfolio and learn to trade. Whether on large moves with one to two trades a year (if that) or more frequently, you don’t have to sit back and take what the market gives you. You don’t have to sit through large drawdowns and stomach-churning drops.

Figure F-2 Ten-Year Forward Average Real Returns Grouped into Deciles for the S&P 500 Index, Based on P/E Ratios from 1871 to 2010
Van Tharp can help you find the rhythm of the market that is right for you. Make no mistake, trading is not easy. It requires hard work, dedication, and study. Super Trader is filled with Van’s wisdom and insights gathered from years of training tens of thousands of people just like you to become successful traders.
Van divides Super Trader into five parts. Part 1 has to do with you. It’s all about understanding who you are because, as Van says, “You don’t really trade the market. You trade your beliefs about the market.” The only system you can trade is a system that fits you, so you need to know what makes you comfortable. And most importantly, you need to know what you want because your objectives must also fit who you are.
The second part of the book has to do with business planning. A good trader is actually running a business. In fact, you should consider yourself a businessperson first and a trader second. This is why Van points out the importance of developing a business plan. This is a working document to guide your trading. When you develop this document, you need to ask yourself these questions:
• Who am I?
• What am I trying to accomplish?
• What are my beliefs about myself, the markets, trading, systems, the big picture, and so on?
• What are my strengths and challenges?
• How can I capitalize on my strengths and overcome my challenges?
• What’s going on in the market?
• How can I design systems that fit me?
• How can I make sure I trade those systems effectively and efficiently?
• What can go wrong, and how can I minimize the impact of that?
• What other systems, besides trading systems, do I need to run my business?
Part 3 has to do with systems. Systems are all about making sure that the reward-to-risk ratio in any given position is always favorable. In addition, a system must fit who you are for you to trade it well. And a system must fit the market type for which it was designed. How well would you expect a system that was designed for a roaring bull market with normal volatility to work in a volatile bear market? Van makes the point that it is easy to design a “Holy Grail” system for any given market type, but it is impossible to find one that fits all market types. He even shows you how to determine if you have a Holy Grail system and the necessary criteria to create such a system.
In Part 4, Van discusses the importance of position sizing™ strategies. These strategies tell you “how much” to risk or allocate to a given trade throughout the course of the trade. Van believes that it is through position sizing that you achieve your objectives. In fact, your system simply determines how easy it is to meet your objectives through your position sizing strategies; however, poor position sizing can cause you to blow up even with a Holy Grail system. One thing that really stood out to me in this section was Van’s statement that “over 90% of trading performance variability is due to the impact of your position sizing strategies.”
Finally, Van discusses the concept of “efficient trading”—trading with no mistakes. He defines a mistake as not following your written rules; so if you don’t have such rules, like most average traders, then everything you do is a mistake. When you have this concept down, you can measure your efficiency as a trader (that is, the number of mistakes you make over a certain number of trades). More importantly, Van presents daily procedures that will help you prevent and eliminate mistakes and make you a more efficient trader. All of this just emphasizes how important your personal psychology is to your bottom line.
I work with some of the largest and most successful traders in the world. Some of these funds trade billions of dollars. But you have one major advantage over them. They can’t really put on a trade for less than a million dollars. That limits the size and liquidity of the markets they can use. You as an individual trader can go where the big funds can’t get to and take opportunities not available to them. You can choose your markets anywhere. You are not limited to just stocks. You can trade all sorts of markets that fit the times and your personality.
Learn from this book. Read it over and over again, put into practice what Van shows you, and personalize his teaching to your trading needs. As my friend and one of the world’s great traders says at the end of each of his letters, “Good Luck and Good Trading!”
—John Mauldin
John Mauldin is a three times New York Times bestselling author. He is president of Millennium Wave Investments and also writes the weekly Thoughts from the Frontline e-letter, which goes to over 1.5 million readers.