
Chapter 9
Aims, Context and Type of
Signals Studied 1
,
Guaranteeing safe operation in fourth-generation liquid sodium cooled nuclear reactors involves monitoring steam generators (SG) in order to detect any water leak into the sodium. The sodium-water reaction is exothermic and produces sodium hydroxide (a source of corrosion) and hydrogen (an inflammable gas that causes an increase in sodium pressure).
Acoustic methods are potentially significant due to their very quick response time and have been the subject of both theoretical and experimental studies. Tests carried out in June 1994 in an evaporator module of the Prototype Fast Reactor (PFR) have consisted of injections of water, argon and hydrogen to categorize the noise created by the reaction between sodium and water.
A water or steam leak at high pressure (typically 180 bars in this type of apparatus) into the SG’s sodium causes mechanical vibration in the fluid and the solid’s structure. Coupling between the two media, which involves an exchange of mechanical energy, induces complex propagation of vibrations between the source and the external casing of the SG.
Passive acoustic detection consists of differentiating between the vibrations detected using accelerometers placed on the SG’s outer wall when there is a leak from those corresponding to the normal state, which is considered background noise. This differentiation can be carried out using frequencies and/or amplitudes associated with this phenomenon.
Below is an illustration showing the transmission of elastic waves between the acoustic source and a sensor placed on the SG’s outer wall.
Figure 9.1. Illustration of the transmission of elastic waves between the source (leak or injection) and a sensor placed on the SG’s outer wall
During the normal operation of a SG, different permanent and/or transitory phenomena create acoustic waves with an associated broad-band frequency spectrum. Below is a (non-exhaustive) list of these phenomena:
– water boiling;
– the flow of sodium;
– stress due to a thermal field;
– friction between structural elements (tube/tube support grid); and
– mechanical shocks of varying causes.
Motor pumps and, more generally, the other machines in the system also contribute to low-frequency background noise.
In the event of a water or steam leak, other phenomena related to the sodium-water reaction occur:
– vibrations in the structure caused by the high-speed ejection (through the cracking) of pressurized water or steam and its subsequent volumic expansion in the liquid sodium;
– the generation of pressure waves in the sodium due to turbulence caused by the jet bubbles (H2O a H2); and
– the emission of mechanical stress waves due to the rapid increase in temperature in the structures around the leak.
All of these phenomena result in the emission of acoustic waves with a broadband frequency spectrum: the passive acoustic detection systems therefore function in a frequency domain that ranges from several dozen Hz to several hundred kHz, a band that allows the most precise distinction between the occurrences of leak or non-leak situations.
Figure 9.2. A PFR steam generator
The number of injections increased to more than 80. The signal was measured using six ENDEVCO 7704-17 accelerometers (with a resonance peak of around 45 kHz), each of them being fixed at the outer end of a wave guide that was welded onto the SG’s external wall. The recording frequency band was [0–80] kHz.
The location of the six wave guides into the evaporator’s outer wall is shown below. The location of these corresponds to WG 3, WG 5, WG 6, WG 7, WG8 and WG 10 sites.
Two injection systems have been used: one within the tube bundle; and the other in the space between the SG’s casings.
Figure 9.3. Location of the six wave guides and the position of the injection device. The hydraulic sodium circuit in the PFR evaporator
Figure 9.4 is a graphic representation of injections into a space with two dimensions of flow/pressure. Each point in the figure corresponds to an injection event in the SG. Note that the area representing a leak of water/steam into the sodium corresponds to high pressure and low flow conditions.
Figure 9.4. Distribution of 80 injections into a two-dimensional flow/pressure space
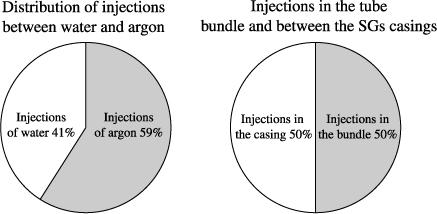
The numerical data used in the work associated with this current study are composed of 81 injections:
– 34 water injections; and
– 47 argon injections.
Figure 9.5 provides a graphic representation of the distribution of injections between argon and water and between injections within tube bundle and injections in the space between the SG’s casings.
The signals recorded on magnetic tapes were digitalized by CEA in 1996 (sampling the signal at a frequency of 130 kH so as to have a useful bandwidth of up to 50 kHz). The systematic examination of signals’ power spectral density (PSD) in the frequency band 0–60 kHz has shown that the majority of energy is concentrated in the band at around 0–5 kHz. The signals were under-sampled by a factor of 10, leading to the sampling frequency at Fe = 13 kHz. The analysis carried out in 1996 was conducted using the 0–6 kHz band.
Figure 9.5. Distribution of injections of argon according to their location
An example of the distribution of PSD typically found with the injection of argon and water is shown in Figure 9.6.
Figure 9.6. Example of a PSD associated with injections of argon and water
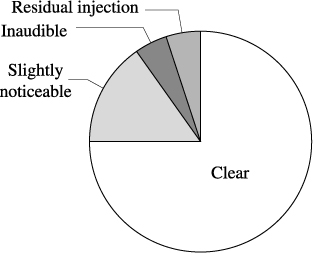
The 81 injection tests were used in 1996 to study a systematic audiophonic recording in order to label the database indicating the “clearness” (when the acoustic signal can easily be distinguished from background noise) associated with each injection noise. This subjective labeling can then be compared to analytical results. The signals were classed according to four categories:
– “clear”: the injection is clearly audible;
– “slightly noticeable”: the injection is not clearly distinguishable from the background noise;
– “inaudible”: the injection is not clearly distinguishable from the background noise;
– “residual injection”: the injection noise appears to be present from the beginning of the recording (between 0 and 10 sec).
Figure 9.7 provides a graphic representation of the distribution of injections according to the “clearness” criterion used in 1996.
Figure 9.7. Graphic representation of the distribution of injections according to the clearness criterion
The injections represented by a vector of features (parameters) characteristic of the previously digitized signals have been classified using an unsupervised classification method.
This 1996 study has shown that the noise caused by water injections into the liquid sodium in a SG can be distinguished from the noises caused by argon injections: a recognition rate of 100% for argon and 70% for water has been obtained. In 1996 it was estimated that accounting for the granularity of signals significantly increases the recognition rate for water injections and decreases the rate of false alarms for argon injections.
It has been observed that no water injection carried out at pressures higher than 100 bars and with a flow of less than 10 g/s (representative area for SG water leaks in sodium reactors) was associated with any sound labeled as “clear” in 1996. This resulted in the analysis being re-examined in 2009 to improve signal recognition using “up to date” signal-processing tools.
1 Chapter written by François BAQUÉ, Olivier DESCOMBIN, Olivier GASTALDI and Yves VANDENBOOMGAERDE.