Chapter 10
Fail Fast: Managing Risk
IN THIS CHAPTER
![]() Getting the scoop on risk measurement and management
Getting the scoop on risk measurement and management
![]() Avoiding losses at the individual stock and portfolio levels
Avoiding losses at the individual stock and portfolio levels
![]() Crafting your exit game plan
Crafting your exit game plan
If you’ve ever seen the popular 1984 film The Karate Kid starring Ralph Macchio and Pat Morita, you may already know why this chapter is the most important in this book. In the film, karate master Mr. Miyagi teaches the timid teenager Daniel Larusso martial arts. But instead of beginning Larusso’s training with how to throw a right hook or how to do a round kick, Miyagi stresses defensive techniques. “Wax on, wax off,” he tells his student. The lesson is that you must block your opponents’ punches and kicks or you won’t last very long in a fight.
Believe it or not, swing trading isn’t that different (fortunately, there’s no need to train by waxing cars). I believe that the biggest determining factor of whether you’ll be successful as a swing trader is how well you’re able to implement your own risk management system. All too often, managing risk gets relegated to one or two simple rules of thumb: diversify your holdings and limit your investment in a single security, and all should be merry. Au contraire — although diversification and position sizing are important parts of risk management, they don’t encompass all features of it. Moreover, traders often fail to fully implement diversification and position sizing correctly.
Managing risk is threefold: limiting the risk from a single position, limiting the risk on the portfolio level, and executing the orders your risk system tells you to execute. The first two can be taught to a five-year-old, but the practice of following your risk system is more difficult. As a swing trader, you have no one behind you making sure you follow these rules, and that means you’re literally your worst enemy. If you get sloppy and ignore a rule here or there, you may get away with it a few times, but eventually the market will punish you.
Risk Measurement and Management in a Nutshell
Trading in general can be very deceptive — things aren’t always as they appear. A hotshot trader or portfolio manager may post tremendous returns year-in and year-out, but if that trader or manager doesn’t manage risk well, he or she may be one day away from blowing up and losing everything.
Risk management is the science (and sometimes the art) of limiting the losses your portfolio may suffer. This chapter breaks down limiting risk into two components: limiting the risk of an individual security and limiting risk at a portfolio level.
Fortunately, you can limit the potential losses of your portfolios by following several rules, which this chapter discusses in detail:
- Limit the amount of capital you invest in a position (position sizing)
- Invest in securities that trade frequently (liquidity)
- Spread out your capital over several positions (diversification)
- Spread out your capital over different sectors and countries (diversification)
Risk management is how you put these various methods together into a coherent strategy. Before you buy a stock, you must have written rules on how you’ll respond should that trade go sour. That’s your risk strategy. But that doesn’t mean you won’t experience losses. All professional (and great) traders lose money. What separates the successful ones from the burnouts are those who manage their risk well.
 You have to be humble when you invest in the financial markets; you can’t ever think you’re smarter than the market. The minute you think that is the same minute your proverbial head will be handed to you on a silver platter.
First Things First: Measuring the Riskiness of Stocks before You Buy
Before you can manage the riskiness of your portfolio, you need to measure the riskiness of the stocks you’re considering. So just how can you measure the riskiness of an individual stock? Consider these factors, all of which I discuss in greater detail in the following sections. They can give you an idea how much a security’s share price may move in the near term.
Looking at liquidity: Trade frequency
Liquidity refers to the ease of entering and exiting a security, so don’t overlook it. Liquidity may not seem important when you’re entering a security because you can be patient and enter over time, but its importance becomes paramount when you need to exit and can’t find a buyer.
To understand liquidity, it helps to understand how the market works. The market is composed of millions of buyers and millions of sellers. The big companies — like Apple or Exxon Mobil — almost always have thousands of traders wanting to buy or sell stocks. But what about other companies? Some securities may not have that many traders interested in buying or selling stock on a particular day. The problem with that scenario is that the fewer the shares that trade, the more expensive it is to get into and out of a position.
In general, avoid companies with low liquidity at all costs. Although there may be some excellent opportunities in stocks with average daily trading value of $5,000, there are also ample opportunities in stocks with average daily trading value of $100,000 (average daily trading value is the average volume multiplied by the current share price). Why expose yourself to the risk of being unable to find a buyer for your shares if you need to exit in a hurry? You shouldn’t.
So how liquid should shares of a security be before you purchase stock in it? That depends on your account size. If you’re investing $25,000, you probably need to stick to stocks with average value traded of $50,000 per day. If you’re investing $1,000,000, you may be looking for stocks with average value traded of $2,000,000.
 As a general rule, your position size shouldn’t represent more than 10 percent of the average daily trading value of the shares.
Suppose you’re interested in buying shares of LowLiquid Corporation, which trades (in this hypothetical world) on the New York Stock Exchange under symbol LL. Table 10-1 shows the current orders outstanding for the purchase and sale of shares in LowLiquid Corporation.
TABLE 10-1 Hypothetical Order Book
Sell 100 Shares |
$36 |
||
Sell 100 Shares |
$26 |
||
Buy 100 Shares |
$25 |
||
Buy 100 Shares |
$24 |
||
Buy 100 Shares |
$23 |
An order book shows what the market maker sees: the current orders outstanding for a security. In this example, you see that buyers are interested in purchasing shares of LowLiquid Corporation for $25, $24, and $23 per share. However, the only sellers available at this time are selling shares for $36 and $26.
If you want to buy shares of LowLiquid Corporation, it may be a difficult proposition. Enter a market order for 200 shares, for example, and you’ll buy 100 shares at $26 and 100 shares at $36 — giving you an average cost basis of $31. With the current bid at $25, you’re already down almost 20 percent!
The spread, or difference in share prices, may not be always so large, but this example is intentionally exaggerated to illustrate the high cost that illiquidity can have on your portfolio.
Sizing up the company: The smaller, the riskier
Another factor to consider when determining the riskiness of a security is the size of the company. Institutional traders care more about size than individual traders. Over the long term, small company stocks have outperformed large company stocks. But because small company stocks are more volatile, traders must take extra precautions when investing in tiddlers. (Seriously, that’s what they’re often called.) For example, you may have a tighter stop loss on a small cap security than a large cap security.
Large company stocks (often called large capitalization stocks or large cap for short) are often less volatile — and therefore less risky — than small company stocks. But what is large and what is small? Ask Mr. Market Cap. Market cap tells you the value of a company — or more accurately, the value that Wall Street gives it today. The calculation of market cap is simple, but you’re unlikely to need to calculate the figure because most websites and research services provide it for free. Yahoo! Finance https://finance.yahoo.com/and Google Finance www.google.com/finance are two popular sources for this information.
Market cap is defined as
Total shares outstanding × Price per share = Market capitalization
Generally, companies are classified into one of four market cap categories based on market capitalization:
Market Cap Category |
Market Capitalization |
Large cap |
$15 billion or higher |
Mid cap |
Between $1 billion and $15 billion |
Small cap |
Between $300 million and $1 billion |
Micro cap |
Below $300 million |
Micro cap companies tend to have low liquidity. Moreover, they’re susceptible to market manipulation. For example, a trader may start a rumor online that a particular company has a cancer drug breakthrough. That kind of unsubstantiated rumor won’t cause a large cap’s shares to blink, but it may send a micro cap’s stocks through the roof (or the floor, if the rumor isn’t true or isn’t good!). Although swing traders trade all these securities, you’re best off avoiding micro cap stocks whenever possible.
Assessing the beta: One security compared to the market
Individual traders often overlook beta, which has more weight with institutional traders. Although beta is backward-looking (that is, the historical volatility doesn’t necessarily mean a stock or security will be as volatile in the future), you should know a security’s beta in order to get an idea of how it has historically traded relative to the market.
In plain English, beta tells you how volatile a security is relative to the market. The higher the beta, the more volatile the stock has been in the past. Unfortunately, beta isn’t always right. Its calculation (which is beyond the scope of this book) is based on historical data. There’s no guarantee that the beta of a stock may not change — say from 2 today to 1 tomorrow. Therefore, you need to know the beta of a security to get a general idea of how volatile that security is, but don’t bet your life on it.
Take a gander at some information on the shares of Microsoft Corporation as an example:
Symbol: MSFT |
Share Price: $104.82 |
Beta: 1.16 |
Volume: 56.29 million |
Microsoft Corporation has a beta of 1.16, which means that, on average, Microsoft shares tend to rise or fall 1.16 times the general market. If the S&P 500 Index rose 1 percent in a day, you may expect to see Microsoft shares rise 1.16 percent.
There’s no right beta for a security. A security that may move up a lot is desirable, but not if it can also cause you losses significant enough to take you out of trading. That doesn’t mean you have to pass up a security that has an extremely high beta. But it does mean you may have to allocate less to that security because of its inherent volatility.
Avoiding low-priced shares: As simple as it sounds
Low-priced shares reflect higher risk than high-priced securities. As a swing trader, you want to ride quick and strong trends up. Low-price stocks can interfere with that plan because they introduce new risks.
Cheap stocks are generally defined as those that trade below $5 per share in the United States. Many institutional asset managers can’t even purchase stocks below $5 because they’re widely seen as high-risk gambles. Stocks that trade below $5 often have low liquidity, which means one trade can heavily influence the price action in one day. So buying the breakout of a stock priced at $3 may turn out to be nothing more than a flash in the pan. (Note: What constitutes a low price depends on the country you’re trading shares in; in Australia, many stocks trade at 2 or 3 Australian dollars and are high quality companies.)
I usually don’t trade stocks below $10 per share and never below $5 per share (this applies to U.S. markets). These stocks are also more susceptible to manipulation (for example, via rumors in trading chat rooms).
To stay ahead of the game, avoid stocks below $5 per share with average daily trading value below $100,000 and market capitalizations below $300 million.
Limiting Losses at the Individual Stock Level
When you know how to determine how risky a stock is, you can use that information to guide how you manage its risk in the context of your portfolio. Managing risk at the individual stock level means making sure that no single position destroys your portfolio. Managing risk at the portfolio level means preventing several small losses from destroying your portfolio.
The way you manage risk at the individual stock level is through position sizing. And to set your position size, you have to know how much you’re willing to lose. That loss potential is directly related to the purpose of a stop-loss order, which ensures that should you be wrong — and you will be, many times — you can exit the position with (ideally) just a small loss.
Figuring out how much you’re willing to lose
Most professional swing traders limit the amount of loss they’ll tolerate from a single position to 0.25 percent to 2 percent of total capital. Remember: Your loss will be affected by commissions, slippage, and market impact (the possibility of your trade moving the stock price up or down). Therefore, it may be best to stick to a yardstick of 0.75 percent of your capital, anticipating that these other costs will likely push your total loss to 1.25 percent or so of your capital.
Before you even determine how much to invest in a security, you must first determine how much you’re willing to lose. If you agree with the 0.75 percent loss threshold that I recommend, simply take out a handy dandy calculator and compute:
0.75% × Your capital = Tolerable loss
If your portfolio is $50,000, the most you should be willing to lose on a single position is $375.
The amount you risk on a single position is different from the amount you buy or sell of that security. You may risk 1 percent or $1,000 (if your account value is $100,000) on a single position but end up buying $8,000 worth of that security. To achieve the risk of 1 percent, you must exit the position if the loss on the $8,000 reaches $1,000.
Setting your position size
You can position size either by applying a percent of capital approach (a constant rate of capital, say 5 percent) or by allocating new positions by a risk level you identify. Regardless of which strategy you pursue, make sure you include some discussion in your trading plan on how you determine the risk level.
By percent of capital
Setting your position size based on a percent of capital is the simplest way to allocate capital to new positions. For example, if you have an account worth $50,000 and select a 3 percent level of capital to invest in each security, you allocate $1,500 to each trade.
Many position traders (individuals with time horizons measured in months) invest an equal percentage of capital to each of their investments. As their capital base grows, they can invest more in each position. Conversely, as their capital base shrinks, they invest less in each position.
Ultimately, invest in ways you feel most comfortable with. However, I strongly advise against varying the percent of capital invested in new securities instead of using a constant percent of capital approach, because setting different percentages can result in random performance. Having a higher conviction in one trade (and thus allocating a higher percentage to it) may interfere with the success of your strategy if you’re a poor predictor of your own success. Trading doesn’t have to be complicated to be fun and profitable. Adding complexity where none is needed can lead to sub-par returns. If you want to vary your position size based on the attractiveness of the risk/reward present in the trading opportunity, skip to the next section.
 You won’t find a hard and fast rule when it comes to selecting a specific percentage level to use in setting position size. Choose a percentage level that’s too small (such as 0.5 percent), and hitting a home run won’t do much to boost your bottom line. But select a level that’s too large (such as 10 percent), and you could lose your shirt if the stock gaps down hard. Your stop-loss levels can only limit risk so much, and a security that gaps down will result in a loss larger than the 0.25 percent to 2 percent limit described earlier.
Use the following rules to help you set your percent of capital position sizing level if you decide to use this method (as opposed to the risk level approach described in the next section).
- Set a small percent of capital level (2 percent to 4 percent) if you trade securities that exhibit
- Illiquidity (remember, what’s liquid to you may not be liquid to a $1 billion investment fund; in other words, size matters)
- Low share prices ($10 or less is low)
- High betas (anything above 2.0)
- Small capitalization size (below $300 million)
- Set a large percent of capital level (4 percent to 8 percent) if you trade securities that exhibit
- Liquidity
- High share prices
- Low betas
- Mid and large capitalization sizes
After setting the percent of capital you want to allocate to your trades, you have to set your stop-loss level. This part is easy given that you’ve already calculated your threshold of tolerable loss (refer to the earlier section “Figuring out how much you’re willing to lose”). Set your stop-loss level at the price that would cause the loss on your position to equal 0.75 percent of your total capital.
Here’s an example of this process at work: Assuming an account value of $50,000 and a loss threshold level of 0.75 percent, the maximum loss you can tolerate on any one position is $375. You determine the time is right to buy shares in Dummies Corporation at $40 per share. You also decide to use a 6 percent of capital allocation approach to your swing trading. Where do you place your stop loss?
Your stop loss should be set at a price that yields a loss of $375. Investing 6 percent of your assets in Dummies Corporation means you’ll buy 75 shares:
6 percent × $50,000 = $3,000 ÷ $40 per share = 75 shares
To arrive at your stop-loss level, divide your loss threshold by the number of shares you buy; then subtract the result from your purchase price to get your stop-loss level:
- $375 ÷ 75 shares = $5
- $40 – $5 = $35 stop-loss level
By risk level
Setting your position size using a percent of capital method may seem arbitrary. After all, isn’t that saying that you have no idea which trade will be profitable and which one won’t be?
Technically, the answer to your astute question is yes; in effect, you’re saying that you have no idea which trade will be profitable. But then again, you wouldn’t be trading in the first place if you knew the trade wouldn’t be profitable.
A smarter method of setting your position size is varying it according to your desired exit level. In the example that I set up in the previous section, you compute an exit level strictly based on the price that would produce a loss of 0.75 percent of your capital. Alternatively, you can determine a key level at which you want to exit and then determine a position size based on that level. This is how most professionals swing trade. An arbitrary price may have no meaning ($35 in the previous example), whereas a specific price level may signal the end or beginning of a trend. I use a chart to illustrate how a specific level can help you determine a position size.
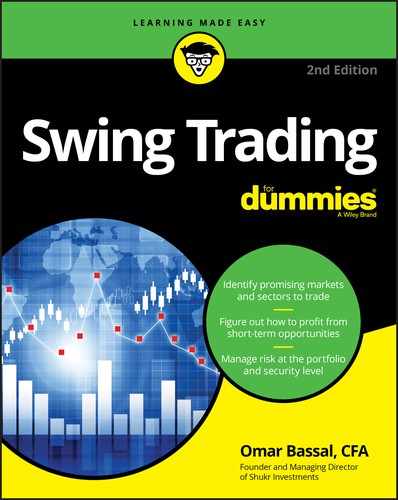
Figure 10-1 shows a chart of Alphabet Inc., commonly referred to as Google. Google’s shares have been consolidating and look ready to break out. Eager to make a quick buck, you decide to purchase shares.
Source: TradeStation Technologies
FIGURE 10-1: Assessing a chart can help you calculate how large a position to take.
Before you calculate how large a position to take, assess the chart. This daily chart shows Google’s stock price from early April through mid-September. Google’s stock rose strongly from mid-May through late July — up 22 percent in two months. However, a poor earnings report sent Google’s stock sharply down (and serves as a reminder that trading around earnings reports can be hazardous).
Pretend today is September 18, and you’ve decided Google is worth a swing trade. How much of your capital should you invest?
Setting your position size based on a risk level requires you to determine a price that, if reached, indicates that the trade has gone sour. Obviously, if shares fall to $460, you have a hint that something isn’t right. But that’s far too late — you need a more immediate warning sign.
Try using a previous swing low as a line in the sand for your stop-loss level. In this example, assume that the recent swing low highlighted in the chart is the level that, if reached, indicates that you’re wrong about the trade. That level is $505.
Google’s stock is trading at $545, and you’re willing to risk 0.75 percent of your capital on each trade. (Remember: 0.75 percent represents the loss you’re willing to tolerate from a position, not the maximum amount you’re willing to allocate to a single position.) To calculate how many shares of Google to buy, use this formula and plug in your numbers:
- Amount of capital at risk ÷ (Entry price – Stop-loss level)
- $375 (or 0.75% of $50,000) ÷ ($545 – $505) = 9.375 shares, or 9 shares
Thus, setting your position size based on your risk level means purchasing 9 shares of Google. (Round down when you have a fraction. Rounding up may mean adding more risk, whereas rounding down always keeps you below your specified loss threshold.)
This example brings to light one weakness of this approach: The closer the exit price is to your entry price, the larger the implied position. In fact, if your exit price is $1 or less than your entry price, the preceding formula may tell you to invest more than your total capital in one stock, which makes no sense!
The solution to this weakness is to put a ceiling on the amount you invest in any security. Colin Nicholson, a prolific swing trader from Australia, places a 6 percent ceiling on his trades. In the example, if you purchase 9 shares of Google at $545, you’re investing 9.81 percent of your $50,000 capital in one stock.
Although technically only 0.75 percent of your capital is at risk (if you place your stop loss), there’s always a chance that the stock will gap down and cause your loss to be much greater than your stop-loss order. Stop-loss orders don’t guarantee an exit at the price specified because there’s always the chance a security may gap lower.
Building a Portfolio with Minimal Risk
When you know the maximum amount of capital you want to allocate to a single position — based on the percent of capital approach or the risk level approach, covered in the previous sections — you’re ready to take a step back and see the forest for the trees.
The risk of focusing on individual securities at the expense of your portfolio is a simultaneous breakdown of several positions. If you have 25 positions in your portfolio, for example, and the amount at risk for each position is 1 percent, it’s conceivable (and almost anything can happen in financial markets) that all 25 positions will go against you at the same time and cause a major loss of 25 percent of your portfolio.
Don’t believe it can happen? Consider that U.S. equity markets dropped 22.6 percent on October 19, 1987 (during what had been a strong bull market). Few believed a move of that magnitude could happen in a single day. That loss actually exceeded any single-day loss experienced during the Great Depression.
External factors beyond anyone’s control can impact markets day to day. And it’s possible for a company you own shares in to announce a lawsuit or loss of a key customer, which could send the shares tanking in a heartbeat. To combat this risk, monitor the risk not only at the individual stock level, but also at the total portfolio level. This idea is no more complicated than others covered in this chapter. It just requires good record-keeping to execute fully.
Limit all position losses to 7 percent
The prudent approach to limit the losses from all your positions is to place a ceiling on the amount of capital you risk at any one time. Determine how much to risk on any single position — I recommend between 0.25 percent and 2 percent of total capital. The cumulative total of the amount at risk for each position is considered your total capital at risk.
I recommend limiting your total capital at risk to 7 percent. Doing so means that the most you could lose in a single day if everything were to go wrong is 7 percent. Of course, you shouldn’t set stop losses so close to your entry prices that they’re triggered frequently; that may be a sign you aren’t giving your stock room to fluctuate. A 7 percent level should rarely (if ever) be triggered because it would require all position stop losses to be executed on the same day.
The maximum amount you should risk in a single position, in my opinion, is 0.5 percent. This amount allows you to have at least 14 positions (0.5% × 14 = 7%). The larger the amount you risk on a single position, the fewer positions you can hold. And the fewer positions you hold, the higher the risk of your portfolio and the greater chance of a major account value swing that may be difficult to recover from.
To help you understand how this 7 percent rule works, consider an example: Trader Bob has constructed a portfolio of seven different positions that’s worth $50,609. Figure 10-2 shows, from left to right, the symbol of each of his positions, the current stock price for each of his positions, his entry price, the number of shares he owns, his stop-loss level (exit level), and his total amount at risk based on the specified exit level.

© John Wiley & Sons Inc.
FIGURE 10-2: Information from Trader Bob’s hypothetical portfolio.
The total amount of capital that Trader Bob has at risk based on this portfolio is 5.25 percent, found by summing up the Amount at Risk column. So Trader Bob can risk an additional 1.75 percent of his portfolio on new positions before he hits the 7 percent ceiling that I recommend. That 1.75 percent may be spread across five or more positions.
If you enjoy finding Waldo, you may have noticed that the amount of risk listed for shares of AAPL, or Apple Inc., is 0.00 percent. What gives? As a position moves in your favor, you can adjust the stop-loss price higher or lower, depending on the direction you’re trading. In this case, shares of AAPL were purchased at $140.92 and promptly began rising. After a nice gain, Trader Bob decided to raise his stop-loss level to his entry price level. Doing so meant he could risk more capital in other positions he owns. The assumed worse outcome from his position in AAPL is to break even (barring the stock price gapping down).
The amount at risk can never be a negative value, so don’t use negative risk amounts when you can raise your stop-loss order to a price that locks in a profit. If Trader Bob raises his stop loss to $150 in the future, his amount at risk isn’t –0.5 percent. Raising your stop-loss order ensures your portfolio doesn’t swing trade too aggressively and compensates for the inherent limits of stop-loss orders. After all, you may or may not get executed at your stop-loss price. So if a security gaps down below your stop-loss price, your stop-loss order will be executed at a much lower price than you anticipated.
Diversify your allocations
Another method of limiting losses on a portfolio level is diversification. No doubt you’ve heard the term thrown around on financial news networks. It seems every expert often recommends avoiding “putting your eggs in one basket.” Fortunately for you, this section gives you a bit more to go on than a farm analogy.
Diversification is one of the shining gems mined from academia. In a nutshell, investing in more than one company, industry, country, or trading vehicle helps protect you in the event that a problem befalls one or more of those holdings. The aim is to have a portfolio in which some securities’ gains offset other securities’ losses. The best scenario is simply a portfolio with all gainers, but in reality, some positions make money while others lose money.
At its simplest level, diversification can be seen as a tool of avoiding the problems of a single company. For example, you may buy shares in General Motors and Ford so that, if Ford takes a tumble, your shares in General Motors can offset your losses.
But what happens if a trade war brings down both General Motors and Ford? In that scenario, owning securities not in the auto business may be prudent. So you pick up shares of Nike and Amazon. But when the United States goes into recessions, shares of all your U.S.-based companies are likely to fall. That means you may want to be investing in Asia or Europe as well.
These examples give you an idea of the benefits of diversification. The simplest form of diversification is investing in several securities, but you also can diversify according to industry exposure, country, and asset class. I cover all three of these options in the following sections.
By number of securities
The most elementary way of diversifying your portfolio is simply to spread your assets across several securities. The more, the better — the thinking goes. But how many securities constitute a diversified portfolio?
The benefits of diversification can be realized with 10 to 20 securities, but I should warn you: This number assumes the companies are in different industries and countries. Investing in 10 semiconductor manufacturers doesn’t expose a portfolio to businesses outside of a small niche of the market.
Your trading plan should indicate a target number of positions you trade. The more positions you have, the less time you’ll have to devote to each single one and the more likely your returns will mirror the market. So keep your number below 20.
Following the position sizing guidelines outlined earlier in this chapter (see “Setting your position size”) largely takes care of this first point of diversification by number because the risk guidelines ensure that you have several positions. But if you’re going to brave the market without these guidelines, try to construct a portfolio of at least ten different positions and securities in different industries (see the following section for tips).
By industry exposure
According to William J. O’Neil, founder of Investor’s Business Daily, an industry group roughly determines 30 to 40 percent of a security’s return. So being exposed to only one or two industry groups is extremely risky because the returns of your securities will be very similar. Think about it in terms of the auto example from earlier in this chapter: Are the factors affecting General Motors and Ford all that different? Or United Airlines and Delta? Exxon Mobil and Chevron?
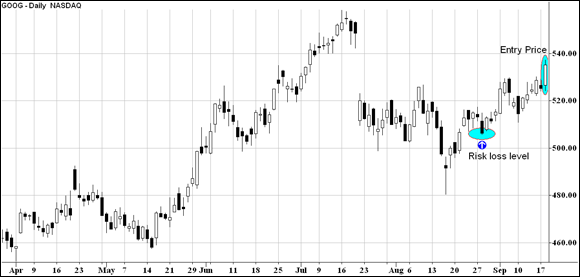
Figure 10-3 is an outline of the major industry sectors (as defined by the Global Industry Classification Standard, or GICS). Fortunately, the software services you use should break down the industry or economic sector that your securities belong to.
Source: MSCI
FIGURE 10-3: GICS sector classification.
There’s nothing wrong with concentrating in a few sectors — say four or five. But beware of investing in only one or two sectors because you won’t benefit from the diversification benefits inherent in investing in different parts of the economy.
Be sure to set a minimum number of industry groups that you trade in. I recommend identifying at least three different sectors and trading a minimum of five different industry groups, smaller classification groupings than sectors. For example, healthcare equipment, healthcare providers, and healthcare technology are all industry groups in the healthcare sector so investing across these three industries would not diversify your portfolio outside of the healthcare sector.
By asset class and country
Another way to diversify your portfolio is to invest in different asset classes and countries. The asset classes you trade decrease your overall portfolio risk, so if you’re using this approach, you should shoot to trade two to three different asset classes. Different countries exhibit different risk characteristics; I try to trade equities in at least two to three different countries.
Three vehicles for achieving diversification by asset class and countries are exchange-traded funds (ETFs), American Depository Receipts (ADRs), and Real Estate Investment Trusts (REITs):
EXCHANGE-TRADED FUNDS (ETFS)
ETFs have exploded in growth over the last few years with assets topping $4 trillion. ETFs are funds that represent baskets of securities — such as a basket of stocks in the same industry, a basket of commodities (such as energy or agricultural commodities), or a basket of foreign equities (listed in Mexico, Brazil, China, or Turkey, among many others). Trading ETFs helps diversify your portfolio across several securities in one sector or country. For example, you may be right on a substantial move in oil stocks, but you may select the one oil company that’s having problems.
Buying an energy ETF (such as the iShares US Energy ETF) allows you to profit from the movement of several energy stocks. Purchasing one ETF is like instant diversification across a style or sector of the market. However for investors who are socially responsible and care about environment, social, and governance issues, keep in mind that an ETF doesn’t allow you to exclude companies that fail to meet specific socially responsible guidelines. Therefore, you’re best off investing in individual stocks that do meet your guidelines.
Sometimes there’s a bull market in commodities whereas stock markets are lagging. So various asset classes can provide a boost of returns in addition to lower risk. Here are some of the main ETFs that offer you exposure to commodities:
- Precious metals: Gold can be traded via SPDR Gold Shares Gold (symbol: GLD in the United States); silver can be traded via iShares Silver Trust (symbol: SLV). If you’re interested in metals and mining, you can swing trade the SPDR S&P Metals & Mining ETF (symbol: XME).
- Energy: Your options for trading energy ETFs include Energy Select Sector SPDR (symbol: XLE). Or you can trade energy stocks that rise and fall with the price of oil. Energy exploration and production companies especially track changes in crude oil and natural gas prices.
- Agricultural commodities: Many ETFs give you exposure to agricultural commodities such as timber (symbol: WOOD) or fertilizers and agricultural chemicals (symbol: VEGI).
I don’t recommend trading ETFs that track currencies because currencies aren’t a recommended investment (given that nearly all currencies are fiat, meaning they only hold value because the government says so; over time, currencies lose value because of inflation).
AMERICAN DEPOSITORY RECEIPTS (ADRS)
ADRs allow you to take advantage of strength (or weakness) in a company based outside the United States without ever leaving home. Currently, the fastest growing markets are in China, India, and Africa.
Mixing international securities into your portfolio offers greater diversification benefits than having only U.S. stocks because international markets may zig when the U.S. market zags. The more technical explanation of the benefit of ADRs is that foreign securities have lower correlation ratios to the U.S. market than domestic securities. Of course, the currency of those foreign markets may also improve (or hurt) your returns. To find a list of international equities, check out www.adr.com/investors/markets.
REAL ESTATE INVESTMENT TRUSTS (REITS)
A REIT gives investors access to several properties — apartment complexes, office buildings, healthcare facilities, and even infrastructure, such as data centers where the cloud is stored or cellphone towers. REITs must distribute at least 90 percent of income to shareholders. Hence, they tend to have high dividend yields. Real estate can behave differently than other market segments because it tends to have higher dividend yields, lower beta, and is sensitive to unexpected changes in interest rates.
Planning Your Exit Strategies
Your exit strategy dictates when you’ll exit a security. Some swing traders believe that an exit strategy is more important than an entry strategy, and I agree wholeheartedly.
Believe it or not, a trader can generate healthy profits by randomly entering securities if he or she has an exit strategy that lets winners run and cuts losers fast.
Sometimes you’ll exit for profits, and other times you’ll exit for losses. Of course, the most desirable exit strategy is exiting for profits. The next desirable option is exiting because of the passage of time with small profits or small losses. The least desirable exit strategy is exiting for losses at your stop-loss level. You’re more likely to exit due to profits or because of a stop loss — and less likely to exit due to the passage of time.
Exiting for profitable trades
Stop-loss rules are your way out when a trade goes bad (more on that topic later in this chapter). But what should you do when a trade turns out right?
There are three major ways to exit profitable trades: by a predetermined profit target, by a predetermined price target, or by swing lows/highs.
Predetermined profit target
A predetermined profit target is the easiest method of taking profits off the table. When you enter your trade, you set a specific gain (usually expressed in percentage terms) that you seek and then take your money off the table after that gain has been achieved.
Swing traders shouldn’t set unreasonable profit targets; your profit target is a function of your time horizon. Because swing traders’ horizons can vary from a few days to a few weeks, your profit target may range from the low single digits to the low double digits. If you’re active in the markets and trade often, then your profit target should be modest — closer to 5 percent. However, if you prefer to hold your swing trades for a few weeks, then a 15 percent or 20 percent profit target is attainable.
Some professional swing traders exit in stages. For example, they may sell 50 percent of their position after a security has risen 10 percent in price. Then they may ride the rest of the position until there’s a technical breakdown or change in fundamentals. The advantage of exiting in stages is that you lock in profits early. A security that rises 10 percent and then falls back to your entry price results in a 0 percent return if you failed to take profits on its way up.
Exiting in stages may improve your returns, but it also requires more work. There’s more record-keeping, for example, if you exit in stages versus exiting in one go. You also generate more commissions (unless the commission is based on a fixed percentage or cents per share), more work keeping track of open positions where you’ve taken partial profits, and so on. Make sure that your strategy fits your work ethic and time commitment to the market.
Predetermined price target
A predetermined price target is an alternative way to take money off the table. In this case, you set a specific target based on the chart or the fundamentals of the company.
In the case of technical alert criteria, you may set your profit target equal to a prior swing high or swing low. Securities tend to find resistance and support at price levels achieved in the past, so you may set your target on the basis that the security will reach that prior peak. (I cover how to determine technical alert criteria in Chapters 4 and 5.)
In the case of fundamental criteria, you may set your profit target equal to a price multiple of the security — a price multiple based on earnings, sales, and so on (see Chapter 9 for more on the different price multiples). For example, if you suspect that Booking.Com (symbol: BKNG) shares should be trading for a price to earnings (P/E) ratio equal to Expedia’s (symbol: EXPE) shares, then your price target would be equal to Expedia’s P/E ratio multiplied by Booking.com’s trailing earnings. (I cover fundamental analysis in detail in Part 3.)
One word of caution: Don’t set price targets equal to round numbers or whole dollar amounts (like $35, $80, or $120). Many novice traders set their price levels in the same area, which may prevent the security from reaching that price. For example, if you buy a security and expect the stock to face some headwind when it reaches $50, place your limit order to sell shares at $49.83 or a level nearby. Traders who place their limit orders right at the level of resistance and at a round number often are left with unfilled orders.
Swing lows/highs
Swing traders often use prior swing lows as reference points on when to jump ship from a profitable investment. A breakdown below a low may signal the beginning of a new downtrend.
This strategy differs somewhat from the predetermined price target I explain in the preceding section. In that strategy, you set a price target of when to take profits off the table. In this case, however, you use prior swing lows and highs as reference points for when to exit. If you own shares of a security, this strategy calls for putting a stop-sale order below a recent swing low. In contrast, a predetermined price target calls for placing a limit-sell order when the security reaches the area you expected.
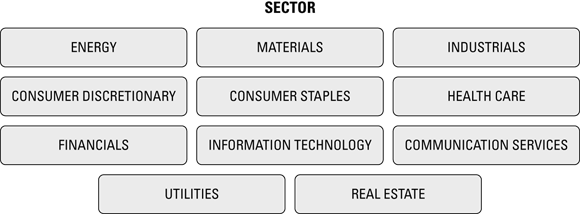
Figure 10-4 shows Exxon Mobil (symbol: XOM) from July through October. It illustrates how a predetermined price target differs from exiting on a swing low or high.
Source: TradeStation Technologies
FIGURE 10-4: This chart of XOM shows how you can plan your exit based on previous swing highs.
In the case of buying shares of Exxon Mobil, you may have set a sell limit order near the prior high of $94 (but not at $94 — use a price below that and not a round number).
Contrast the Exxon Mobil exit to the strategy of placing a stop sell order below prior swing lows in the chart of Sigma Designs, Inc. (symbol: SIGM), shown in Figure 10-5. It shows that by placing a sell stop order below prior swing lows, you can stay in a strong trend longer and reap a larger percentage of the move.

Source: TradeStation Technologies
FIGURE 10-5: Placing stop-loss orders below swing lows helps you stay in strong trends and get out of lagging ones.
Taking cues from technical signals
In addition to taking profits based off of swing lows, you can take profits based off of technical signals. When using technical signals (flip back to Chapter 5 for a refresher on the various technical indicators), ensure that some crystal clear trigger or catalyst is present that leads you to take profits.
Some examples of selling strategies for profits include:
- Exiting when shares close below a moving average (for example, an 18-day moving average)
- Exiting when the MACD line crosses below the signal line
- Exiting when –DMI crosses above +DMI
- Exiting when prices break an uptrend line
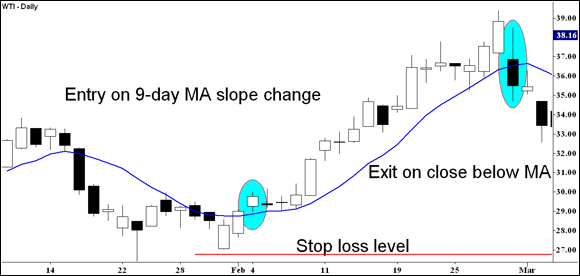
Consider Figure 10-6, which highlights how a swing trader may have taken profits in a trade of shares of W&T Offshore (symbol: WTI). A swing trader may have purchased shares on the turn-up of the nine-day moving average shown in early February. So when should you exit? One possibility: Exit when share prices close below the nine-day moving average. The potential profit — assuming entry and exits near the closing prices on the days highlighted, and exclusive of commissions, taxes, and slippage — is 19.18 percent over 18 days. The stop-loss level (which I delve into in the later section, “Exiting based on a stop-loss level”) should be placed below a recent swing low but not exactly at the low or exactly at a round number.
Source: TradeStation Technologies
FIGURE 10-6: Taking profits based off of a technical signal in shares of WTI.
Exiting based on the passage of time
A time trigger exit is sometimes necessary when a position you trade meets neither its profit target nor its stop-loss exit for several days or weeks. But because your capital shouldn’t be tied up in a position that isn’t generating profits, I must cover the rare but possible exit based on the passage of time.
Perhaps you bought at the wrong time, or an event you expected to occur didn’t materialize. In any case, a security that meanders sideways is tying up your capital. You’re better off exiting the security and having cash at your disposal should an opportunity present itself.
As with other aspects of swing trading, there’s no hard and fast rule on what constitutes sufficient time for a position to make a move. If you trade often with a time horizon measured in days, you should give a position up to a week to make a move. However, if you’re a swing trader who goes for larger moves that unfold over a few weeks, you may give a position more time (one month for example).
Exiting based on a stop-loss level
Wouldn’t it be nice if your only decision was when to take a profit off the table? “Hmm … should I leave with a 10 percent gain or wait for a 15 percent gain?” Alas, you don’t always have this luxury.
Many times you’ll be faced with the prospect of exiting a position at a loss. Although it may be difficult to admit you were wrong, you have to get used to it if you’re going to be a swing trader. The most common way you’ll exit losing positions is through a stop-loss level.
Technically, a stop loss can be mental or physical:
- A mental stop-loss level is a price level you keep in your own records but only submit to your broker when the security has reached that price level. The advantage of using a mental stop-loss level is that you may avoid a whipsaw — being forced out of a position due to a short but violent move down.
A physical stop-loss order is an order you submit to your broker the second your entry order is executed. When you enter a stop-loss order (which should be submitted “Good till cancelled” so that it doesn’t expire after one day), your order is visible to other traders, so it’s possible for them to move prices to take out your order.
Although this risk exists, I can’t stress enough the importance of using physical stop-loss orders entered with your broker for the first few years you swing trade. You expose yourself to the risk of a whipsaw, but you also avoid the risk of failing to exit when a security’s price moves fast and furious (furiously, for all you English majors). Physical stop-loss orders are also a must when you’re traveling or unable to watch the market on an hourly basis.
Stop-loss orders should be entered around some major support/resistance level or technical level. If you own shares of a position, your stop-loss order should be below the entry price and entered as a sell order.
The following techniques for setting stop losses only apply to swing traders who set their positions based on a risk level. Swing traders who set their position sizes based on a percent of capital approach automatically determine a stop-loss level based on their loss threshold level. Swing traders who set their position sizes based on a risk level, however, should understand the different methods of selecting a risk level.
Stop loss based on a support/resistance level
This first approach to setting your stop-loss level is straightforward. By examining a chart, you should be able to determine levels of support and resistance that, if broken, would signal the end or beginning of a trend. Your job, should you choose to accept it, is to identify a level that’s most applicable to you.
To simplify matters, suppose you’re interested in buying a security. Your stop-loss level should be based around a major support level (preferably, right below that support level). A three-year-old support level isn’t going to have significant relevance most of the time (an exception being if the support level was tested several times during those three years).
In general, a support level is significant the
- More recent it is
- More often it has been tested
- Closer it is to a significant price level ($100, $10, $50, and so on)
- Heavier the volume is on the formation of the support level
Choose important support levels so that you only exit a position when a trend change is most likely. Choosing a weak support level may cause you to exit a position prematurely.
Stop loss based on a technical level
You may exit a position based on a signal from a technical indicator. Dozens of technical indicators can be plotted on a chart, and when one of those indicators gives a signal, an informed swing trader exits.
Technical indicators can be tricky. Just because your technical charting program may have 101 different technical indicators developed by individuals I won’t name here (because I don’t know their names) doesn’t mean you need to use all 101 indicators in your strategy. In fact, professionals often use only a few indicators to make their decisions. Why not use all the bounty with which you’ve been bestowed?
As it turns out, all technical indicators are based on one or two inputs: price and volume. Consequently, there are only so many ways you can peel an onion before you realize those tears are coming out no matter what you do. You don’t get a performance boost from using ten indicators; instead, you get ten people telling you largely the same thing.
Stop-loss orders are sometimes used in conjunction with moving averages. Some swing traders place stop-loss orders right below a major moving average and adjust the order every day or two. Others who use mental stop-loss orders may wait for a security to close below a moving average before taking action to enter an order with their broker.
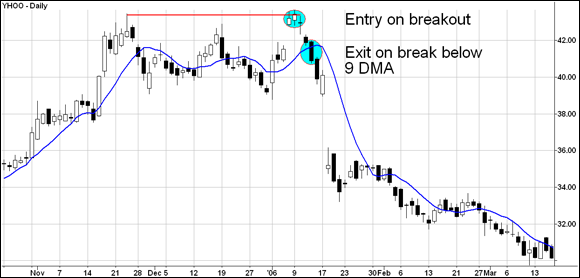
Figure 10-7 shows a stop-loss order executed based on the nine-day moving average (DMA). A gap up in shares of Yahoo! (symbol: YHOO) in January seemed to be a prelude to a strong uptrend. However, shares of Yahoo! quickly reversed. Setting a stop loss based on a support level may have exposed you to the violent fall, whereas a stop loss based on the moving average would’ve given you an earlier exit.
Source: TradeStation Technologies
FIGURE 10-7: A stop-loss order for YHOO, based on the nine-day moving average.
A stop-loss order can be based on actual signals from a technical indicator (such as MACD). The downside to using such orders is that delays can result. You don’t know for sure what price a security must reach before an indicator will signal its flashing red lights. Using an indicator like a moving average, which is actually plotted on the chart, is helpful because you can identify a specific price before the signal is given.