Chapter 11
Knowing Your Entry and Exit Strategies
IN THIS CHAPTER
![]() Getting to know how the market works
Getting to know how the market works
![]() Identifying key entry and exit orders for your swing trades
Identifying key entry and exit orders for your swing trades
![]() Figuring out how to place orders whether swing trading is your hobby or your living
Figuring out how to place orders whether swing trading is your hobby or your living
Trade execution is the home stretch of swing trading. If you’ve dotted your i’s and crossed your t’s, then how you execute your swing trade is unlikely to spell the difference between success and failure. Still, you should perfect entering your orders as much as possible so that you aren’t burned by a security that’s in the process of reversing direction or purchasing at a much higher price than necessary. Perfecting your order entry largely means knowing what type of order to enter, a factor that’s mainly dependent on whether you’re a full- or part-time swing trader. If you’ve done your homework, though, your execution strategy should emphasize entry with the flow of the market.
If you’re a full-time swing trader or you execute trades during market hours, you have more order types at your disposal than if you’re trading part-time. You also have the opportunity to use a couple of helpful tools to refine your trades: intraday charting and Nasdaq Level II quotes. In recent years, major brokers have introduced advanced order entry systems, allowing individuals to enter similar order types as large institutional traders. I cover algorithmic orders in this chapter.
This chapter also outlines the major order types and tells you which ones you should use most, depending on your situation. Furthermore, I explain how to make the most of intraday tools to refine your swing trading.
If you’re a part-time swing trader, you should follow a different entry strategy than your full-time counterparts. But never fear! This chapter outlines the unique considerations you face when entering and exiting positions.
Understanding Market Mechanics
Understanding the mechanics of the underlying markets is essential to knowing when to enter or exit an order. On a basic level, you need to understand that securities have bid prices (where you can sell) and ask or offer prices (where you can buy). Both the bid and ask have a number of shares associated with them. For example, the bid may have 100 shares associated with it, indicating you can sell 100 shares at that price. But who’s buying and selling these securities to you?
Dealers who make markets in certain securities are called market makers. Market makers are often decried as evil geniuses who control security prices. In all honesty, they aren’t geniuses … or evil creatures. They’re just ordinary folks who make markets, which means providing liquidity for investors by buying and selling securities for their own accounts and for customer accounts.
From the market maker’s perspective, a bid is where she is willing to buy the security, and an ask is her offer to sell the security at that price. Market makers offer a certain amount of stock on the buy and sell sides. So if a market maker is offering 2,000 shares of Danaher at $75.23 and you enter a market order for 2,500 shares, your first 2,000 will be executed at $75.23. However, the remaining 500 shares may be executed at a higher price. A thinly traded stock may have 2,000 shares available at $75 per share and 500 shares available at $76. A 2,500 share “market” order in such a stock would fill at $75 and $76.
 When a security has great market depth (many orders on the buy and sell side), plenty of shares are available for buying or selling. When a security has shallow depth, few shares are available. Certain order types (such as a market order; see “Living life in the fast lane: Market orders,” later in this chapter for more on this type) in a security with shallow depth may move it significantly — at least for a little while.
 Because certain order types can move prices significantly in thinly traded securities, you want to stick to actively traded securities. You don’t want to expose yourself to significant liquidity risk. Swing traders normally generate alpha, or outperformance, in the quality of their buys and sells, not in their ability to correctly estimate the mispricing of liquidity risk.
If a security has a wide spread, you can enter a certain order type (specifically a limit order, explained later in this chapter) to buy or sell at a price between the bid and the ask. When market makers receive your order (and assuming the price of your order is better than what’s offered in the market), they have two options: They can execute the trade at the specified price (or a better one), or they can place your order as the best bid or offer.
Suppose you want to buy shares of fictitious company Wide Spreads Inc., and the bid/ask spread is $17.50/$19.25. (For now, ignore the fact that as a shrewd swing trader, you’d never transact in a security with such a wide spread.) If you enter a buy limit order for $18.25 ($1 less than the current asking price), the company’s market maker must either execute your order or make your order the new bid. So either you’ll receive an execution or the new bid/ask spread will be $18.25 to $19.25. Someone entering a market sell order will be executed at your bid, and your buy order will be filled.
 When I first learned that I could affect bid/ask spreads, I entered orders left and right just to see my order come up on top. I don’t recommend this tactic, because your orders may actually be executed.
Surveying the Major Order Types
In order to efficiently enter or exit a position on a security you want to swing trade, you need to get acquainted with the major types of orders. These order types are available to anyone buying securities — whether you’re a long-term investor, day trader, or swing trader. But swing traders may use certain order types more than other kinds of traders or investors do.
Orders can be good until cancelled (GTC), which means the orders stay live until they’re executed or you cancel them, or good until the day (GTD), which means the orders remain open until the market closes.
The following sections describe the four major types of orders and when you want to use them.
Living life in the fast lane: Market orders
Get me in and get me in now. That’s the mantra of the market order, an order that instructs your broker to buy or sell a security immediately, regardless of price. Market orders are useful when urgency to enter a security based on a particular chart pattern or technical indicator abounds (turn to Chapters 4 and 5 for a refresher on how to read charts and indicator signals) or an event or news announcement leads to a major move in the stock price.
What might cause a swing trader to want to enter a position quickly? Consider the case of DexCom (symbol: DXCM), a manufacturer of continuous glucose monitors for patients with diabetes. In early 2019, DexCom announced preliminary earnings that blew past consensus earnings estimates. A market order would have been an appropriate order type to quickly enter the position given DexCom’s high liquidity.
Market orders can also come in handy when exiting a very liquid position. When there are many shares on the bid and ask sides of the market, you’re unlikely to receive an execution price different from where the security’s currently trading.
I caution you against using market orders when entering a position. I’m more likely to use one to exit a position instead of entering one. Never, ever enter a market order when the markets are closed, because a security may gap higher or lower at the next day’s open and result in an execution you don’t want.
Market orders should only be used by full-time swing traders.
Knowing your boundaries: Limit orders
Limit orders instruct your broker to buy or sell a security at a specific price or a better one. Better, of course, depends on the direction of the trade. The better price is lower when you’re buying and higher when you’re selling.
I’m a big proponent of limit orders. Even when the current price of a security is agreeable to you, and a market order may make sense, a limit order protects you from being on the receiving end of a price execution that’s significantly above or below the current market price.
Part-time traders can analyze markets after the close and enter limit orders for the following day. After you receive confirmation that the limit order has been executed, you should enter a good until cancelled stop-loss order with your broker.
Calling a halt: Stop orders
A stop order specifies that you enter or exit a position after the security’s price reaches a predefined level. Two types of stop orders exist:
- Sell-stop orders: A sell-stop order instructs your broker to sell shares of a security at a pre-set price if the security reaches that price or a lower one. Sell-stop orders are useful to protect your capital.
- Buy-stop orders: A buy-stop order instructs the broker to buy a security if its shares trade at or above a predefined price level. Consider employing buy-stop orders when you identify a key price level you want to buy at if the security trades up to or above that key price level.
Both types of stop orders become market orders when the price in question is reached. Note, however, that because they become market orders (which instruct a broker to execute a trade immediately), you may receive a price that’s worse or better than the price you specify.
Mixing the best of both worlds: Stop limit orders
Think of a stop limit order as a combination of a stop order and a limit order. When your predefined price is reached, the stop limit order becomes a limit order to ensure you don’t execute at a price that’s significantly different from what you expected. You shouldn’t mind not getting filled if you haven’t entered the security yet or if you’re simply trying to maximize profit. But when matters are growing ugly, you can’t afford for an order not to execute because it became a limit order.
You should only use a stop limit order when entering a security or for entering an order to take profits. Don’t use a stop limit order as a stop-loss order, because the limit part of the order may prevent a timely exit when things are turning sour.
Just for kicks, say you decide to buy shares of Twitter that have been in a range between $15 and $20. Suppose you enter a buy-stop order of 1,000 shares at $20.29 — so you can enter a position after shares break above their trading range. If Twitter reports blockbuster earnings one day and shares open at $30 per share, you’ll own 1,000 shares at $30 or so. However, you’ll have increased your position size by 50 percent because of the gap. The original order would’ve bought $20,290 worth of stock. The actual order buys $30,000 worth of stock.
The solution to this conundrum is a stop limit order. Had you entered a stop limit order of $20.29, the stop order would’ve become a limit order after shares traded at or above $20.29. A buy limit order at $20.29 wouldn’t have been executed if shares were trading at $30.
New order types: Algorithmic orders
A few brokers now offer individuals the option of executing trades using algorithmic trading. Think of these as advanced technology to upgrade your order type.
Algorithmic trading is most useful for executing a large order over time. If you had an extremely large order and needed to execute it over a few hours, breaking it into small chunks which you send to the market over time to hide the true size of the order is helpful (otherwise, other traders will push up or down prices if they know a large order is being executed).
Algorithmic orders allow for price improvement (meaning, executing at a better price) and can automatically execute an order over a period of time so you don’t have to be in front of the screen checking every price movement.
Many different algos (short-hand for algorithmic orders) exist on the market, so here I cover the three major types:
- Percentage of volume: This order type allows a user to buy or sell a security over a period of time without exceeding a specific percentage of the overall volume. For example, an order to purchase 10,000 shares with a maximum percentage of volume of 30 percent would engage the algo to buy shares in increments without your order ever presenting more than 30 percent of the volume after placing the order. This allows a large order to be executed without impacting the price significantly.
- VWAP order: The volume weighted average price (VWAP) represents the average. (For example, a 10,000 share transaction at $20 per share is weighted ten times more than a 1,000 share transaction at $20.) The VWAP algo seeks to execute your order as close as possible to the VWAP from the time you enter the order until the market close.
- Implementation shortfall: This algo attempts to achieve a better price execution by increasing a trader’s participation (for example, portion of volume) when the price moves in your favor (for example, price falling when you’re buying or rising when you’re selling) and decreases a trader’s participation when the stock moves out of favor (for example, price rising when you’re buying or falling when you’re selling). Don’t use this algo when you’re exiting a stock for risk management purposes.
Part- or full-time swing traders can use algos. These types of orders can materially improve the price you receive on your order because it’s like having a full-time trader with you helping you achieve the best execution.
Ask your broker if he offers algo trading.
Placing Orders as a Part-Time Swing Trader
Having a full-time job doesn’t preclude you from swing trading. You just need to carefully craft your order-entry system to account for the uncertainty of how security prices will perform when the market opens the following day.
One of the keys to mastering order entries and exits is to execute only on the day after a trading signal — likely a chart pattern, a news event, or a technical indicator. Never initiate just because an entry signal exists today but was first generated a few days or weeks back. If your entry method calls for buying stocks when the slope of the nine-day moving average turns up, don’t buy a security with a nine-day moving average slope that turned up last week.
The next two sections break down how you can enter and exit a security as a part-time swing trader.
Entering the fray
A limit order is your primary entry weapon as a part-time swing trader (unless you have access to algo trading types — in that case, use an algo with a limit order attached, such as percentage of volume). If a buy signal appears on a particular day, you can review the day’s price behavior and determine where to place a reasonable limit buy order. Be choosy. If your limit order isn’t filled, no big deal. Plenty of fish are in the sea — just wait for the next one. By not desperately chasing after the security, you can enter trades on your terms when prices come to you.
You don’t want to trade the opening of a market. This is a chaotic time when news that emerged after the market closed the previous day is reflected in opening share prices. There can be major swings, both positive and negative.
Never, never, never — did I say never? — enter a market order when the market is closed. Doing so can only cause grief and heartache. A market order entered after the market closes is executed at the following day’s opening price — regardless of what that price is. Because movements can be fierce at the opening, you can’t enter market orders the previous day due to the uncertainty of where the price executions will occur. Even if you want to buy shares at the price they closed at the prior day, a market order may be executed significantly above or below that price, depending on prevailing market conditions (that is, how many market orders exist, the distribution of buys and sells, and the market maker’s own share inventory). Always keep in mind the ol’ Wall Street saying: “Amateurs trade the open. Professionals trade the close.”
Exiting to cut your losses (or make a profit)
Exiting a swing trade is another matter. Unlike entering, where patience can pay dividends, exiting should be done quickly and judiciously. Why? Because you usually exit a position for one of two reasons — either your profit target was hit or an indicator flashed an exit signal. When either of these scenarios occurs, don’t sit around to see what other traders will do.
When you exit for a loss, you want out at the available price. That’s why I recommend that part-time swing traders use stop-loss orders, which automatically convert into a market order when the specified price level is reached. As a part-time swing trader, you should also use trailing stop-loss orders. These are stop-loss orders that are raised over time as the trade goes in your favor. Raising these orders protects your profits (unless the security gaps through the stop loss).
When you’re exiting for a profit, you can be a bit more patient than when exiting for a loss, but you need to ensure you exit that same day to avoid market risk the following day (for example, the risk of where the price will move the next day).
Placing Orders if Swing Trading’s Your Full-Time Gig
If you’re a full-time swing trader, you have more tools at your disposal. Because you can watch the market during the day, you can use market orders judiciously when you see there are sufficient shares to fill your order at the offer or bid (meaning you know what price you will be receiving). Don’t enter a market order where there is shallow depth and your price will be executed beyond the current bid-ask spread. If you have access to algo orders, use them.
The following sections lay out how to set up your trading system as a full-time swing trader and how to put various tools to use to make your job easier.
Considering the best order types for you
Like your part-time counterparts, you can plan to rely on limit orders for entries and stop-loss orders for exits if you’re a full-time swing trader. However, because you spend more time swing trading, you have the luxury of choosing how you enter trades depending on the overall market environment. Rarely is a security so hot that you absolutely need to execute a market order. More often than not, you can size up the market and enter a limit order near a recent intraday support or resistance level.
You want to execute an order entry or exit only on the day of a trading signal, which pops out at you with the help of chart patterns or technical indicators. My best trades are those generated when I receive an alert for a signal I set up days, weeks, or even months ago for a security that looks promising as soon as a price level is reached or an indicator generates a signal. Whatever you do, ensure you’re always executing orders for trades that have just generated a signal.
Taking advantage of intraday charting to time your entries and exits
As a full-time swing trader, you can improve your trading results by applying an intraday trading overlay, which is a system of entry based on intraday charting, to your existing entry plan. After a trading signal is generated on a daily chart, you can zoom in on a 30-minute or 1-hour chart and time your entry based on a technical indicator (see more on that later in this chapter). Sometimes, this trading overlay can help you avoid buying securities that are about to reverse course. Other times, the intraday trading overlay helps you receive better prices on your trades. Of course, it’s also possible that the trading overlay could result in paying worse prices if a security is in a strong trend. There are no free lunches in trading.
For example, you may purchase shares on the day (or the day after) the MACD indicator generates a buy signal, provided that certain intraday charting signals are also met. This second step filters out securities that may be showing strength on a daily chart but weakness on an hourly or 30-minute chart.
I don’t think an intraday trading overlay is absolutely essential to swing trade successfully, but it can improve your returns if used intelligently. The system’s intention is to improve your entry or exit price by analyzing the prior days’ support and resistance levels and reading the signals generated by the technical indicators. If a buy signal is generated on a daily chart but you see weakness in the intraday chart — for example, a head-and-shoulders chart pattern or a 17-hour moving average that has turned down — then the prudent course of action is to wait for the intraday chart to stabilize and rebound before entering. Occasionally, the intraday trading overlay keeps you out of a security that’s in the process of tanking.
Selecting the appropriate time frame
Most real-time charting programs allow you to analyze 1-minute, 5-minute, 10-minute, 30-minute, and 1-hour charts. That’s an awful lot of time frames. If a technical indicator looks negative on one intraday time frame, a naïve swing trader may turn to a different intraday time frame to see whether that indicator gives the signal he or she wants. After all, charts, like statistics, can be tortured into telling you what you want to hear.
Always be consistent in the time frames you use (such as daily and hourly, or daily and 30 minutes). I recommend sticking to one intraday time frame because doing so simplifies matters and avoids the temptation of flipping through time frames to see which one is giving you the signals you want to see.
Personally, I prefer a 30-minute or hourly chart. I feel that charts covering shorter periods of time belong in the day trader’s arena, because the shorter the time period, the more meaningless price movements. You want to trade short but powerful trends that are driven by some fundamental reason — not by the fact that some pension fund’s liquidating shares to deliver a retiree a lump-sum payment.
Choosing your entry criteria
Intraday charting systems can be as varied as systems based on daily price data. An hourly or 30-minute chart may call for entry based on one of the following criteria:
- A moving average crossover
- A moving average convergence/divergence (MACD) buy signal
- A breakout out of a consolidation phase
- A new hourly bar high
You may base your entry signals on a technical criterion identified above or on some different technical criteria of your choosing. Just don’t base your entry criteria on chart patterns. I’ve found that chart patterns formed over a few hours aren’t as reliable as those formed over several weeks or months.
Balancing the advantages and disadvantages of intraday trading signals
Your biggest advantage as a full-time swing trader over a trader who can’t watch the markets throughout the day is the ability to enter an order as soon as a trading signal appears. This advantage is even greater in securities that tend to be volatile. By paying attention to the signals generated through your intraday charting system, you can enter earlier than traders who rely on end-of-day data.
Yet this blessing can easily become a curse, because trading signals generated intraday can be reversed intraday. In such cases, you may need to exit your position because the original reason for entering was reversed.
One way to mitigate the risk of an intraday trading signal reversal is to execute orders in the last hour of the trading day.
Investigating who’s behind the bidding: Nasdaq Level II quotes
Nasdaq Level II quotes, posted prices that show you who’s bidding for and offering shares of the security you’re about to enter, are more of a staple for day traders, but they may be helpful in your full-time swing trading arsenal. They allow you to quickly see the relative positioning of orders by market makers. Generally, Nasdaq Level II quotes are only available for securities trading on Nasdaq and can be obtained from most brokers and real-time charting programs. You may also be able to get Level II quotes for international securities.
The following sections help you dive into the nitty-gritty of Nasdaq Level II quotes.
Contrasting Level I and Level II quotes
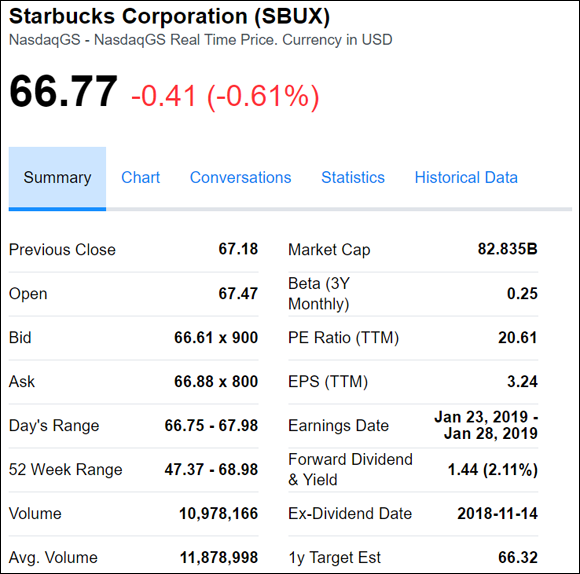
Level I quotes (think of them as the standard quotes you receive from your broker or on Yahoo! Finance or Google) report what the current bid and ask prices are. They also include how many shares are being bid and how many shares are being offered. But don’t expect any bells or whistles. A Level I quote, like that shown in Figure 11-1 of shares of Starbucks (symbol: SBUX), shows top-level data that can be helpful as a snapshot.
Source: Yahoo! Finance
FIGURE 11-1: A Level I quote of Starbucks.
Nasdaq Level II quotes give traders a wealth of information on order and trading activity in Nasdaq-listed securities. Whereas a Level I quote tells you what the best bids and offers are, Level II quotes tell you who else is bidding or offering shares away from the market (that is, at prices above the best offer and below the best bid). This information can be valuable in discerning short-term price movements.
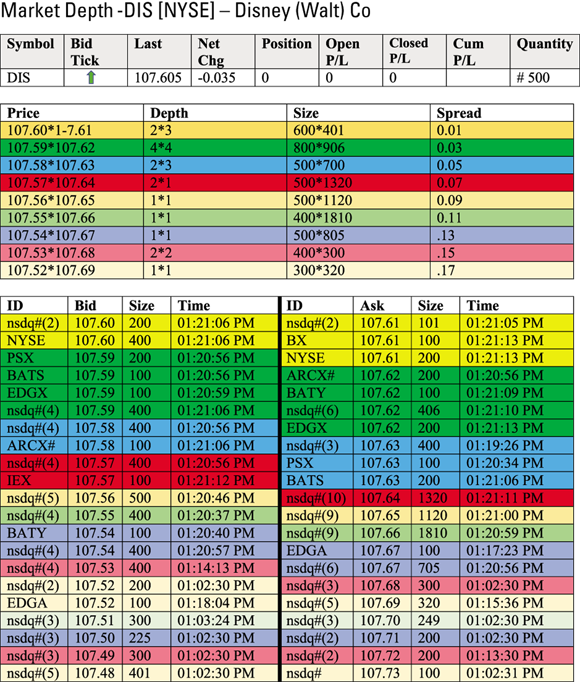
Figure 11-2 shows a typical Level II quote. You can see that different market makers are offering to buy (left side) and sell (right side) shares of Walt Disney (symbol: DIS). Notice that at each price, a market maker offers a certain amount of shares (shown here as size). The number of market makers offering shares on both the buy and sell sides at very close prices indicates that this security has significant market depth.
Source: TradeStation Technologies
FIGURE 11-2: A Level II quote of Walt Disney indicates sizable market depth.
Avoid thinking that Level II quotes confer some type of trading advantage. Other swing traders, day traders, institutional traders, and the like have Level II quotes. The key is how you use the quotes. As a swing trader, you must recognize that you won’t derive a significant source of alpha, or outperformance, from your near-term trading by using Level II quotes. You can, however, improve your entry and exit prices and add a small amount of return during the course of a year — for example, by waiting to place an order as soon as there are sufficient shares to absorb your purchase or sell order without moving the price.
Your intraday trading overlay may rely on Level II quotes as opposed to technical signals generated on an hourly or 30-minute chart though the intraday charting is far superior to using Level II quotes.
I used to think that having Level II quotes somehow gave me an advantage over the common man — like I was going to improve my trading game with a tool akin to X-ray vision. Don’t buy into that idea like I did. Level II quotes are a short-term guide — and I mean short. Day traders derive more value from Level II quotes than swing traders because their time horizons are measured in minutes. Of course, I don’t mean you should ignore the Level II quote screen. Just consider placing more emphasis on intraday charting (covered earlier in this chapter).
Evaluating the quotes
Level II quotes have a couple of salient features. First, bids and offers for securities are separated into two panes. The left pane displays various market makers’ bids to buy at various prices, and the right pane displays the offers to sell by various market markers at various prices. Confused? Take a look back at Figure 11-2.
The left side of the pane shows that two institutions bidding a total of 600 shares of Disney at $107.60. This means that if you wanted to sell 600 shares at market, you could sell them at $107.60 and the two institutions would buy your shares. They could have larger order sizes behind the 600 shares on display or those 600 shares may be the only shares bid at $107.60.
Below those two orders, you can see four institutions bidding $107.59 for 800 shares. Notice that there are significant shares and bidders at every price level, indicating how deep this market is. Some of the institutions bidding and offering shares for sale are electronic communication networks (ECNs), which you can read more about in Chapter 1.
If you look at the right pane of Figure 11-2, you can see that three institutions are offering 401 shares for sale at a price of $107.61. Notice that the spread between the bid and ask is razor thin — a difference of one penny. That’s indicative of a very liquid stock. The swing trading stocks you encounter more often than not won’t have such razor thin spreads, especially in international markets.
Below those 401 shares offered at $107.61 are 906 shares offered for sale at $107.62. So, if you placed a market order to buy 1,307 shares of Disney, you would purchase 401 shares at $107.61 and 906 shares at $107.62. The average price of the purchase would be $107.6169.
Verifying the accuracy of quotes with the Time & Sales report
Market makers and other institutional traders play games to cover their true intentions on how many shares they’re bidding on or offering for sale. They realize that if they show their hand too much, then traders will react to that information and make their lives more difficult. Your task is to determine whether their stated intentions are consistent with their actions.
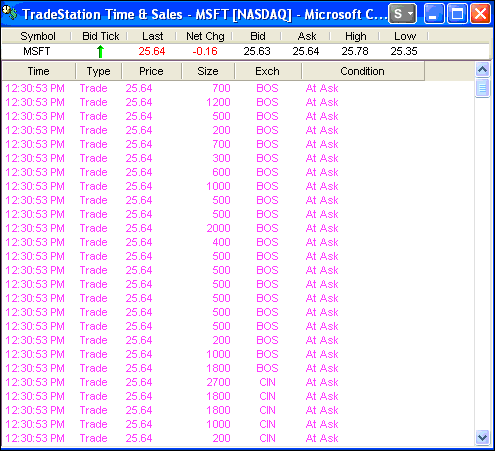
The Time & Sales report (shown in Figure 11-3 for shares of Microsoft and available from most brokers and real-time charting packages) shows the actual buys and sells that occur during the trading day. In Figure 11-3, you can see the time each trade was executed, what size of order was executed, and whether the order was executed at the bid price, ask price, or in between the bid and ask price.
Source: TradingSim.com
FIGURE 11-3: Use the Time & Sales report to compare actual trades to market makers’ supposed intentions.
Sometimes market makers try to deceive other traders on what their intentions are and whether they’re aggressive buyers or sellers in the market — or whether they’re indifferent. So keep an eye on the Time & Sales report, and monitor whether trades are being executed at the asking price, the bid price, in between the bid and ask, or outside of the bid or ask.
The Time & Sales report is helpful when used in conjunction with the Level II quote screen, which shows posted prices by market makers, because the Time & Sales report shows actual trades. These facts help tell you whether market participants are bluffing. For example, a market maker may post a large sell order on behalf of a client so as to scare others into selling to him or her at lower prices. Using the Time & Sales report and Level II quote screens together can tell you whether
- Buyers are more aggressive than sellers: This scenario is likely the case if there are major buyers on the bid with large share sizes, and the shares offered on the ask side are small in comparison. If the Time & Sales report shows executions at the ask price (or above it), you have confirmation that buyers are more aggressive.
- Near-term price pressure is coming: This situation tends to happen if large share sizes are being offered on the ask by multiple market makers, and the share sizes offered on the bid are small. Confirm price weakness with the Time & Sales report where trades should be occurring at or below the bid price.
In fast-moving markets, the Time & Sales report moves quickly. Trades may occur at the bid, at the ask, in between the bid and ask, or outside the bid and ask. In such situations, reading signals can be challenging. That’s where the intraday chart can help you more than the Level II quotes.