
3
Tribological Behaviors of Glass Fiber with Fillers Reinforced Hybrid Polymer Composites
T. P. Sathishkumar
Kongu Engineering College, Department of Mechanical Engineering, Erode, 638060, Tamil Nadu, India
3.1 Introduction
Synthetic fibers and fillers are extensively used as good reinforcement materials in various polymeric composites. Prodigious reinforcing materials along with synthetic fibers are abundant sources of natural fillers to produce hybrid fibers reinforced polymeric composites. The synthetic fibers are classified into glass, kevlar, and carbon fibers. They have high strength, stiffness, length‐to‐weight ratio, and good fire resistance. These fibers are high in cost and cause pollution when they are brought out. The various fillers are graphite, silicon graphite, polyetheretherketone, polymers, and silicon carbide, which when gently mixed with fibers reinforced composite help increase the mechanical properties. Over the last two decades the usage of fillers in glass fiber polymeric composites has widely increased and this reduces the weight and cost of industrial products. In fact, they have many advantages such as light weight, low cost, high specific strength, better insulation, and flexibility [1]. The study of mechanical and tribological properties of fillers and glass fiber reinforced polymer composites is essential for optimizing filler parameters such as filler diameter, filler volume and weight fractions, and matrix content. The concepts of “green tribology” are introduced by the World Tribology Congress (WTC). The aim is to save energy and materials by introducing new equipment in the market that reduces the need for fossil fuels. In order to meet the WTC concepts, fillers are introduced in glass fiber polymer composites [2]. Tribological study on the new materials is essential to satisfy the needs of real‐time applications.
Machine and structural failures occur frequently because of the sliding of components due to adhesive or abrasive contact, which results in loss of more material. This situation is so critical that it needs investigation on the friction and wear behaviors of fillers in glass reinforced polymer materials. This investigation is normally carried out on the wear test rig in the laboratory before the material is used in applications. Tribo properties such as rate of wear, specific wear rate, and coefficient of friction (COF) are investigated by varying test parameters including counterpart materials, velocity and distance, applied normal loads, testing environments, and testing orientations with respect to orientation of reinforcements. Glass fillers reinforced hybrid composites are prepared by various preparation methodologies [1] such as the injection molding process, compression molding process, and vacuum molding process.
3.2 Wear and Mechanisms of Wear
Wear is the loss of material that takes place because of different reasons. The mechanism of wear differs for different materials. In order to enhance the life of a material, the wear mechanism should be studied with different forms of wear. They are adhesion, abrasion, delamination, surface fatigue, and tribochemical reaction wear. Usually, physical and chemical wear takes place by contact of two bodies. Major wear and friction behaviors are examined by the following two wears.
3.2.1 Adhesion Wear
The two surfaces mate to generate high pressure, which leads to the formation of a cold weld at junctions due to the plastic deformation of bodies. Then the surfaces begin to move against each other, which leads to material loss at the junction if the material has higher shear strength leading to less wear.
3.2.2 Abrasive Wear
Abrasive wear is common for all forms of wear and constitutes 63–73% of wear for all industrial components. The surface of the material wears against the hard counterface, which leads to material loss based on the nature of the interface. There are two types of abrasive wears such as two body and three body abrasion. The two hard surfaces slide to form two body abrasive wear (Figure 3.1a). For example, the automobile break pad dry‐slides on the break drum for braking and the two gears mate together. This wear occurs through single pass and multi‐pass of the material surfaces. Normally, the wear rate is lower in multi‐pass than in single pass. When the hard particles slide as well as roll in between, the two hard surfaces form three body abrasive wear (Figure 3.1b), and the rate of wear in this mechanism is lower than that in two body wear. Therefore, 90% of the wear occurs by rolling contact than by sliding.

Figure 3.1 (a) Two body and (b) three body abrasive wear.
3.3 Tribo Wear Test Methods
Wear and friction tests are conducted using various testing methods according to international standards and industrial needs.
3.3.1 Wear and Friction Test Using Pin‐on‐disk
The pin‐on‐disk (POD) or block‐on‐disk (BOD) tribo testing machine is shown in Figure 3.2 [3]. The test specimen is fitted into a vertical specimen holder. A dead weight is added on the specimen holder, which is the normal applied load of the wear test. The specimen holder with specimen is kept on a rotating counterface, which is made up of stainless steel and is rotated by an electric motor. A long beam has the specimen holder at the left end and weight balance at the right end; it is pivoted on a machine structure between the two ends. The wear test was carried out according to ASTM G99‐05 standard. The hybrid composite specimen of 10 mm × 10 mm × 20 mm was fitted into the specimen holder and placed on the rotating counterface. The counterface velocity and sliding distance were varied according to the material and the environmental conditions. The wear and friction behaviors were measured from the experiments.
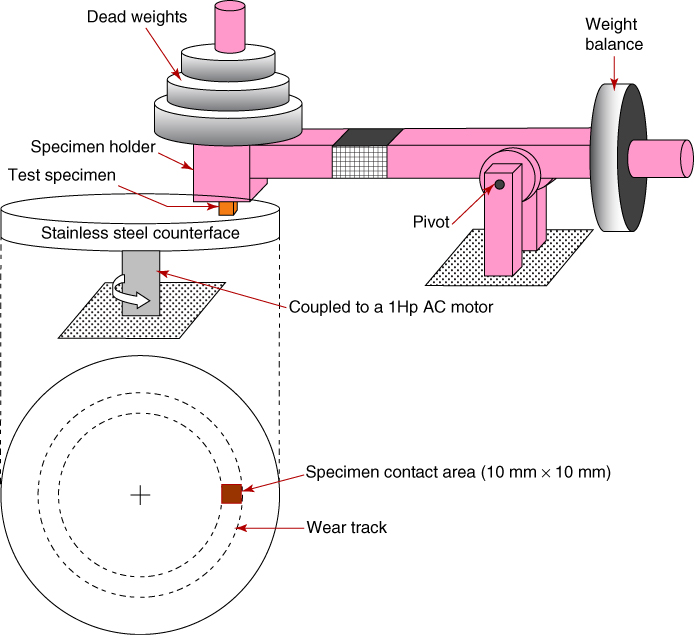
Figure 3.2 Schematic of the pin‐on‐disk tribo test machine.
The COF (μ) was calculated using Equation 3.1. It is the ratio of the measured frictional force to the normal applied load. The measured friction force and applied normal load are expressed in newton.

The weight loss for each specimen was measured before and after the wear test using a 0.1 mg digital weight indicator. The specific wear rate (Ws) was calculated using the following relation (Equation 3.2).
where
| Ws | = | specific wear rate (mm3 N−1 m−1) |
| WI | = | initial weight of the specimen (kg) |
| WF | = | final weight of the specimen (kg) |
| ρ | = | density of the composite (kg mm−3) |
| FN | = | normal applied load (N) |
| D | = | sliding distance of specimen (m) |
3.3.2 Wear and Friction Test Using Ball‐on‐disk
The schematic of a BOD tribo testing machine is shown in Figure 3.3 [4]. The metal ball is made of steel, stainless steel, chromium, aluminum alloy, etc. and is fixed at the bottom side of the ball holder, which acts as the counterface (i.e. counterpart). The beam consists of the ball holder at the right end where the normal load is applied on it for tribo test and the balance load at the left end. The beam is pivoted on the machine structure column. The wear specimen is kept on the rotating holder, which is controlled by an electrical motor. During testing, the static metal ball is placed on the specimen. By varying testing parameters such as sliding velocity of the specimen, sliding distance, and normal load, the specimen is rotated on the steel ball surface and then the frictional force is measured. The tribo testing machine has a multi‐channel electronic unit and is connected to a personal computer (PC) for data acquisition.

Figure 3.3 Schematic of the ball‐on‐disk tribo testing machine.
Source: Thongsang et al. 2012 [4]. Reproduced with permission from Elsevier.
3.4 Tribo Characterization Hybrid Polymer Composites
3.4.1 Polyamide 6 and HDPE Glass Fiber Reinforced Hybrid Composites
Polyamide 6 (PA6) and high density polyethylene (HDPE) are blended with the help of maleic anhydride modified polypropylene (MAgPP) as a compatibilizer [5]. The MAgPP added is 5 wt%. The blender is prepared by mixing the PA6 and HDPE in the ratio of 80 : 20 wt%. Glass fibers of 5, 10, and 15 wt% are added to the polyblend to prepare the glass fiber hybrid composites. The glass fiber is 17 μm in diameter and 5 mm in length. Initially, the polymers and compatibilizer are dried at 85 °C for 2 days to avoid the effect of hydrolyzing and plasticization. The dried polymers are carefully mixed and put on the hopper in an extruder machine. They are extruded through a twin screw extruder barrel at various heating zones of 180, 235, 240, 245, and 240 °C respectively to prepare the cylindrical rods. The extruded rods are quenched in water and pelletized. The reciprocating screw injection molding process (IMP) is used to make composite samples from the polyblend pellets for tribology testing. Moreover, the glass fiber (GF) is added with polyblend pellets during IMP to prepare glass fiber reinforced hybrid composites samples. The barrel temperatures of the injection molding machine are 215, 220, and 240 °C at the three zones, and 230 °C at the nozzle. The mold temperature is 90 °C.
Composite pins of 6 mm diameter and 16 mm length are taken for friction and wear test using the POD machine. Before the test, the wear surface of the pins is abraded using a 600 SiC grade sheet. This will ensure maximum contact between the pin and the counterface. The counterface disk material is AISI 02 tool steel with 75 mm diameter and 5 mm thickness. This may be abraded using 350 SiC grade sheet to maintain a surface roughness of 0.10–0.11 μm. The counterface is rotated by an electrical motor with sliding velocity of 1 m s−1 and applied load of 19.6 N. The wear track diameter is 65 mm.
Figure 3.4 shows a plot of the COF and wear loss versus sliding distance of 80 wt% PA–20 wt% HDPE polyblend with and without GF in hybrid composites. The COF have some variations in the beginning stage of sliding. The pure polymer shows reduction in COF with sliding distance. The addition of 5% GF to the composite shows higher COF when compared to 10% and 15% GF. The composites with 10% and 15% GF have steady state wear up to 5 km sliding distance. However, there are no significant changes in 0% GF reinforcement. But the COF and wear loss are low for 10% GF hybrid composites. Figure 3.5 shows the worn surface morphology. Figure 3.5a shows that the transfer film forms on the steel counterface, and this formation is uniform and thin. This may avoid aggressive damage of the pin surface and reduce the wear rate. Figure 3.5b shows the wear track of the polyblend with 15% GF reinforced hybrid composites on the counterface. The transfer film is formed with shiny spots. It shows the presence of glass fibers in transfer materials. The presence of 15% glass fiber in the polyblend slightly increases the rate of wear. But polyblend with 5% and 10% GF shows lower wear rate as compared to control and that with 15% GF.

Figure 3.4 (a) The coefficient of friction and (b) wear loss for 80 wt%/PA–20 wt% in HDPE polyblend with GF.
Source: Palabiyik and Bahadur 2002 [5]. Reproduced with permission from Elsevier.

Figure 3.5 Optical micrographs of the steady‐state transfer films formed by 80 wt% PA6/20 wt% HDPE polyblend with the compositions (a) PA6 and HDPE and (b) 15% GF.
Source: Palabiyik and Bahadur 2002 [5]. Reproduced with permission from Elsevier.
Solid lubricants such as polytetrafluroethylene (PTFE) and ultra‐high molecular weight polyethylene (UHMWPE) are taken to prepare the glass fiber reinforced PA6 composites [6]. The weight content of glass fiber and PA6 is 15/85%. The glass fiber with different solid lubricants is mixed and extruded in twin screw extruders to prepare the pellets. The processing temperature in extruder barrels is 210, 220, 230, and 240 °C respectively at nine zones. The prepared pellets are injection molded to prepare the samples. BOD machine is used to perform the tribological behavior tests (Figure 3.3). The diameter of the chromium ball is 9.5 mm and it act as the counterface. The sample dimensions for wear test are 25 × 25 × 15 mm3 and it is fixed in tribo machine fixture. Before the test, the specimen surfaces are cleaned ultrasonically with acetone. The tribo test is conducted with two loads (40 and 100 N) and velocities (200 and 1500 rpm). The COF is calculated using Equation 3.1 and the wear rate (mm3 N−1 m−1) is calculated using Equation 3.3.

where
| B | = | the trace of friction (10 mm) |
| r | = | the semi‐diameter of the chromium steel ball (mm) |
| b | = | the width of the wear trace (mm) |
| L | = | the load (N) |
| d | = | the sliding distance (m) |
Figure 3.6 shows the differences in friction coefficients and wear rate for two different solid lubricants presented in the GF/PA6 composites at testing parameters of 40 N and 200 rpm. The pure PA6 composite has 0.2111 μ and 2.769 wear rate. The figure shows that the incorporation of glass fiber in the PA6 with solid lubricants can reduce the friction coefficients and increase the wear resistance. Incorporation of PTFE in the composites gradually decreases the friction coefficient and wear rate. The best tribo properties occur in GF/PA6 composites with 20% PTFE. By reducing the glass fiber fracture a low friction coefficient can be obtained. A third body transfer film is formed on the counterface by wearing of PTFE. During the sliding process, the banded crystalline PTFE can easily transfer due to low surface energy when compared to PA6 transfer. In addition, PTFE molecule chain breakage takes place in the chemical bonds of C─C or C─F. The breakage of C─F bond generates F‐ions, which will react with the counterface to form a strong transfer film. Hence, the reduction in rate of wear occurs because of difficulty in breaking the formed transfer film. In Figure 3.6, the wear coefficient and wear rate are continuously increased by incorporating the UHMWPE in GF/PA6 composites. The UHMWPE solid lubricant does not show a positive effect on tribological properties because weaker interfacial adhesion occurs between the PA6 and UHMWPE, and it leads to more fracture of glass fibers. The high level of fiber debris disrupts the soft transfer film formation on the counterface. This may increase the wear rate and friction coefficient. Figure 3.7 presents the effects of friction and wear properties of both solid lubricants incorporated in GF/PA6 composites. The solid lubricants are loaded at 15 wt%. There are some beneficial impacts on the friction coefficients but not much improvement on wear rate. Overall, the GF/PA6 composite with 12 wt% PTFE/3 wt% UHMWPE shows the lowest friction coefficients, but the wear rate is slightly higher than that with 15 wt% PTFE alone. Increasing the PTFE proportion improves the wear and friction properties, and the combination of both solid lubricants exhibits better wear results than UHMWPE alone. Therefore, the removal of PA6 is reduced during tribo test with incorporation of PTFE. This occurs through some important mechanisms such as material transfer, viscous flow of polymer, and fatigue wear. The very high bonding that exists between PA6 and PTFE hampers materials transfer.

Figure 3.6 Friction coefficient and wear rate of GF/PA6 composite by varying (a) PTFE and (b) UHMWPE (testing parameters: 40 N and 200 rpm).
Source: Li et al. 2013 [6]. Reproduced with permission from Elsevier.

Figure 3.7 (a) Friction coefficient and (b) wear rate of GF/PA6 composite with both PTFE and UHMWPE (testing parameters: 40 N and 200 rpm).
Source: Li et al. 2013 [6]. Reproduced with permission from Elsevier.
3.4.2 Silicon Carbide, Graphite Particle, and Glass Fiber Reinforced Hybrid Composites
The 7‐mil E‐glass fiber fabric and fillers of SiCp (15 μm) and Gr (15 μm) powders are used to prepare the hybrid composites using the hand lay‐up method, followed by compression molding process [7, 8]. These fillers are selected because they can withstand high temperatures, form thin transfer films, and have low thermal expansion. The epoxy resin (LAPOX L‐12) and hardener K‐6 are used as matrix and hardener. The fillers are thoroughly mixed in epoxy with hardener before being poured on the glass fiber fabric in the mold. The mixing ratios of compositions are presented in Table 3.1. The composite plate is prepared with dimension of 250 mm × 250 mm × 3 mm. A diamond tipped cutter is used to cut the wear test samples from cured laminated hybrid composites to about 6 mm × 6 mm × 3 mm size. The dry sliding wear tests are performed using a POD machine. The counterface material is alloy steel of 8 mm thickness and 165 mm diameter. The surface roughness of the counterface is 1.2 μm. A wear track diameter of 130 mm is used to perform the tribo behavior tests. Before the test, the sample surface is rubbed over a 600 grade SiC sheet.
Table 3.1 Composition details for composite preparation.
Basavarajappa and Ellangovan 2012 [7]. Reproduced with permission from Elsevier.
| Specimen code | Epoxy volume (%) | Glass fiber volume (%) | Fillers | |
| Silicon carbide | Graphite | |||
| A | 50 | 50 | — | — |
| B | 40 | 50 | 5 | 5 |
| C | 35 | 50 | 10 | 5 |
The effect of sliding velocities on wear rate for various compositions of glass fiber reinforced epoxy composites is shown in Figure 3.8. Increasing the sliding distance increases the wear rate while incorporation of fillers in composites reduces the wear rate. Plowing and asperities are the major actions on the worn surfaces. This could affect the wear behavior. In experiments, the poor conductivity of epoxy can increase the interface temperature at higher sliding speeds. This temperature could melt the polymer and form a molten thin film on the interface. It can affect the interfacial bonding between the fiber and the matrix at the junction and reduce the wear rate as well as propagation of crack on the subsurface. The higher thermal conductivity and thermal expansion properties of fillers can have superior wear resistance compared to pure glass and epoxy, as shown in Table 3.2. Incorporating the lower thermal conductivity filler up to 10% can increase the rate of wear slightly when compared to equal percentage of fillers reinforcement.

Figure 3.8 Specific wear rate against various sliding velocity of fillers and glass fiber reinforced epoxy composites (testing parameter: 60 N and 3000 m).
Source: Basavarajappa and Ellangovan 2012 [7]. Reproduced with permission from Elsevier.
Table 3.2 Thermal property of the composition.
Basavarajappa and Ellangovan 2012 [7]. Reproduced with permission from Elsevier.
| Materials | Thermal conductivity (W m−1 K−1) | Thermal expansion (×10−6 K−1) |
| Silicon carbide | 3.8 | 7.6 |
| Graphite | 25–470 | 1.2–8.2 |
| Epoxy | ~0.45 | — |
Initially, the specific wear rate is found to be high for all composites at 20 N (Figure 3.9). If the applied load is increased up to 40 N, the specific wear rate falls because of change in wear process. Then the minimum wear rate occurs at 60 N and it increases again when the applied load is increased. The specific wear rate increases owing to the adhesive wear mechanism occurring on the counterface when more epoxy comes in contact during initial running. Subsequently, an equal amount of fillers in the composites shows low wear rate because both fillers are hard to wear simultaneously. Figure 3.10 shows a plot of the sliding distance against wear rate. The unfilled glass fiber epoxy composite shows higher wear rate than the fillers reinforced composites. The formation of air bubbles and voids is unavoidable in unfilled composites because a viscous flow of matrix occurs in sliding. The combined effects of fillers in composites can reduce the voids and also increase the wear resistance. The presence of SiC particle enhances the adhesion, which reduces the matrix wear. At higher loads, the epoxy is softened by releasing additional frictional heat, thereby loosening the SiC particles. These SiC particles and the formed graphite film are removed from the specimen surface layer, and this forms a thin transfer film on the counterface. It exhibits high lubricity in a collective manner. This film can reduce the frictional heat and the damage to epoxy, glass fibers, and their bonding.

Figure 3.9 Specific wear rate versus various applied load of fillers and glass fiber reinforced epoxy composites (testing parameter: 5.44 m s−1 and at 3000 m).
Source: Basavarajappa and Ellangovan 2012 [7]. Reproduced with permission from Elsevier.

Figure 3.10 Specific wear rate against various sliding distances of fillers and glass fiber reinforced epoxy composites (testing parameter: 5.44 m s−1 and at 60 N).
Source: Basavarajappa and Ellangovan 2012 [7]. Reproduced with permission from Elsevier.
Basavarajappa et al. [8] investigated the effect of graphite filler contents on weight loss in glass fiber reinforced epoxy composites, as shown in Figure 3.11. The initial weight of the pin was measured by using a digital electric balance machine before tribo tests. The least count of the machine was 0.0001 g. At the end of the experiment, the pin was again weighed in the machine and differences between the two weights were taken as weight loss of the pin, and then the outcomes were plotted as weight loss against sliding distance and applied load against sliding distance. Figure 3.11a shows the weight loss of unfilled and filled glass fiber composites at a constant applied load of 60 N and sliding distance of 3000 m. It is clear that weight loss decreases with increase in graphite, but it increases with increase in the sliding velocity from 2.27 to 8.16 m s−1. The fiber and matrix wear debris are well spread on the counterface up to a sliding distance of 6.8 m s−1 due to a low degree of fiber breakage. If the sliding distance is increased to 8.16 m s−1, the matrix face has greater wear and a high degree of fiber breakage is observed, leading to more wear debris formation on the counterface. Similar trends are also observed on varying the applied load (Figure 3.11b). Weight loss slowly goes up till 60 N for both 5% and 10% filled glass–epoxy composites, but identical weight loss is found for both filled composites. With further increases in load up to 100 N, the highest weight loss is observed for all composites. Applied load up to 80 N shows good spread of debris due to matrix wear, and also less wear debris is formed on the counterface. It affects the change of wear. At applied load 100 N, a few discontinuous glass fibers and void formation are seen on the surface of the pin. This could increase the weight loss. Weight loss increases linearly with sliding distance (Figure 3.11c). Extreme weight loss is found for the composite containing 10% graphite.

Figure 3.11 Weight losses versus wear testing parameters: sliding velocity, applied load, and sliding distance.
Source: Basavarajappa et al. 2009 [8]. Reproduced with permission from Elsevier.
Figure 3.12 shows the effect of graphite filler on wear rate and μ of glass fiber fabric reinforced epoxy composites at constant sliding distance (1.2 km) and disk velocity (5 m s−1) [9]. Perhaps the applied loads and graphite weight contents have synchronized effects on specific wear rate and μ of the composites. Increasing the applied load increases the wear rate due to more graphite fillers coming out from the surface. However, a lower wear rate is found for composites containing 3% of graphite. Maximum wear rate is observed for 9% graphite composites at 90 N load. Also, the COF increases with increasing the graphite filler up to 6% and then a decreasing trend is observed at 9% graphite filler. At higher loads, the formation of thin film on the counterface can act as lubricant and it reduces the COF for all composites. The wear morphology of 3% graphite containing glass fiber composites at different applied loads is shown in Figure 3.13. It is clear that the wear loss of 3% graphite loaded composites is found to be less at 30 N when compared to higher loads. This is proved by the worn surface morphology; Figure 3.13a shows that part of the glass fiber appears on the worn surface. But at a higher load of 90 N, the surface damage is observed in two areas, fiber–matrix interface and matrix regions. Therefore, heavy damage occurs on the glass fiber as shown in Figure 3.13c.
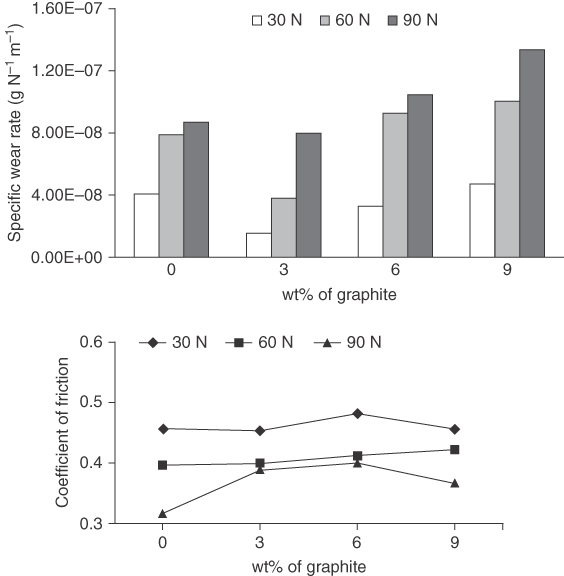
Figure 3.12 Specific wear rates and coefficient of friction of pure and graphite filled glass fabric reinforced epoxy composites (normal applied loads 30, 60, and 90 N).
Source: Shivamurthy et al. 2013 [9]. Reproduced with permission from Elsevier.

Figure 3.13 Worn surface morphology of 3% graphite filler containing glass fiber composites at applied loads of (a) 30 N, (b) 60 N, and (c) 90 N.
Source: Shivamurthy et al. 2013 [9]. Reproduced with permission from Elsevier.
3.4.3 Case Study
PA66 and glass fiber are used to prepare PTFE polymer journal bearing [10]. The dimensions of the counterpart and journal bearing are given in Figure 3.14. The counterpart is made of DIN 52100 steel and is mounted on the shaft in the test apparatus. The LPV journal bearing apparatus is used to measure the COF and surface temperature against sliding distance. Two counterparts are prepared to minimize the heating effect on the surface. The specimens are cleaned before and after test by methyl alcohol and they are dried in an oven at 80 °C for 1 h. The PTFE bearing is prepared by three different compositions, PA66, PA66/18% PTFE, and PA66/20% glass fiber/25% PTFE. These are fitted in the polymer journal bearing montage shown in Figure 3.15.

Figure 3.14 (a,b) Dimensions of the bearing and the counterpart.

Figure 3.15 Polymer journal bearing montage.
Figures 3.16 and 3.17 show plots of the friction coefficients and contact temperature against sliding distance of all specimens. The friction coefficients and contact temperatures of all specimens exhibit increase on increasing the sliding distance and velocity. During experiments, the accumulated heat on PA66 and PA66 + 18% PTFE specimen surfaces is not distributed. Then the friction coefficients of these specimens are higher when compared to the PA66 + 20% GFR + 25% PTFE journal bearing. The glass fiber journal bearing has high thermal conductivity, which makes for better heat transmittance and decreases the friction coefficients. The PTFE has poor thermal conductivity; use of glass fibers in PTFE composite improves the properties by incorporation of higher thermal conductivity materials. The PTFE prevents the plow out of glass fiber on the counterface, which forms a film layer. As result, the glass fibers in journal bearing show better wear behaviors than others.

Figure 3.16 Plot of the friction coefficient and contact temperature versus sliding distance of journal bearing at 0.5 m s−1 and 0.238 MPa.

Figure 3.17 Plot of the friction coefficient and contact temperature versus sliding distance of journal bearing at 1 m s−1 and 0.238 MPa.
3.5 Conclusion
The influence of various fillers with glass fiber reinforced polymer composites on wear behavior has been extensively discussed. POD and BOD experiments were used to calculate the weight loss, specific wear rate, and friction coefficient by setting various testing parameters. The parameters varied were applied normal load, sliding velocity, and sliding distance. Addition of fillers in the glass fiber composites heavily affected the wear behaviors. Wear and weight loss increased with increase in the applied load, velocity and distance. But incorporation of fillers in glass–epoxy composites lowered the wear characteristics. This may be due to formation of a thin transfer film and more wear debris on the counterface. So the graphite filler is a suitable material for the development of glass fiber reinforced polymer composites for various products.
References
- 1 Sathishkumar, T.P., Satheeshkumar, S., and Naveen, J. (2014). Glass fiber‐reinforced polymer composites – a review. Journal of Reinforced Plastics and Composites 33 (13): 1258–1275.
- 2 Nirmal, U., Hashim, J., and Megat Ahmad, M.M.H. (2015). A review on tribological performance of natural fibre polymeric composites. Tribology International l83: 77–104.
- 3 Nirmal, U., Low, K.O., and Hashim, J. (2012). On the effect of abrasiveness to process equipment using betel nut and glass fibres reinforced polyester composites. Wear 290–291: 32–40.
- 4 Thongsang, S., Vorakhan, W., Wimolmala, E., and Sombatsompop, N. (2012). Dynamic mechanical analysis and tribological properties of NR vulcanizates with fly ash/precipitated silica hybrid filler. Tribology International 53: 134–141.
- 5 Palabiyik, M. and Bahadur, S. (2002). Tribological studies of polyamide 6 and high‐density polyethylene blends filled with PTFE and copper oxide and reinforced with short glass fibers. Wear 253: 369–376.
- 6 Li, D.‐X., You, Y.‐L., Deng, X. et al. (2013). Tribological properties of solid lubricants filled glass fiber reinforced polyamide6 composites. Materials and Design 46: 809–815.
- 7 Basavarajappa, S. and Ellangovan, S. (2012). Dry sliding wear characteristics of glass–epoxy composite filled with silicon carbide and graphite particles. Wear 296: 491–496.
- 8 Basavarajappa, S., Ellangovan, S., and Arun, K.V. (2009). Studies on dry sliding wear behaviour of graphite filled glass–epoxy composites. Materials and Design 30: 2670–2675.
- 9 Shivamurthy, B., Udaya Bhat, K., and Anandhan, S. (2013). Mechanical and sliding wear properties of multi‐layered laminates from glass fabric/graphite/epoxy composites. Materials and Design 44: 136–143.
- 10 Demirci, M.T. and Duzcukoglu, H. (2014). Wear behaviors of Polytetrafluoroethylene and glass fiber reinforced polyamide 66 journal bearings. Materials and Design 57: 560–567.