It is not uncommon for a developer to eagerly start to write a code, then to realize the brilliant idea that just came to your mind. You quickly implement the basics of the program and add functionalities one by one, each time running the code to check if it works as you wish. So far so good, but eventually you come to the point when adding additional functionality breaks existing functions for no obvious reason. Suddenly, your fast development stops because instead of coding you are reviewing sources and adding printouts, wherever possible, to get an idea what could have gone wrong.
Does that sound familiar? Well, you are not the only one who faces such problems. Luckily there are some well-known techniques to speed up investigation of the problem, and make it as less painful as possible. These techniques are logging and debugging.
The concept of logging is similar to adding printouts to your code, but in a more ordered and unified way. At runtime, the logging subsystem produces information, commonly referred to as logs or traces, which are basically a record of program flow. Such a record can be saved to a file, written directly to the console, emailed to a specified address, or used in some other way. It is up to you how many logging entries you put in your code. It may seem to be a waste of time in the beginning, but at the end you will either add them anyway, or abandon your project as it becomes too complex to maintain and develop further. In this chapter, we will describe logging with the usage of the log and logger packages, both coming from the tcllib collection. We will also mention an alternative audit package that serves the same purpose, but from a different perspective.
While logging allows you to analyze program flow after it finishes, debugging is a different concept. It allows you to take a look inside the working program, stop its execution at a specified point, and check the values of internal variables. The good news is that you do not have to put anything special in your code to debug it, but you have to use special tool that may seem to be awkward and complicated at the beginning. This chapter will describe the Tcl Dev Kit Debugger, and its older, freely available version—TclPro Debugger. We will also present the Tcl Dev Kit Inspector, which may be considered as an extended 'remote console', and discuss how it differs from a typical debugger.
Additionally, we will discuss proper handling of errors that may occur during the execution of your application, and how to prevent them from crashing it.
In the next few sections, we will describe a few logging packages that you may use in your code—log, logger ,and audit. Of course these are not the only options available, but they give a good orientation in the topic. The first one—log, is the simplest one whereas the other two are more advanced.
In general, when it comes to adding log entries in the code, the question of performance impact arises, as too many calls to logging commands may significantly slow down the application. Tcl has the ability to completely ignore empty procedures (they are compiled to the no operation instruction at the bytecode level), and both logger and audit are able to take advantage of this feature, by aliasing unused commands to procedures with an empty body. Therefore, disabling the logging by setting the log level to minimum will result in almost same performance as for code without any logs.
One of the oldest libraries created for logging purposes is the log package, coming from the tcllib package collection. The manual page is available at http://tcllib.sourceforge.net/doc/log.html. The good news is that if you are using ActiveTcl, there is good chance that you do not need to install any additional items, because you already have the log package in your distribution. If you have any trouble, we recommend installing all Tcllib libraries with the following command:
teacup install tcllib
For more information about Teacup and how to use it, please refer to the appropriate section in Chapter 2, Advanced Tcl features.
No special initialization is required. All you need to do to start using this package is to invoke the command package require log.
This simple library defines eight levels of logging, in the following order starting from the most important one:
|
Level name |
Suppressed by default |
Default output |
|---|---|---|
|
emergency |
No |
stderr |
|
alert |
No |
stderr |
|
critical |
No |
stderr |
|
error |
No |
stderr |
|
warning |
Yes |
stdout |
|
notice |
Yes |
stdout |
|
info |
Yes |
stdout |
|
debug |
Yes |
stdout |
The four highest log levels are enabled by default, the other ones are disabled (suppressed) to avoid generating too much information.
package require log
set availableLevels [log::levels]
set availableLevels [lsort -command log::lvCompare -decreasing
$availableLevels]
foreach level $availableLevels {
log::log $level "message logged on $level level"
}
foreach level $availableLevels {
puts "---"
puts "Level name: $level"
puts "Is suppressed: [log::lvIsSuppressed $level]"
}
The first line loads the log package, to make it available for use. All commands provided by this package are located in the log namespace.
The command log::levels returns a list of all available log levels. Note that the list is NOT ordered according to the levels' importance. To get the list in the order presented in table, we sort it using lsort command. The log package provides a handy comparison command log::lvCompare, which is compatible with lsort (refer to Chapter 1, Introducing Tcl, for more details on lsort command).
Using this list, we first attempt to log a message on each level. To do this, we call log::log command that accepts two parameters: a level and a message:
log::log
levelName message
Having done this, for each level the code displays information about its suppression state, using the command log::lvIsSuppressed
The code produces the following output (standard error output is in bold):
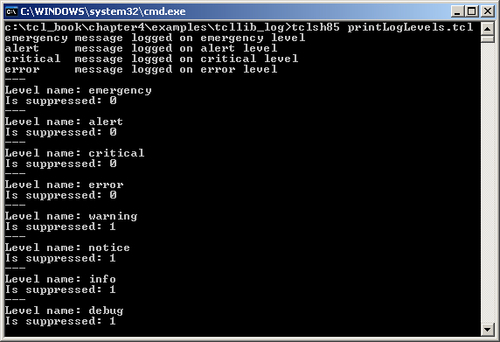
As you can see, only the four messages on the highest levels get logged, because lower levels are suppressed.
To enable or disable particular logging levels, the following commands may be used:
log::lvSuppresslevelName ?suppress?—the first parameter is the name of level to alter. The second parameter is optional, and can take the values 0 or 1. If a value is omitted, the default value is 0. The command disables the specified level whensuppressvalue is 1, or enables it when value is 0.log::lvSuppressLElevelName ?suppress?—similar to previous one, with the only difference being that the state of the specified level and all lower levels is altered. For example, the command:log::lvlSuppressLE alert 1will effectively disable all levels but emergency.
Each log level is capable of producing output to a specified channel. As mentioned earlier, by default these channels are stdout or stderr, but it is possible to specify a custom channel:
When log::log is invoked, it first checks if the given level is enabled; if it is, then it calls log::Puts internal command, passing to it the level name and message text. This command automatically selects the appropriate channel, and writes a log entry to it.
By default, the log format produced by the log::Puts command is simple and each entry consists of a line as follows:
Luckily, it is possible to replace log::Puts with a custom command, where some more sophisticated format and other message processing may be introduced:
log::lvCmdlevelName commandName—the first parameter is the name of level, for which you want to replace the log writing command. The second parameter is a command name. Note that this command should accept two parameters: the level of the message and the message text.log::lvCmdForallcommandName—similar to previous one, but alters all log levels.
Knowing all this, we can implement modifications that would allow us to write well formatted logs to text file:
package require log
set availableLevels [log::levels]
set availableLevels [lsort -command log::lvCompare -decreasing
$availableLevels]
log::lvSuppressLE alert 0
set channel [open "messages.log" a]
log::lvChannelForall $channel
log::lvCmdForall myPuts
proc myPuts {lvl msg} {
set now [clock seconds]
set date [clock format $now]
set channel [log::lv2channel $lvl]
puts $channel [format "[%s] [%-9s] %s"
$date $lvl $msg]
flush $channel
}
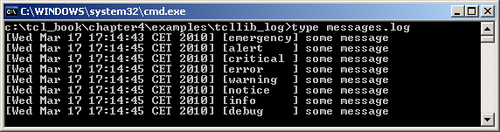
foreach level $availableLevels {
log::log $level "some message"
}
The code starts in the same way as in the previous example. All log levels are enabled with log::lvSuppressLE alert 0. A channel related to the file messages.log is created and the reference stored in the channel variable. This channel is set for all levels with log::lvChannelForall $channel. Next, also for all levels, the writing command is replaced with myPuts.
The myPuts command accepts two variables—log level (lvl) and message text (msg). It retrieves the current date (and stores it in the date variable), channel for the specified log level (and stores it in channel), performs some formatting on the lvl string in order to achieve the fixed length of that variable, and finally writes a log entry with the puts command.
As a result, the messages.log file is created with the following well-formatted content:
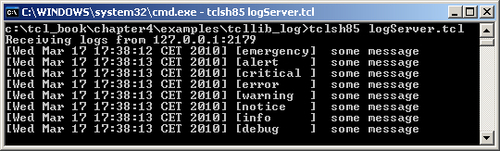
Of course, it is also possible to send logs over the network using the socket channel. To do this, we have to modify only one line in the code (now it can be called 'client code'), the one defining channel:
set channel [socket localhost 1234]
We also need some kind of log server that will accept an incoming connection and logs:
proc logServer {channel addr port} {
puts "Receiving logs from $addr:$port"
while {![eof $channel]} {
puts [gets $channel]
}
}
socket -server logServer 1234
vwait forever
This simple code will accept connections on port 1234 and just print logs to the console for demonstration purposes. Once the server and the client code are executed, the output on the console where the server was started will be similar to:
For more details on networking in Tcl, such as how to program a socket, refer to Chapter 6, Networking in Tcl of this book.
In summary the log package offers a simple but still flexible mechanism for logging purposes. Its main disadvantage is that it is not able to read / write configuration, and lacks the ability to define more than one loggers, or at least targets (channels) for messages; for example, concurrent logging to multiple files and consoles with different formatting. These constraints can be bypassed to certain degree, with more sophisticated design of custom writing command and additional configuration code, but still it would be better to have it already included in package itself.
The logger package is more advanced compared to the previous one. It also comes as a part of Tcllib bundle and you will already have it if you are using the ActiveTcl distribution. The documentation of the package is located at http://tcllib.sourceforge.net/doc/logger.html, but unfortunately it is not consistent and some information is incorrect or missing. The content of this paragraph is based not on the documentation, but on real life experience with the package in version 0.9.
The main difference in comparison to the log package, is that it introduces the ability to create many instances of the logger, each one with different configuration, which allows precise fine-tuning of the logger to reflect your needs. These instances are referred to as services, and we will use both terms interchangeably across this paragraph. Moreover, the instances can be organized hierarchically, which allows inheritance of configuration from the parent instance. Such a solution provides enough flexibility for even most demanding applications. Imagine that your complex application consists of various blocks (components). By creating separate loggers for each part, you gain an ability to easily inspect the behavior of only one component, instead of having to review logs from the entire program.
Another improvement is the ability to collect information, about entering and exiting to particular procedures along with data passed to it. Such behavior is called tracing, and collected logs are called traces. What's really important here is that this functionality leverages Tcl's native tracing mechanism. Therefore, changes in code are not required, and it does not generate any overhead unless enabled, either.
To create a logger instance, use the logger::init
serviceName command, as in the following example, where the instance is stored in the variable logger:
set logger [logger::init someService]
What is really stored in logger variable is the name of the namespace created by this command, for the particular service name. The command also imports some useful logging commands into this namespace, as we will see in the following section.
In case of version 0.9 of the logger package, the namespace created for serviceName is ::logger::tree::serviceName. Actually, serviceName is nothing more than a part of a namespace and it may contain elements separated with ::. This clever solution allows easy creation of hierarchical loggers:
logger::init parent
#... configuration of parent' logger goes here
logger::init parent::child
In this case, the second logger is simply referred to as a 'child' (although its full name is parent::child) which inherits all the configuration of parent logger. It is of course possible to fine-tune its configuration later.
Similar to log, there are eight log levels available. In contrast to the previous logging package, to log on a particular level you have to use appropriate command from the namespace described in the previous section. Luckily, the command names are identical to level names. The following table itemizes all levels in order of importance:
|
level name |
logging command name |
|---|---|
|
emergency |
|
|
alert |
|
|
critical |
|
|
error |
|
|
warning |
|
|
notice |
|
|
info |
|
|
debug |
|
The level names are almost identical to those coming from log, with an exception of the warn level, which was called warning. In summary, logging any message is as simple as invoking:
${logger}::notice "this is test message"
By default, all levels are enabled but this behavior may be changed for newly created loggers with the usage of the logger::setlevel command which will be described later.
Once you start logging with these commands, you will quickly notice that using a variable name each time, in this example of logger, is not too convenient. The package authors also, noticed this and made it possible to import all logger service commands to the namespace of your choice, with the logger::import command. Typical usage of this command is:
logger::import -all -namespace targetNamespace serviceName
In this form, the command will import all logger commands related to the serviceName instance into the targetNamespace namespace. All parameters except for service name are optional. If the -namespace parameter is omitted, the commands would be imported into the current namespace. Skipping -all would cause logger to import only logging commands (emergency, alert , and so on.). When the option is specified, all commands (including some additional, described later) are imported.
Other possible parameters are:
The import command is handy, but you will probably not use it. There is another, far better command—-initNamespace:
logger::initNamespace
namespaceName ?level?
The functions of the previously described commands are combined into this one, as follows:
- It creates a service with a name based on namespaceName
- It imports all logging commands into the namespace namespaceName
- It sets the logging level either to
warnor to level, if specified
The logger package offers two possibilities for altering the log level: you can either change it for a particular logger instance, or globally (for all existing loggers):
|
global command |
instance command |
description |
|---|---|---|
|
|
|
Enables logging at the specified level and all higher levels |
|
|
|
Disables logging at the specified level and all lower levels |
|
|
|
Enables logging at the specified level and all higher, and disables all lower levels |
Additionally, the logger::setlevel command may be used to define the default log level for all newly created loggers.
Knowing everything that has been described up to this point, we can illustrate it with the following example:
package require logger
set logger [logger::init someService]
${logger}::debug "message logged on 'debug' level"
logger::import -all -namespace someService someService
someService::debug "another message logged on 'debug' level"
someService::emergency "message logged on 'emergency' level"
set child [logger::init someService::child]
logger::import -all -namespace someService::child
someService::child
puts "Known log levels: [logger::levels]"
puts "Known services: [logger::services]"
proc listLevels {} {
foreach service [logger::services] {
puts "Current loglevel for $service is:
[${service}::currentloglevel]"
}
}
listLevels
someService::setlevel notice
puts "after parent logger level change..."
listLevels
someService::child::enable debug
puts "after child logger level change..."
listLevels
someService::alert "this message will be logged"
someService::child::debug "and this one too"
someService::debug "but this one will be not"
someService::delete
The first lines demonstrate the creation of a logger instance for someService, for example logging on the debug level using this instance, then importing the relevant commands into the someService namespace, and again example logging to demonstrate the benefits of that import.
Next, a child logger named someService::child is created and similarly, its commands are imported into the someService::child namespace.
Subsequently, the code will print out all available log levels owing to logger::levels command, and all defined logger instances (services) up to this point, using the logger::services command. Both of these commands return results in the form of a Tcl list.
Then the procedure listLevels is defined. Its purpose is to print the enabled log level for every created logger. To get this information, ${service}::currentloglevel command is used, where the service variable is the service name (see the following section for more information).
The procedure is used next, each time the log level is altered for parent or child logger to see how it affected overall configuration.
At the end, the parent logger and its child are removed using delete command. This also cleans up all the resources used by that service.
The output of this example is as follows:
[Wed Dec 09 19:13:31 CET 2009] [someService] [debug] 'message logged on 'debug' level'
[Wed Dec 09 19:13:31 CET 2009] [someService] [debug] 'another message logged on 'debug' level'
[Wed Dec 09 19:13:31 CET 2009] [someService] [emergency] 'message logged on 'emergency' level'
Known log levels: debug info notice warn error critical alert emergency
Known services: someService someService::child
Current loglevel for someService is: debug
Current loglevel for someService::child is: debug
after parent logger level change...
Current loglevel for someService is: notice
Current loglevel for someService::child is: notice
after child logger level change...
Current loglevel for someService is: notice
Current loglevel for someService::child is: debug
[Wed Dec 09 19:13:31 CET 2009] [someService] [alert] 'this message will be logged'
[Wed Dec 09 19:13:31 CET 2009] [someService::child] [debug] 'and this one too'
Analyzing this output, we can clearly see that altering the parent logger has a direct impact on child instance—changing the logging level on the parent from debug to notice in both of them. However, changes in the child logger are not propagated to the parent, so after the someService::child::enable debug command, only the child logger changes its logging level to debug. We can also notice the rather obvious behavior that messages, logged on the level which is not currently enabled, are simply discarded.
The implementation of listLevels command should be improved, in order to make it more universal:
proc listLevels {} {
foreach service [logger::services] {
puts "Current loglevel for $service is:
[[logger::servicecmd $service]::currentloglevel]"
}
}
The previous implementation worked only because of importing logger commands into namespaces, named identically to the corresponding services. To make it independent of the fact whether logger::import command was executed or not, additional command is used:
logger::servicecmdserviceName
This command returns the same value as logger::init—full namespace, where the logger package put all commands related to the particular instance for a specified service name.
As mentioned earlier, this library allows the tracing of command execution. To achieve it, the ${logger}::trace command with appropriate parameters must be used:
${logger}::trace on: enables tracing. The mechanism is independent of logging, so enabling / disabling any log levels does not affect the ability to trace. Also, it uses some unique features of Tcl 8.4 and later, so the command will fail on earlier versions.${logger}::trace offdisables tracing.${logger}::trace addprocName : causes procedure(s) (the command accepts more than one procedure name) to be 'monitored'. If the procedure identified by procName is called, appropriate tracing information is generated. It is also possible to add all procedures from given namespace:${logger}::trace add -nsnamespaceName${logger}::trace removeprocName : similar toadd, removes one (or more) procedures from monitoring. Similarly,${logger}::trace remove nsnamespaceNameremoves all procedures from the specified namespace.${logger}::trace status :returns a list of monitored procedures. This command may be also called with an additional parameter, the name of the procedure, to verify if it is monitored or not.
The operation of the tracing mechanism is illustrated by the following example:
package require logger
set logger [logger::init someService]
proc second {} {}
proc first {} {second}
${logger}::trace on
${logger}::trace add first second
puts "monitored procedures are: [${logger}::trace status]"
first
${logger}::delete
Two dummy procedures, first and second are created and are registered for tracing. In the next step, we verify this by printing the status of tracer, and finally call the first command to observe the generated information (tracing.tcl is the script name that is being executed):
monitored procedures are: ::first ::second
[Wed Dec 09 19:20:56 CET 2009] [someService] [trace] 'enter {proc ::first level 1 script tracing.tcl caller {} procargs {}}'
[Wed Dec 09 19:20:56 CET 2009] [someService] [trace] 'enter {proc ::second level 2 script tracing.tcl caller ::first procargs {}}'
[Wed Dec 09 19:20:56 CET 2009] [someService] [trace] 'leave {proc ::second level 2 script tracing.tcl caller ::first status ok result {}}'
[Wed Dec 09 19:20:56 CET 2009] [someService] [trace] 'leave {proc ::first level 1 script tracing.tcl caller {} status ok result {}}'
Every time you log a message, for example on debug level:
${logger}::debug "message"
what really happens is that debug (or other command) verifies if the log level is enabled, and if it is, then the appropriate underlying command is called.
For each log level of every instantiated logger, it is possible to replace the standard implementation of that underlying command with your custom one. Let's consider the following example first:
package require logger
proc myLogProc {txt} {
puts ">>> $txt <<<"
}
proc listLogProcs {logger} {
puts "== log procedures for $logger =="
foreach level [logger::levels] {
puts "$level --> [${logger}::logproc $level]"
}
}
set logger [logger::init someService]
listLogProcs $logger
${logger}::debug "test message"
${logger}::logproc debug myLogProc
listLogProcs $logger
${logger}::debug "test message"
set anotherLogger [logger::init anotherService]
listLogProcs $anotherLogger
${anotherLogger}::delete
${logger}::delete
== log procedures for ::logger::tree::someService ==
debug --> ::logger::tree::someService::debugcmd
info --> ::logger::tree::someService::infocmd
notice --> ::logger::tree::someService::noticecmd
warn --> ::logger::tree::someService::warncmd
error --> ::logger::tree::someService::errorcmd
critical --> ::logger::tree::someService::criticalcmd
alert --> ::logger::tree::someService::alertcmd
emergency --> ::logger::tree::someService::emergencycmd
[Wed Dec 09 21:44:32 CET 2009] [someService] [debug] 'test message'
== log procedures for ::logger::tree::someService ==
debug --> myLogProc

info --> ::logger::tree::someService::infocmd
notice --> ::logger::tree::someService::noticecmd
warn --> ::logger::tree::someService::warncmd
error --> ::logger::tree::someService::errorcmd
critical --> ::logger::tree::someService::criticalcmd
alert --> ::logger::tree::someService::alertcmd
emergency --> ::logger::tree::someService::emergencycmd
>>> test message <<<
== log procedures for ::logger::tree::anotherService ==
debug --> ::logger::tree::anotherService::debugcmd
info --> ::logger::tree::anotherService::infocmd
notice --> ::logger::tree::anotherService::noticecmd
warn --> ::logger::tree::anotherService::warncmd
error --> ::logger::tree::anotherService::errorcmd
critical --> ::logger::tree::anotherService::criticalcmd
alert --> ::logger::tree::anotherService::alertcmd
emergency --> ::logger::tree::anotherService::emergencycmd
The first code defines two procedures: myLogProc which acts as simple implementation of logging command for debug level, and listLogProcs which prints implementing commands for all levels for the specified logger.
- To retrieve the current command that will be executed on specified level, we use
${logger}::logproclevelName command. As we can see in the output, for example: fordebuglevel the default command name isdebugcmd. - To change it, the additional parameter must be supplied:
${logger}::logproclevelName newCommandName. In our example, we changed the procedure fordebugfromdebugCmdtomyLogProc, and this change can be verified by usinglistLogProcsagain or by simply logging a message on this level.
At the end of the code, we verify that the procedure has been altered for only one logger, by instantiating the other one and listing implementations.
In a similar way, you can change the implementation of the trace logging command. To do this, run logproc with trace as the first parameter:
${logger}::logproc tracenewCommandName
There is one significant difference—the new command (that will handle traces) will be called each time with a list variable as its argument, and not a text one. The list consists of two elements. The first one is enter or leave keyword that is rather self explanatory. The second item is a dictionary that contains the following name-value pairs:
|
Name (key) |
Value |
|---|---|
|
|
The name of the procedure that was entered or left |
|
|
The stack level for that procedure; stack frames are discussed in more detail in Chapter 2,Advanced Tcl features |
|
|
The name of the file where the procedure is defined. May be empty in case of interactive mode |
|
|
The name of procedure which is calling the procedure being currently traced. May be empty in case the procedure is called from the global scope |
|
|
A dictionary containing the names and values of arguments passed to the procedure |
|
|
Only valid in the 'leave' case—the Tcl return code of the procedure, this is returned by the rarely used |
|
|
Only valid in the 'leave' case—the return value of the procedure |
In contrast to the previously described log package, you are not required to create your own logging procedure when you want to use the custom format of your log entries. The package logger::utilities makes it possible to easily create such procedures in predefined, template-based way, and names them appenders. In this paragraph, we will also refer to them as formatters as this is their main application.
Appenders are created per service (logger instance). Use logger::utils::applyAppender with following options to create one:
-appendertype : A mandatory option used to specify the type of the appender (described in the following section). Allowed values for type are:console, fileAppend.-serviceserviceName : A non-mandatory option used to specify the instance of the logger (identified by serviceName) to which the formatter should be appended.-serviceCmdlogger : An alternative way to identify the logger instance. This non-mandatory option accepts the same values as returned bylogger::init.-levelslevelsList : if specified, applies the formatter only to messages logged on levels listed in the levels list. Otherwise all levels are included.-appenderArgsargs : args is the list of arguments passed directly to the created appender.
One of the common arguments passed to the appender via the -appenderArgs option is the -conversionPattern
pattern. This optional argument allows us to define a custom format (pattern) of the logged messages. Basically, this is a normal string that may contain special identifiers which will be expanded properly at runtime. The default pattern is: [%d] [%c] [%M] [%p] %m. The following table lists all items allowed to occur in pattern string:
|
Identifier |
Expanded to |
|---|---|
|
|
Fully qualified name of logger instance (service) |
|
|
Short name of logger instance |
|
|
Current date (yyyy/MM/dd hh:mm:ss) |
|
|
Hostname |
|
|
Message |
|
|
Procedure name where the log event occurred ('global' in case of global scope) |
|
|
Level (priority) of the log event |
|
|
|
Two types of appenders exist:
To conclude the appenders description, let's have a look at working example:
package require logger
package require logger::utils
set fl [logger::init firstLog]
set sl [logger::init secondLog]
logger::utils::applyAppender -appender fileAppend
-appenderArgs "-outputChannel [open log.txt a]"
-serviceCmd $fl
logger::utils::applyAppender -appender console
-appenderArgs {-conversionPattern {[%d] %c:%p "%m"}}
-service secondLog
${fl}::notice "first logger message"
${sl}::notice "second logger message"
Two log services are created: firstLog and secondLog. The namespaces created for both of them are stored respectively in variables fl and sl.
Then the file appender (writing to log.txt file) is created and attached to the first logger, which is identified with $fl value.
After this, the console formatter is created with an example custom pattern [%d] %c:%p "%m". This appender is applied to the second logger, thanks to the secondLog value for service option.
Consecutively, both loggers are used to log sample messages to verify if appenders work correctly. The log.txt file will then contain a line:
[2009/12/12 19:39:49] [firstLog] [global] [notice] first logger message
and the second log will be sent to the console as:
[2009/12/12 20:09:02] secondLog:notice "second logger message"
The logger package is far more advanced than log. It allows us to create many logger instances (called services) with a different configuration. Appenders offer a convenient and flexible way to store log entries in the format of your choice.
However, it is still missing out the ability to read / write current configuration. Also, the available documentation is laconic and contains errors.
Another library worth mentioning is the one named audit. The documentation and all necessary files are located at http://dqsoftware.sourceforge.net/audit_index.html. Audit was created as a result of disappointment and a lack of some functionality in existing solutions. It is targeted for usage in long-running applications, working on servers, for example it allows logfile rotation. The library is very laconic and offers only essential information. It is closer to log than logger in terms of variety of features, yet offers a sufficient logging functionality. To start using it, you have to download and place it in your library directory, pointed by $auto_path variable.
The audit logger is able not only to save logs to text a file but also to create a special dump file, which may then be loaded in to a special graphical browser. What is more, the logger does not have to be initially configured to write to any files. As a part of its internal operations, it stores data in the memory and offers a possibility to write it later. For example, only in case some error occurs.
Let's analyze its usage starting with the following example:
package require audit::audit
audit::configure -level 9 -logfile log.txt
audit::audit main 5 "starting"
proc proc1 {} {
audit::audit proc1 3 "message from proc1"
proc2
}
proc proc2 {} {
audit::audit proc2 3 "message from proc2"
}
proc1
audit::audit main 5 "ending"
The first line loads the package, after which some configuration must be done using the audit::configure command. The most important parameters for this command are (all are optional):
-limitintegerValue—defines the limit of log entries stored in the memory. Its default value is 20,000.-levellevel— defines logging level. By defaults logs are disabled—level set to 0. Audit accepts level values from 1(most important) to 9 (least important).-logfilefileName—the logs (in human readable format) will be written to a file named filename. An empty value '''' disables writing to file.-logfilecountinteger—the number of files with previous logs to keep during the log rotation process. By default the number is 10.-datafilefileName—the dump will be written to file named filename. An empty value "" disables writing to file. Such a dump may be later viewed in the Audit browser.-datafilecountinteger—the number of files with previous dumps to keep during the log rotation process. By default the number is 10.
In this example, we enable all logging levels (by specifying value 9) and configure it to be written to the log.txt file.
To log anything, use the audit::audit command:
audit::audit
type level message ?varlist? ?parameter1? ?value1? ?parameter2? ?value2? ?..?
The accepted arguments are:
|
Argument |
Meaning |
|---|---|
|
type |
Any string identifier like method name |
|
level |
Level of log |
|
message |
Message to be logged |
|
varlist |
List of variables to dump |
|
parameter value |
Additional parameters and its values to store |
The content of the log.txt file after running the previous example is as follows:
09-12-16 19:23:34.4203 | main | 5 | 0 | starting
09-12-16 19:23:34.4221 | proc1 | 3 | 1 | message from proc1
09-12-16 19:23:34.4223 | proc2 | 3 | 2 | message from proc2
09-12-16 19:23:34.4225 | main | 5 | 0 | ending
The first field contains the time of the log event, after which the value is specified as type, then level on which the message was logged, stack frame, and finally the message.
To force log rotation, as mentioned earlier, you can use the command audit::logroll. The best application is to call this method periodically; for example, from Tclcron (described in detail in Chapter 2, Advanced Tcl features)
The following example will demonstrate the usage of the Audit browser:
package require audit::audit
audit::configure -level 9
audit::audit main 5 "starting"
proc testProc {msg args} {
audit::audit testProc 3 "message from testProc"
anotherTestProc $msg $args
}
proc anotherTestProc {msg args} {
audit::audit anotherTestProc 3 "message from anotherTestProc"
{msg args} currentTime [clock format [clock seconds]]
}
testProc "Some test" name1 value1 name2 value2
audit::audit main 1 "some message"
audit::audit main 5 "ending"
audit::saveAudit audit.sav
This code is similar to the previous one, with the exception that no log file is defined at the beginning. Therefore, the information is stored in memory and at the end, the method audit::saveAudit is used to save a binary dump to the audit.sav file. Also, some additional information is passed to the audit::audit command to illustrate how they can be analyzed later.
To start the Audit browser, run browser.tcl file located among audit package files. The following screenshot shows the browser window with the audit.sav file loaded:
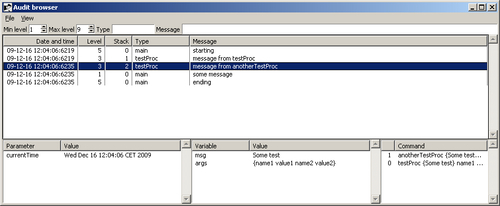
The main window shows a list of logged events in a similar format to the text file logs; each one can be clicked to obtain more information in lower windows. In this screenshot, event logged in anotherTestProc procedure is selected. It's also possible to search for entries by selecting the appropriate minimum and maximum levels, typing the text to search for in the type or message columns.
First, the lower window shows all parameters and its values logged with the audit::audit command. The next one contains the names and values of the variables, also put in with that command. The last one shows the stack trace, that the list of all procedures (along with their arguments) being currently executed when the log event occurred. Double clicking on any of items in lower part of the window will open an additional window, which will show detailed information about the selected item—such as being able to see the variables as a list or name-value pairs.
The idea that stands behind audit is quite different compared to previous loggers. The package is designed to be suitable for long running server side applications (log rotation), and it also allows to dump logs only in some particular conditions for the end user software. You can easily imagine an on-error popup window that allows the user to send a dump to the application's authors with one mouse click.
Moreover, the graphical browser outperforms any other solution in the context of ease of usage and the level of details provided, allowing you to find out the source of the problem with as little effort and time as possible.