While logging techniques save information about execution flow to allow you to analyze it later, debugging offers a different concept. It allows you to interact with a live, running application, review and modify its internal state, and halt execution at points of your choice using breakpoints.
The best graphical debugging tools, Inspector and Debugger, are offered by ActiveState as a part of the Tcl Dev Kit bundle, available at http://www.activestate.com/tcl_dev_kit/. There is a 21-day free trial period, so you do not need to buy it blindly. In this chapter, we will describe the tools offered by version 5.1.0. We will also describe its ancestor, the free TclPro Debugger (version 1.4), available at http://www.tcl.tk/software/tclpro/. Although it is based on old Tcl 8.3, it is still a free alternative worth considering.
Before we focus on debuggers, we will first discuss the Tcl Dev Kit Inspector, which is not really a thorough-bred debugging application. It allows you to connect to a running program via a comm port and analyze its components. The comm package is described in Chapter 7, Using Common Internet Services, so we will not dive in to its details here. All you need to know is that the application itself must load a comm package, and configure it for listening on a specific port (across this book, we use value 1991 as the example port), or use the default value (returned by the comm::comm self command).
Across this and the next few paragraphs, we will base our description on the simple client that is the server code example. Here is the server code:
namespace eval ::server {}
proc ::server::initCounter {name} {
variable counter
set counter($name) 0
}
proc ::server::incrementCounter {name value} {
variable counter
if {[info exists counter($name)]} {
incr counter($name) $value
}
}
proc ::server::getAvg {} {
variable counter
set sum 0
foreach name [array names counter] {
incr sum $counter($name)
}
return [expr {$sum / [array size counter]}]
}
package require comm
comm::comm config -local 0 -port 1991
vwait forever
The concept is simple—the server application will allow the creation of variables named counters (with command server::initCounter), modification of its value (with server::incrementCounter), and retrieval of average value (server::getAvg). Each counter has a name and is stored in counter array. The server code defines appropriate procedures, initializes comm to listen on port 1991, and enters event loop.
The client code is also simple and boils down to remote execution of server commands:
package require comm
set id 1991
comm::comm send $id ::server::initCounter "testA"
comm::comm send $id ::server::initCounter "testB"
comm::comm send $id ::server::incrementCounter "testA" 8
comm::comm send $id ::server::incrementCounter "testB" 16
comm::comm send $id ::server::incrementCounter "testC" 10
puts [comm::comm send $id ::server::getAvg]
What we will do here is start a server process, and then execute some client code once to allow it to modify internal server application state. Once it is done, we can start the Inspector.
The first action to perform is to connect Inspector to our server application, by choosing File | connect to comm port and entering 1991 as the value (please note that it will use the same type of connection as the one between our example client-server, so effectively we are reusing comm port). Unfortunately, the inspector allows only local connections as there is no possibility of entering an IP address. Advanced users may bypass this limitation by using SSH tunnelling. If the target machine has a running SSH server (which is usually the case for applications running on Unix servers), it is enough to execute the following (we assume the target IP is 192.168.1.1):
- Windows:
plink -L 1991:127.0.0.1:1991 [email protected] plinkis a command-line interface for Windows SSH client PuTTY, available at: http://www.chiark.greenend.org.uk/~sgtatham/putty/download.html - Unix:
ssh -L 1991:127.0.0.1:1991 [email protected]
This command will tunnel the local port 1991 to the remote machine's port—also 1991, as a result allowing remote usage of Inspector.
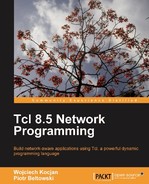
Inspector allows you to take a look into the application. For example, you are able to review all defined procedures as follows:
In the preceding screenshot, the getAvg procedure is selected (in Procs pane) and displayed (in Value pane). The bottom Value window is editable and you are given the possibility to redefine your procedure by editing its code, and clicking the Send button.
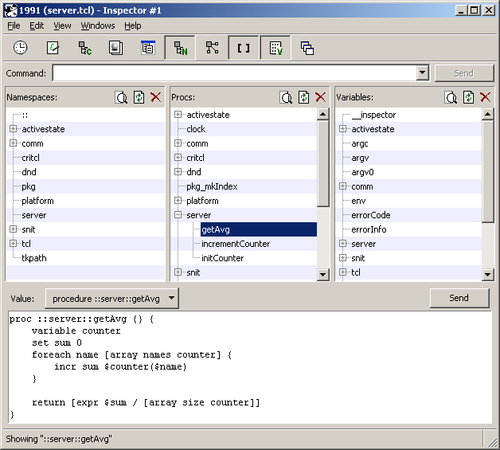
The following screenshot shows how to check value of the counter variable:
Note that the value is presented in the form of a ready-to-execute Tcl command that would set this value. Just as in the previous case, the Value window is editable, so you can easily modify the value of the variable. For example, change 8 to 12 and click the Send button.
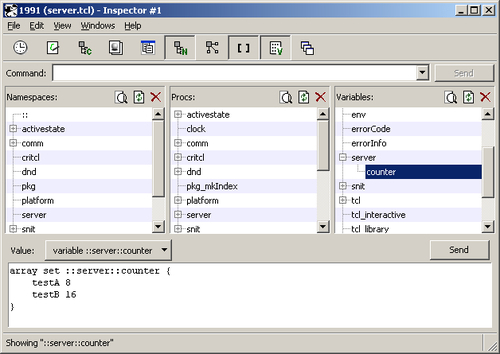
You are also able to call any command of your choice, just as it would be called inside the application. All you need to do is to enter the command in the Command text field, and click Send. For example, the call to server::getAvg command will return the value 14 (the average of the values 12 and 16, as we already modified value of the testA counter):
The preceding examples give you a taste of the possibilities offered by Inspector. Apart from the described components, there is also a possibility to inspect:
- The defined namespaces and items inside it
- Global items
- Classes and objects created with
incr Tcl - GUI elements such as windows, images, menus, and canvas
- Items declared with the
aftercommand
To sum up, Inspector offers you the ability to view the minute details of the application while it is running, to check, and to modify its internal state.
Debugger is a full featured application that offers a complex set of features, aimed at finding and fixing bugs in your Tcl code. In this paragraph, we will describe how to debug our example server code. As usual, we do not intend to copy the documentation, but to present the potential offered by this tool. For more details, please refer to Tcl Dev Kit User Guide.
Debugger has the ability to work in two modes:
- Local Debugging—the debugger and debugged code are executed on the same physical machine
- Remote Debugging—the application that is a subject to debug connects remotely over TCP/IP network to the debugger
Once you start Debugger and choose File | New Project... from menu, you are able to select the debugging mode. In this case, we select Local Debugging and load the server code:
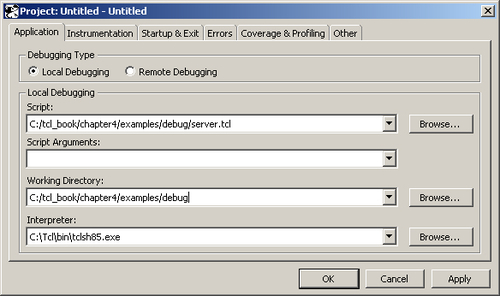
What this means is that the debugger will launch the server code (server.tcl) locally on the same computer, where it is run. The project may be saved, allowing us to keep your breakpoints and watch variables for later usage.
Once the code is loaded, you will be able to start interacting with it. Debugger offers typical scenario for this kind of application features:
- The ability to execute the code, line by line with stepping function
- Display of defined variables on all stack frames, along with stack information
- The ability to define line and variable breakpoints:
- A line breakpoint will cause the application to stop, once the execution reaches the specified line
- A variable breakpoint will cause the application to stop on any modification of specified variable
- The ability to modify internal state of the application by using Eval Console
- Measurements of coverage and profiling of the code
If there are more details, the code (server.tcl) will not simply be executed. The debugger will modify it transparently, enabling the debugging process to take place—this mechanism is called instrumentation. By default, all the code would be instrumented, but you have the possibility of explicitly excluding some of its parts. You may do this on the second tab of new project wizard (or later in File | Project Settings...):
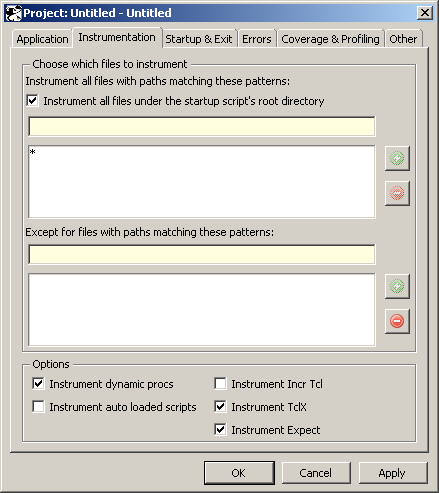
For example, you can precisely define which procedures should be left uninstrumented, or even ignore entire source files. The excluded code will still be executed of course, but you won't be able to use debugging features like setting breakpoints inside it. You may wonder why to bother yourself with such exclusions: for example, it would improve the performance of your code, or allow you to omit some parts like loading some libraries.
The following screenshot shows the Debugger with loaded and started server.tcl code:
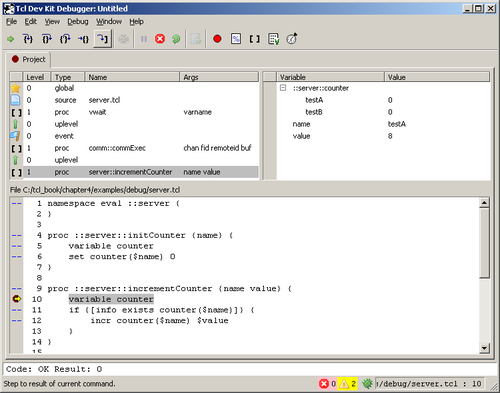
The upper toolbar contains buttons for stepping the application, stopping / and restarting it, and for displaying various additional windows, consecutively:
- The Breakpoint window contains a list of all defined breakpoints.
- The Eval Console window, is similar to the typical Tclsh console. This console allows you to enter and execute the Tcl commands, and effectively modify the runtime state of the application.
- The Procedures window contains a list of all procedures defined.
- The Watch Variables window offers the ability to watch values of the variables of your choice.
- The Code Coverage window.
The upper left pane holds the list of available stack frames. The right pane contains all variables and their values for the selected stack frame. It also offers you the possibility of creating a variable breakpoint (marked with the letter V), by clicking on the left margin of the variable:
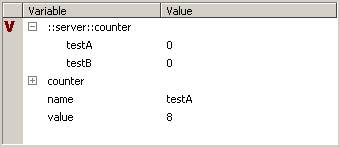
Double clicking on any variable from this pane will open an additional Data Display window, where you can easily display the value of the variable in different formats (Hex, Octal, Unicode and so on).
It is worth noting that the version of the Debugger we used, at the time of writing, had problems when a breakpoint was defined for the array variable. Once the execution of that variable came to modification, the error can't read "counter": variable is array was shown.
The debugger may also fail when some core Tcl commands are renamed or redefined. For example, the comm package renames the vwait command that causes an appropriate warning once executed in Debugger.
The main pane displays the code for selected stack frame. By clicking on the left margin, you are able to define line breakpoints denoted by a dot (as shown in line 10 in the example screen). Once the server was launched and the breakpoint was defined, we executed the client code that caused the server::incrementCounter procedure to be executed. As a result, the execution was stopped at line 10. The yellow arrow on the left points to the line where the execution is currently stopped. Once you decide to continue the execution with stepping functionality, you will notice the arrow moves to next line.
The client code (presented at the paragraph describing Inspector) attempts to increase the value for the counter named testC. However, once the average value is retrieved, it is calculated only from the first two counters. Quick debug action helps solve this issue:
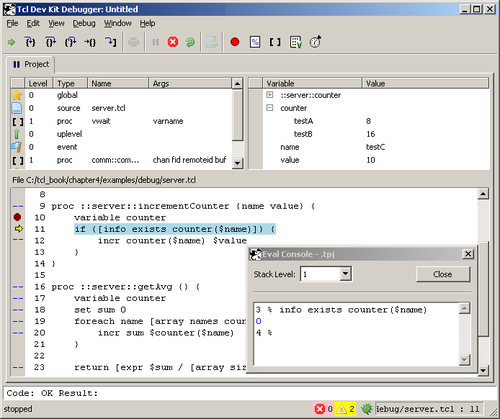
Having declared a breakpoint at line 10, all we have to do is to wait until the name argument has the value testC. Once this happens, we can step to the next line, and using the Eval Console we can quickly check whether the if condition is fulfilled or not. As you can see, it is not fulfilled, and a quick look at the counter variable in the Variables pane proves that indeed the counter testC was never initialized. Once we return to client code, we check for the following:
comm::comm send $id ::server::initCounter "testB"
This line is missing indeed. This example 'bug' is trivial, as the client code is short and simple, but in the case of a complex application the odds of missing such a command may be pretty high.
Remote debugging does not differ significantly from the local mode. The main difference is that the debugger and application are communicating via the TCP/IP network protocol.
The architecture of remote debugging is interesting: it is the debugged application's responsibility to connect to the debugger that is configured to listen on some specific port (let's use 1999 as an example value):
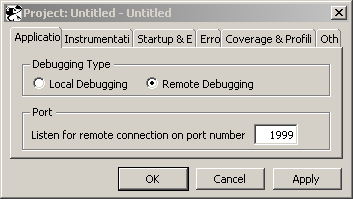
In order to connect (attach) to the listening debugger, the application must be modified. Tcl Dev Kit comes with the tcldebugger_attach package that offers all requisitive commands for the application to attach to the debugger. This package must be accessible for the debugged code, so you will probably have to copy it to the target machine.
You may either modify the application code itself or create some wrapper code that will do all that is necessary, and run the original script (see the User Guide for details). We choose second example as it is more elegant. Assuming that our original server code is stored in server.tcl file, we will create a new script with the following content:
package require tcldebugger_attach
debugger_init 127.0.0.1 1999
source server.tcl
As you can notice, basically only one command is required to enable remote debugging:
debugger_init
host port
The host parameter is the address of the machine where Debugger listens on the specified port.
If you were to decide to modify the original server.tcl script, the start would be the same, but additionally you would have to encapsulate all the server code into the debugger_eval procedure call:
package require tcldebugger_attach
remote debuggingaboutdebugger_init 127.0.0.1 1999
debugger_eval {
namespace eval ::server {}
proc ::server::initCounter {name} {
#body of the procedure
}
proc ::server::incrementCounter {name value} {
#body of the procedure
}
proc ::server::getAvg {} {
#body of the procedure
}
package require comm
comm::comm config -local 0 -port 1991
vwait forever
}
Once the application is attached to the debugger, you can interact with it in the normal way, identical to local mode, but in this case the interaction is transparently over the network.
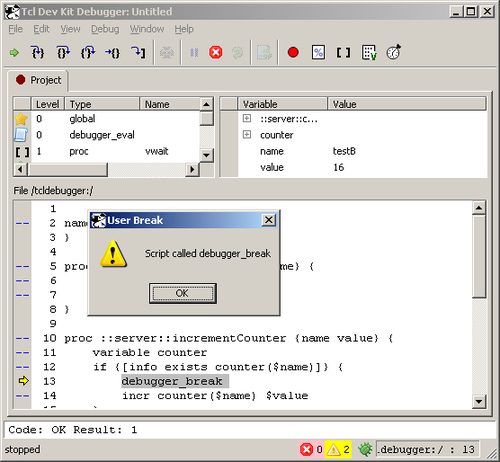
The package also offers you the ability to programmatically define breakpoints with the debugger_break command, which behaves similar to a line breakpoint. For example, lets add it to the ::server::incrementCounter command:
proc ::server::incrementCounter {name value} {
variable counter
if {[info exists counter($name)]} {
debugger_break

incr counter($name) $value
When the execution hits this line of code, the result is as follows:
Note that you are still able to define breakpoints in the normal way, using the GUI. Usage of debugger_break may be particularly useful in the case of dynamically-generated code, where you wouldn't be able to set a breakpoint otherwise.
If the debugger is not started and is not listening then the application will continue its operations in the normal way, and debugging related commands will have no effect.
The Tcl Dev Kit Debugger is a simple but powerful tool that provides all the necessary functionality typical for this kind of application. Although it lacks some sophisticated options like conditional breakpoints (stop the execution only if some condition is met; for example, variable name has value testC), and in some circumstances it may fail (described in User Guide), there is no doubt it is the best Tcl debugger currently available.
The ability of remote debugging is especially important in the case of network programming, which is essence of this book. What's more, the debugger also offers the ability to perform code profiling, analyze the code coverage, and identify Hot Spots, that is the code fragments that have been executed multiple times. These features allow you to focus on the most critical parts of the application, and fine-tune and optimize the performance of them. For example, you may be dealing with the long running processes of a server application that are handling large volume of data, and reducing the CPU usage or response time may be a matter of life and death.
TclPro Debugger is an older ancestor of its commercial successor, the Tcl Dev Kit Debugger. They both share almost identical user interface and functionality, but as the TclPro Debugger is no longer actively developed (at the time of writing the latest version is 1.4.1 which was released on 2000-11-21), it is based on an old Tcl version, 8.3, which is its main disadvantage. The upside is that it is freely available from the http://www.tcl.tk/software/tclpro/ website. It also comes with a comprehensive user guide.
For example, the attempt to debug our example server code failed:
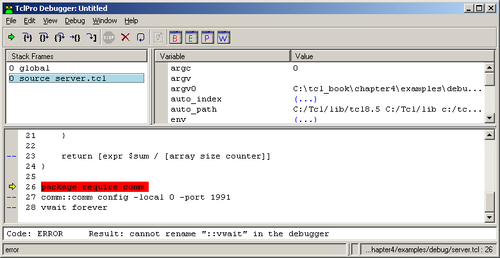
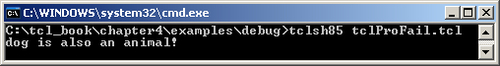
It may be considered as a proof that Tcl Dev Kit Debugger is more mature and advanced solution. However, there are still many situations where the free TclPro Debugger will work fine and satisfy your requirements. In general, this debugger will fail in cases when the subject of instrumentation is the code containing features specific to Tcl versions newer than 8.3, like 8.4 or 8.5. For example, {$item in $itemlist} or {$string eq $otherstring}. Consider the following code:
set animals [list cat cow aligator dog]
if {"dog" in $animals} {
puts "dog is also an animal!"
}
This code is perfectly fine and will execute correctly with the Tcl 8.5 interpreter:
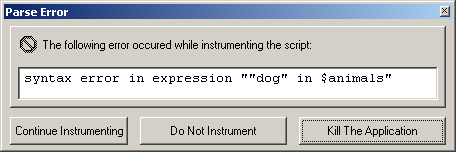
However, an attempt to run it in the debugger will finish with error:
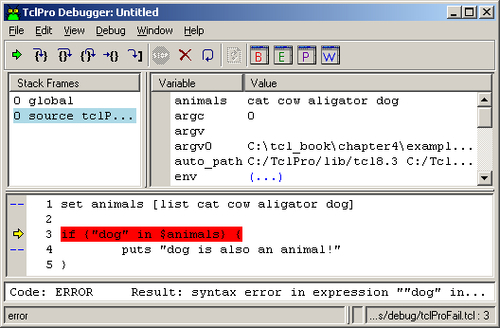
You may try changing the interpreter used by the debugger in the Project Settings to the newer one, but the TclPro Debugger will complain about incorrect syntax:
You can still disable the instrumentation of procedures / files that contain these commands. This way the debugger will skip syntax checking of commands that are potentially using features of Tcl 8.4 or newer, and will only inspect code you want to debug. Though this limits your functionality, which might be a reason to upgrade to the TclDevKit package that does not have such issues.