
Chapter 9. Logging, Monitoring, and Statistics

Exercising control over a network—whether for your home networking needs or in a professional context—is likely to be a main objective for anyone who reads this book. One necessary element of keeping control is having access to all relevant information about what happens in your network. Fortunately for us, PF—like most components of Unix-like systems—is able to generate log data for network activity.
PF offers a wealth of options for setting the level of logging detail, processing log files, and extracting specific kinds of data. You can already do a lot with the tools that are in your base system, and several other tools are available via your package system to collect, study, and view log data in a number of useful ways. In this chapter, we take a closer look at PF logs in general and some of the tools you can use to extract and present information.
PF Logs: The Basics
The information that PF logs and the level of logging detail are up to you, as determined by your rule set. Basic logging is simple: For each rule that you want to log data for, add the log keyword. When you load the rule set with log added to one or more rules, any packet that starts a connection matching the logging rule (blocked, passed, or matched) is copied to a pflog device. The packet is logged as soon as it’s seen by PF and at the same time that the logging rule is evaluated.
Note
In complicated rule sets, a packet may go through several transformations due to match or pass rules, and criteria that matched a packet when it entered the host might not match after a transformation.
PF will also store certain additional data, such as the timestamp, interface, original source and destination IP addresses, whether the packet was blocked or passed, and the associated rule number from the loaded rule set.
PF log data is collected by the pflogd logging daemon, which starts by default when PF is enabled at system startup. The default location for storing the log data is /var/log/pflog. The log is written in a binary format, usually called packet capture format (pcap), that’s intended to be read and processed by tcpdump. We’ll discuss additional tools to extract and display information from your log file later. The log file format is a well-documented and widely supported binary format.
To get started, here’s a basic log example. Start with the rules you want to log and add the log keyword:
block log
pass log quick proto { tcp, udp } to port ssh
Reload the rule set, and you should see the timestamp on your /var/log/ pflog file change as the file starts growing. To see what’s being stored there, use tcpdump with the -r option to read the file.
If logging has been going on for a while, entering the following on a command line can produce large amounts of output:
$ sudo tcpdump -n -ttt -r /var/log/pflogFor example, the following are just the first lines from a file several screens long, with almost all lines long enough to wrap:
$ sudo tcpdump -n -ttt -r /var/log/pflog
tcpdump: WARNING: snaplen raised from 116 to 160
Sep 13 13:00:30.556038 rule 10/(match) pass in on epic0: 194.54.107.19.34834 >
194.54.103.66.113: S 3097635127:3097635127(0) win 16384 <mss 1460,nop,nop,sackOK,nop,wscale
0,[|tcp]> (DF)
Sep 13 13:00:30.556063 rule 10/(match) pass out on fxp0: 194.54.107.19.34834 >
194.54.103.66.113: S 3097635127:3097635127(0) win 16384 <mss 1460,nop,nop,sackOK,nop,wscale
0,[|tcp]> (DF)
Sep 13 13:01:07.796096 rule 10/(match) pass in on epic0: 194.54.107.19.29572 >
194.54.103.66.113: S 2345499144:2345499144(0) win 16384 <mss 1460,nop,nop,sackOK,nop,wscale
0,[|tcp]> (DF)
Sep 13 13:01:07.796120 rule 10/(match) pass out on fxp0: 194.54.107.19.29572 >
194.54.103.66.113: S 2345499144:2345499144(0) win 16384 <mss 1460,nop,nop,sackOK,nop,wscale
0,[|tcp]> (DF)
Sep 13 13:01:15.096643 rule 10/(match) pass in on epic0: 194.54.107.19.29774 >
194.54.103.65.53: 49442 [1au][|domain]
Sep 13 13:01:15.607619 rule 12/(match) pass in on epic0: 194.54.107.19.29774 >
194.54.107.18.53: 34932 [1au][|domain]
The tcpdump program is very flexible, especially when it comes to output, and it offers a number of display choices. The format in this example follows from the options we fed to tcpdump. The program almost always displays the date and time the packet arrived (the -ttt option specifies this long format). Next, tcpdump lists the rule number in the loaded rule set, the interface on which the packet appeared, the source and target address and ports (the -n option tells tcpdump to display IP addresses, not hostnames), and the various packet properties.
Note
The rule numbers in your log files refer to the loaded, in-memory rule set. Your rule set goes through some automatic steps during the loading process, such as macro expansion and optimizations, which make it likely that the rule number as stored in the logs will not quite match what you’d find by counting from the top of your pf.conf file. If it isn’t immediately obvious to you which rule matched, use pfctl -vvs rules and study the output.
In our tcpdump output example, we see that the tenth rule (rule 10) in the loaded rule set seems to be a catchall that matches both IDENT requests and domain name lookups. This is the kind of output you’ll find invaluable when debugging, and it’s essential to have this kind of data available in order to stay on top of your network. With a little effort and careful reading of the tcpdump man pages, you should be able to extract useful information from your log data.
For a live display of the traffic you log, use tcpdump to read log information directly from the log device. To do so, use the -i option to specify which interface you want tcpdump to read from, as follows. (The -l option, which enables line buffering on the output, is useful if you want to look at what you’re capturing.)
$ sudo tcpdump -lnettti pflog0
Apr 29 22:07:36.097434 rule 16/(match) pass in on xl0: 85.19.150.98.53 > 213.187.179.198.41101:
63267*- 1/0/2 (68)
Apr 29 22:07:36.097760 rule def/(match) pass out on em0: 213.187.179.198.22 >
192.168.103.44.30827: P 1825500807:1825500883(76) ack 884130750 win 17520 [tos 0x10]
Apr 29 22:07:36.098386 rule def/(match) pass in on em0: 192.168.103.44.30827 >
213.187.179.198.22: . ack 76 win 16308 (DF) [tos 0x10]
Apr 29 22:07:36.099544 rule 442/(match) pass in on xl0: 93.57.15.161.4487 > 213.187.179.198.80:
P ack 3570451894 win 65535 <nop,nop,timestamp 4170023961 0>
Apr 29 22:07:36.108037 rule 25/(match) pass out on xl0: 213.187.179.198.25 >
213.236.166.45.65106: P 2038177705:2038177719(14) ack 149019161 win 17424 (DF)
Apr 29 22:07:36.108240 rule def/(match) pass out on em0: 213.187.179.198.22 >
192.168.103.44.30827: P 76:232(156) ack 1 win 17520 [tos 0x10]
This sequence begins with a domain name lookup answer, followed by two packets from an open SSH connection, which tells us that the site’s administrator probably enabled log (all) on the matching rules (see Logging All Packets: log (all)). The fourth packet belongs to a website connection, the fifth is part of an outgoing SMTP connection, and finally there’s another SSH packet. If you were to leave this command running, the displayed lines would eventually scroll off the top of your screen, but you could redirect the data to a file or to a separate program for further processing.
Note
Sometimes you’ll be interested mainly in traffic between specific hosts or in traffic matching specific criteria. For these cases, tcpdump’s filtering features can be useful. See man tcpdump for details.
Logging the Packet’s Path Through Your Rule Set: log (matches)
Early versions of the PF logging code didn’t feature an easy way to track all rules that a packet would match during rule-set traversal. This omission became more evident than before when match rules were introduced in OpenBSD 4.6 and PF users were offered a more convenient and slightly easier way to subject packets and connections to transformations, such as address rewriting. match rules allow you to perform actions on a packet or connection independently of the eventual pass or block decision. The specified actions—such as nat-to, rdr-to, and a few others—are performed immediately. This can lead to situations in which a packet has been transformed by a match rule and it no longer matches criteria in a filtering rule that appears later in the rule set that it otherwise would have matched if the transformation hadn’t already occurred. One fairly basic example is a match rule that applies nat-to on the external interface, placed before any pass rules in the rule set. Once the nat-to action has been applied, any filtering criteria that would have matched the packet’s original source address will no longer match the packet.
This greater versatility made some rule sets harder to debug (typically those with several match rules that perform transformations), and it became clear that a new logging option was needed.
The PF developers had been eyeing the logging code for a rewrite for some time, and by the time the logging system was rewritten for the OpenBSD 4.9 release, the restructured code made it easy to introduce the log option matches to help debug such rule sets and to help track a packet’s path through rule sets where several sets of match or pass rules could transform the packet.
Adding log (matches) to a rule forces the logging of all matched rules once a packet matches a rule containing a log (matches) clause. Once such a match occurs, all subsequent rules will also be logged. As a result, you can use targeted log (matches) statements to trace a packet’s path through your loaded rule set, making it much easier to untangle complicated rule sets.
For example, consider this simple rule set with NAT. The log (matches) rule is as follows:
match in log (matches) on $int_if from $testhost tag localnet
Our test host is a workstation in the local network with the IP address 192.168.103.44. When the test host looks up a website somewhere on the Internet, the logged information looks like this:
Apr 29 21:08:24.386474 rule 3/(match) match in on em0: 192.168.103.44.14054 > 81.93.163.115.80:
S 1381487359:1381487359(0) win 16384 <mss 1460,nop,nop,sackOK,nop,wscale 3,nop,nop,timestamp
735353043[|tcp]> (DF) ➊
Apr 29 21:08:24.386487 rule 11/(match) block in on em0: 192.168.103.44.14054 >
81.93.163.115.80: S 1381487359:1381487359(0) win 16384 <mss 1460,nop,nop,sackOK,nop,wscale
3,nop,nop,timestamp 735353043[|tcp]> (DF) ➋
Apr 29 21:08:24.386497 rule 17/(match) pass in on em0: 192.168.103.44.14054 > 81.93.163.115.80:
S 1381487359:1381487359(0) win 16384 <mss 1460,nop,nop,sackOK,nop,wscale 3,nop,nop,timestamp
735353043[|tcp]> (DF) ➌
Apr 29 21:08:24.386513 rule 17/(match) pass in on em0: 192.168.103.44.14054 > 81.93.163.115.80:
S 1381487359:1381487359(0) win 16384 <mss 1460,nop,nop,sackOK,nop,wscale 3,nop,nop,timestamp
735353043[|tcp]> (DF)
Apr 29 21:08:24.386553 rule 5/(match) match out on xl0: 213.187.179.198.14054 >
81.93.163.115.80: S 1381487359:1381487359(0) win 16384 <mss 1460,nop,nop,sackOK,nop,wscale
3,nop,nop,timestamp 735353043[|tcp]> (DF) ➍
Apr 29 21:08:24.386568 rule 16/(match) pass out on xl0: 213.187.179.198.14054 >
81.93.163.115.80: S 1381487359:1381487359(0) win 16384 <mss 1460,nop,nop,sackOK,nop,wscale
3,nop,nop,timestamp 735353043[|tcp]> (DF) ➎
The initial packet first matches rule 3, the match log (matches) rule quoted above the log fragment ➊. The next match is rule 11 in our loaded rule set ➋, the initial block all, but the packet also matches rule 17, which lets it pass in on em0 ➌. The next matching rule 5 at ➍ is apparently a match rule that applies nat-to (note the changed source address). Finally, the packet passes out on xl0 thanks to rule 16 ➎, a matching pass rule.
This example really has only one transformation (the nat-to), but the log (matches) feature allows us to follow the connection’s initial packet through all matching rules in the rule set, including the source address substitution.
Logging All Packets: log (all)
For most debugging and lightweight monitoring purposes, logging the first packet in a connection provides enough information. However, sometimes you may want to log all packets that match certain rules. To do so, use the (all) logging option in the rules you want to monitor. After making this change to our minimal rule set, we have the following:
block log (all)
pass log (all) quick proto tcp to port ssh keep state
This option makes the logs quite a bit more verbose. To illustrate just how much more data log (all) generates, we’ll use the following rule set fragment, which passes domain name lookups and network time synchronizations:
udp_services = "{ domain, ntp }"
pass log (all) inet proto udp to port $udp_services
With these rules in place, here’s an example of what happens when a Russian name server sends a domain name request to a server in our network:
$ sudo tcpdump -lnttti pflog0 port domain
tcpdump: WARNING: snaplen raised from 116 to 160
tcpdump: listening on pflog0, link-type PFLOG
Sep 30 14:27:41.260190 212.5.66.14.53 > 194.54.107.19.53:[|domain]
Sep 30 14:27:41.260253 212.5.66.14.53 > 194.54.107.19.53:[|domain]
Sep 30 14:27:41.260267 212.5.66.14.53 > 194.54.107.19.53:[|domain]
Sep 30 14:27:41.260638 194.54.107.19.53 > 212.5.66.14.53:[|domain]
Sep 30 14:27:41.260798 194.54.107.19.53 > 212.5.66.14.53:[|domain]
Sep 30 14:27:41.260923 194.54.107.19.53 > 212.5.66.14.53:[|domain]
We now have six entries instead of just one.
Even with all but port domain filtered out by tcpdump, adding log (all) to one or more rules considerably increases the amount of data in your logs. If you need to log all traffic but your gateway’s storage capacity is limited, you may find yourself shopping for additional storage, and the added I/O activity may in fact have a negative impact on performance. Also, recording and storing traffic logs with this level of detail is likely to have legal implications.
Logging to Several pflog Interfaces
Versions of PF newer than OpenBSD 4.1 make it possible to direct your log data to more than one pflog interface. In OpenBSD 4.1, the pflog interface became a cloneable device, meaning that you can use ifconfig commands to create several pflog interfaces, in addition to the default pflog0. This makes it possible to record the log data for different parts of your rule set to separate pflog interfaces, and it makes it easier to process the resulting data separately if necessary.
Moving from the default single pflog0 interface to several pflog interfaces requires some changes to your setup that are subtle but effective. To log to several interfaces, make sure that all the log interfaces your rule set uses are created. You don’t need to create the devices before the rule set is loaded; if your rule set logs to a nonexistent interface, the log data is simply discarded.
When tuning your setup to use several pflog interfaces, you’ll most likely add the required interfaces from the command line, like so:
$ sudo ifconfig create pflog1Specify the log device when you add the log keyword to your rule set, as follows:
pass log (to pflog1) proto tcp to $emailserver port $email
pass log (to pflog1) proto tcp from $emailserver to port smtp
For a more permanent configuration on OpenBSD, create a hostname. pflog1 file containing only up and similar hostname.pflogN files for any additional logging interfaces.
On FreeBSD, the configuration of the cloned pflog interfaces belongs in your rc.conf file in the following form:
ifconfig_pflog1="up"
As of this writing, cloning pflog interfaces on NetBSD isn’t an option.
As you saw in Chapter 6, directing log information for different parts of your rule set to separate interfaces makes it possible to feed different parts of the log data PF produces to separate applications. This makes it easier to have programs like spamlogd process only the relevant information, while you feed other parts of your PF log data to other log-processing programs.
Logging to syslog, Local or Remote
One way to avoid storing PF log data on the gateway itself is to instruct your gateway to log to another machine. If you already have a centralized logging infrastructure in place, this is a fairly logical thing to do, even if PF’s ordinary logging mechanisms weren’t really designed with traditional syslog-style logging in mind.
As any old BSD hand will tell you, the traditional syslog system log facility is a bit naive about managing the data it receives over UDP from other hosts, with denial-of-service attacks involving full disks one frequently mentioned danger. There’s also the ever-present risk that log information will be lost under high load on either individual systems or the network. Therefore, consider setting up remote logging only if all hosts involved communicate over a well-secured and properly dimensioned network. On most BSDs, syslogd isn’t set up by default to accept log data from other hosts. (See the syslogd man page for information about how to enable listening for log data from remote hosts if you plan to use remote syslog logging.)
If you’d still like to do your PF logging via syslog, the following is a short recipe for how to accomplish this. In ordinary PF setups, pflogd copies the log data to the log file. When you want to store the log data on a remote system, you should disable pflog’s data accumulation by changing daemon’s startup options in rc.conf.local (on OpenBSD), like so:
pflogd_flags="NO"
On FreeBSD and NetBSD, change the pflog_flats= setting line in rc.conf. Then kill the pflogd process. Next, make sure that the log data, now no longer collected by pflogd, is transmitted in a meaningful way to your log-processing system instead. This step has two parts: First, set up your system logger to transmit data to the log-processing system, and then use tcpdump with logger to convert the data and inject it into the syslog system.
To set up syslogd to process the data, choose your log facility, log level, and action and put the resulting line in /etc/syslog.conf. These concepts are very well explained in man syslog.conf, which is required reading if you want to understand system logs. The action part is usually a file in a local file-system. For example, if you’ve already set up the system logger at loghost.example.com to receive your data, choose log facility local2 with log level info and enter this line:
local2.info @loghost.example.com
Once you’ve made this change, restart syslogd to make it read the new settings.
Next, set tcpdump to convert the log data from the pflog device and feed it to logger, which will then send it to the system logger. Here, we reuse the tcpdump command from the basic examples earlier in this chapter, with some useful additions:
$ sudo nohup tcpdump -lnettti pflog0 | logger -t pf -p local2.info &The nohup command makes sure the process keeps running even if it doesn’t have a controlling terminal or it’s put in the background (as we do here with the trailing &). The -l option to the tcpdump command specifies line-buffered output, which is useful for redirecting to other programs. The logger option adds the tag pf to identify the PF data in the stream and specifies log priority with the -p option as local2.info. The result is logged to the file you specify on the logging host, with entries that will look something like this:
pf: Sep 21 14:05:11.492590 rule 93/(match) pass in on ath0:
10.168.103.11.15842 > 82.117.50.17.80: [|tcp] (DF)
pf: Sep 21 14:05:11.492648 rule 93/(match) pass out on xl0:
194.54.107.19.15842 > 82.117.50.17.80: [|tcp] (DF)
pf: Sep 21 14:05:11.506289 rule 93/(match) pass in on ath0:
10.168.103.11.27984 > 82.117.50.17.80: [|tcp] (DF)
pf: Sep 21 14:05:11.506330 rule 93/(match) pass out on xl0:
194.54.107.19.27984 > 82.117.50.17.80: [|tcp] (DF)
pf: Sep 21 14:05:11.573561 rule 136/(match) pass in on ath0:
10.168.103.11.6430 > 10.168.103.1.53:[|domain]
pf: Sep 21 14:05:11.574276 rule 136/(match) pass out on xl0:
194.54.107.19.26281 > 209.62.178.21.53:[|domain]
This log fragment shows mainly Web-browsing activities from a client in a NATed local network, as seen from the gateway’s perspective, with accompanying domain name lookups.
Tracking Statistics for Each Rule with Labels
The sequential information you get from retrieving log data basically tracks packet movements over time. In other contexts, the sequence or history of connections is less important than aggregates, such as the number of packets or bytes that have matched a rule since the counters were last cleared.
At the end of Chapter 2, you saw how to use pfctl -s info to view the global aggregate counters, along with other data. For a more detailed breakdown of the data, track traffic totals on a per-rule basis with a slightly different form of pfctl command, such as pfctl -vs rules, to display statistics along with the rule, as shown here:
$ pfctl -vs rules
pass inet proto tcp from any to 192.0.2.225 port = smtp flags S/SA keep state label "mail-in"
  [ Evaluations: 1664158 Packets: 1601986 Bytes: 763762591 States: 0 ]
  [ Inserted: uid 0 pid 24490 ]
pass inet proto tcp from 192.0.2.225 to any port = smtp flags S/SA keep state label "mail-out"
  [ Evaluations: 2814933 Packets: 2711211 Bytes: 492510664 States: 0 ]
  [ Inserted: uid 0 pid 24490 ]
The format of this output is easy to read, and it’s obviously designed for contexts in which you want to get an idea of what’s going on at a glance. If you specify even more verbose output with pfctl -vvs rules, you’ll see essentially the same display, with rule numbers added. On the other hand, the output from this command isn’t very well suited for feeding to a script or other program for further processing. To extract these statistics and a few more items in a script-friendly format—and to make your own decisions about which rules are worth tracking)—use rule labels.
Labels do more than identify rules for processing specific kinds of traffic; they also make it easier to extract the traffic statistics. By attaching labels to rules, you can store certain extra data about parts of your rule set. For example, you could use labeling to measure bandwidth use for accounting purposes.
In the following example, we attach the labels mail-in and mail-out to our pass rules for incoming and outgoing mail traffic, respectively.
pass log proto { tcp, udp } to $emailserver port smtp label "mail-in"
pass log proto { tcp, udp } from $emailserver to port smtp label "mail-out"
Once you’ve loaded the rule set with labels, check the data using pfctl -vsl:
$ sudo pfctl -vsl
    ➊      ➋       ➌        ➍        ➎       ➏        ➐       ➑
mail-in 1664158 1601986 763762591 887895 682427415 714091 81335176
mail-out 2814933 2711211 492510664 1407278 239776267 1303933 252734397
This output contains the following information:
➊ The label
➋ The number of times the rule has been evaluated
➌ The total number of packets passed
➍ The total number of bytes passed
➎ The number of packets passed in
➏ The number of bytes passed in
➐ The number of packets passed out
➒ The number of bytes passed out
The format of this list makes it very well suited for parsing by scripts and applications.
The labels accumulate data from the time the rule set is loaded until their counters are reset. And, in many contexts, it makes sense to set up a cron job that reads label values at fixed intervals and then puts those values into permanent storage.
If you choose to run the data collection at fixed intervals, consider collecting the data using pfctl -vsl -z. The z option resets the counters once pfctl has read them, with the result that your data collector will then fetch periodic data, accumulated since the command or the script was last run.
Note
Rules with macros and lists expand to several distinct rules. If your rule set contains rules with lists and macros that have a label attached, the in-memory result will be a number of rules, each with a separate, identically named label attached to it. While this may lead to confusing sudo pfctl -vsl output, it shouldn’t be a problem as long as the application or script that receives the data can interpret the data correctly by adding up the totals for the identical labels.
If this type of data collection sounds useful to you, it’s also worth noting that recent PF versions offer the option of collecting traffic metadata as NetFlow or IPFIX data. See Collecting NetFlow Data with pflow(4) for details.
Additional Tools for PF Logs and Statistics
One other important component of staying in control of your network is having the ability to keep an updated view of your system’s status. In this section, we’ll examine a selection of monitoring tools that you may find useful. All the tools presented here are available either in the base system or via the package system on OpenBSD and FreeBSD (and, with some exceptions, on NetBSD).
Keeping an Eye on Things with systat
If you’re interested in seeing an instant snapshot of the traffic passing through your systems right now, the systat program on OpenBSD offers several useful views. In Chapter 7, we looked briefly at systat queues to see how traffic was assigned to queues in our traffic-shaping rule sets. Here, we’ll review some additional useful options.
The systat program is available on all BSD operating systems, in slightly different versions. On all systems, systat offers views of system statistics, with some minor variations in syntax and output. For example, the queues view is one of several systat views available in recent OpenBSD versions, but not in FreeBSD or NetBSD as of this writing.
For a more general view of the current state table than that offered by queues, try systat states, which gives a listing very similar to the top(1) process listing. Here’s an example of typical systat states output:
   2 users     Load 0.24 0.28 0.27 (1-16 of 895)       Wed Apr 1 14:00:04 2015

PR   D SRC                  DEST                 STATE    AGE   EXP  PKTS BYTES  RATE  PEAK   AVG RU G
udp  O 192.168.103.1:56729  192.168.103.9:12345   1:0   8340m    25  372K  542M  1492  4774  1137  *
tcp  I 10.168.103.15:47185  213.187.179.198:22    4:4   62377 86398  2954  613K 13264 23654    10  18
tcp  I 10.168.103.15:2796   213.187.179.198:22    4:4   62368 86219  4014  679K     0     0    11  18
tcp  I 10.168.103.15:15599  129.240.64.10:6667    4:4   61998 86375  9266  849K     0    58    14  *
tcp  O 213.187.179.198:1559 129.240.64.10:6667    4:4   61998 86375  9266  849K     0    58    14  * 1
tcp  I 10.168.103.15:8923   140.211.166.4:6667    4:4   61843 86385 15677 4794K     0   299    79  *
tcp  O 213.187.179.198:8923 140.211.166.4:6667    4:4   61843 86385 15677 4794K     0   299    79  * 1
tcp  I 10.168.103.15:47047  217.17.33.10:6667     4:4   61808 86385  7093  556K     0    88     9  *
tcp  O 213.187.179.198:4704 217.17.33.10:6667     4:4   61808 86385  7093  556K     0    88     9  * 1
tcp  I 10.168.103.15:30006  203.27.221.42:6667    4:4   61744 86375  6000  487K     0    49     8  *
tcp  O 213.187.179.198:3000 203.27.221.42:6667    4:4   61744 86375  6000  487K     0    49     8  * 1
tcp  I 10.168.103.15:31709  209.250.145.51:6667   4:4   61744 86385  6646  613K     0   114    10  *
tcp  O 213.187.179.198:3170 209.250.145.51:6667   4:4   61744 86385  6646  613K     0   114    10  * 1
tcp  I 192.168.103.254:5386 69.90.74.197:80       4:4   56718 29844    10  3282     0     0     0  *
tcp  O 213.187.179.198:5386 69.90.74.197:80       4:4   56718 29844    10  3282     0     0     0  * 1
tcp  I 10.168.103.15:33241  192.168.103.84:22     4:4   46916 82678  7555  897K     0     0    19  *
If your states don’t fit on one screen, just page through the live display.
Similarly, systat rules displays a live view of packets, bytes, and other statistics for your loaded rule set, as in this example:
2 users       Load 1.25 0.87 0.52  (1-16 of 239)        Fri Apr  3 14:01:59 2015

RUL ANCHOR      A DIR L Q IF    PR   K   PKTS BYTES STATE MAX INFO
  0             M In                      26M   12G 4946K     all max-mss 1440
  1             M Out     nfe0          4853K 3162M 94858     inet from 10.0.0.0/8 to any queue(q_def
  2             M Out     nfe0          3318K 2430M 61672     inet from 192.168.103.0/24 to any queue
  3             M Out     nfe0  tcp     6404K 4341M  134K     from any to any port = www queue(q_web,
  4             M Out     nfe0  tcp     84298   43M  1594     from any to any port = https queue(q_we
  5             M Out     nfe0  tcp       502 34677    63     from any to any port = domain queue(q_d
  6             M Out     nfe0  udp      512K   64M  257K     from any to any port = domain queue(q_d
  7             M Out     nfe0  icmp       11  1008     3     all queue(q_dns, q_pri)
  8             B Any L                 14638 1346K     0     return all
  9             B Any  Q                   95  5628     0     return from <bruteforce> to any
 10             P Any                   1139K 1005M   757     all flags any
 11             P In   Q        tcp  K  18538 1350K   708     inet from any to any port = ftp
 12             P Out           tcp  K      0     0     0     inet from 127.0.0.1/32 to any port = ftp
 13             P Any                    1421  128K   134     all flags any
 14             P In L    egres tcp  K  1830K   87M 18933     inet from any to any port = smtp queue
 15             P In L    egres tcp  K     31  5240     2     from <nospamd> to any port = smtp
The systat rules view is especially useful because it offers a live view into the fully parsed and loaded rule set. For example, if your rule set behaves oddly, the rules view can point you in the right direction and show you the flow of packets.
The systat program also offers a view that presents the same data you’d get via pfctl -s status on the command line. The following example shows part of the output of systat pf. The systat pf view offers more information than will fit on most screens, but you can page through the live display of the data.
2 users    Load 0.34 0.64 0.47  (1-16 of 51)        Fri Apr  3 14:04:04 2015

         TYPE NAME                          VALUE       RATE NOTES
           pf Status                      Enabled
           pf Since                     139:05:08
           pf Debug                           err
           pf Hostid                   0x82aea702

         nfe0 Bytes In                 6217042900            IPv4
         nfe0 Bytes In                          0            IPv6
         nfe0 Bytes Out                5993394114            IPv4
         nfe0 Bytes Out                        64            IPv6
         nfe0 Packets In                 12782504            IPv4, Passed
         nfe0 Packets In                        0            IPv6, Passed
         nfe0 Packets In                    11096            IPv4, Blocked
         nfe0 Packets In                        0            IPv6, Blocked
         nfe0 Packets Out                12551463            IPv4, Passed
         nfe0 Packets Out                       1            IPv6, Passed
         nfe0 Packets Out                     167            IPv4, Blocked
The systat program offers quite a few other views, including network-related ones, such as netstat, vmstat for virtual memory statistics, and iostat for input/output statistics by device. You can cycle through all systat views using the left and right cursor keys. (See man systat for full details.)
Keeping an Eye on Things with pftop
If your system doesn’t have a systat version with the PF-related views, you can still keep an eye on what’s passing into and out of your network in real time using Can Erkin Acar’s pftop. This command shows a running snapshot of your traffic. pftop isn’t included in the base system, but it’s available as a package—in ports on OpenBSD and FreeBSD as sysutils/pftop[44] and on NetBSD via pkgsrc as sysutils/pftop. Here’s an example of its output:
pfTop: Up State 1-17/771, View: default, Order: none, Cache: 10000                             14:05:42

PR    DIR SRC                   DEST                           STATE            AGE   EXP   PKTS  BYTES
udp   Out 192.168.103.1:56729   192.168.103.9:12345        SINGLE:NO_TRAFFIC  8346m    22   373K   543M
tcp   In  10.168.103.15:47185   213.187.179.198:22    ESTABLISHED:ESTABLISHED 62715 86395   3232   667K
tcp   In  10.168.103.15:2796    213.187.179.198:22    ESTABLISHED:ESTABLISHED 62706 86369   4071   686K
tcp   In  10.168.103.15:15599   129.240.64.10:6667    ESTABLISHED:ESTABLISHED 62336 86379   9318   854K
tcp   Out 213.187.179.198:15599 129.240.64.10:6667    ESTABLISHED:ESTABLISHED 62336 86379   9318   854K
tcp   In  10.168.103.15:8923    140.211.166.4:6667    ESTABLISHED:ESTABLISHED 62181 86380  15755  4821K
tcp   Out 213.187.179.198:8923  140.211.166.4:6667    ESTABLISHED:ESTABLISHED 62181 86380  15755  4821K
tcp   In  10.168.103.15:47047   217.17.33.10:6667     ESTABLISHED:ESTABLISHED 62146 86379   7132   559K
tcp   Out 213.187.179.198:47047 217.17.33.10:6667     ESTABLISHED:ESTABLISHED 62146 86379   7132   559K
tcp   In  10.168.103.15:30006   203.27.221.42:6667    ESTABLISHED:ESTABLISHED 62082 86380   6034   489K
tcp   Out 213.187.179.198:30006 203.27.221.42:6667    ESTABLISHED:ESTABLISHED 62082 86380   6034   489K
tcp   In  10.168.103.15:31709   209.250.145.51:6667   ESTABLISHED:ESTABLISHED 62082 86379   6685   617K
tcp   Out 213.187.179.198:31709 209.250.145.51:6667   ESTABLISHED:ESTABLISHED 62082 86379   6685   617K
tcp   In  192.168.103.254:53863 69.90.74.197:80       ESTABLISHED:ESTABLISHED 57056 29506     10   3282
tcp   Out 213.187.179.198:53863 69.90.74.197:80       ESTABLISHED:ESTABLISHED 57056 29506     10   3282
tcp   In  10.168.103.15:33241   192.168.103.84:22     ESTABLISHED:ESTABLISHED 47254 82340   7555   897K
tcp   Out 10.168.103.15:33241   192.168.103.84:22     ESTABLISHED:ESTABLISHED 47254 82340   7555   897K
You can use pftop to sort your connections by a number of different criteria, including by PF rule, volume, age, and source and destination addresses.
Graphing Your Traffic with pfstat
Once you have a system up and running and producing data, a graphical representation of traffic data is a useful way to view and analyze your data. One way to graph your PF data is with pfstat, a utility developed by Daniel Hartmeier to extract and present the statistical data that’s automatically generated by PF. The pfstat tool is available via the OpenBSD package system or as the port net/pfstat, via the FreeBSD ports system as sysutils/pfstat, and via NetBSD pkgsrc as sysutils/pfstat.
The pfstat program collects the data you specify in the configuration file and presents that data as JPG or PNG graphics files. The data source can be either PF running on the local system via the /dev/pf device or data collected from a remote computer running the companion pfstatd daemon.
To set up pfstat, you simply decide which parts of your PF data you want to graph and how, and then you write the configuration file and start cron jobs to collect the data and generate your graphs. The program comes with a well-annotated sample configuration file and a useful man page. The sample configuration is a useful starting point for writing your own configuration file. For example, the following pfstat.conf fragment is very close to one you’ll find in the sample configuration:[45]
collect 8 = global states inserts diff
collect 9 = global states removals diff
collect 10 = global states searches diff
image "/var/www/users/peter/bsdly.net/pfstat-states.jpg" {
from 1 days to now
width 980 height 300
left
graph 8 "inserts" "states/s" color 0 192 0 filled,
graph 9 "removals" "states/s" color 0 0 255
right
graph 10 "searches" "states/s" color 255 0 0
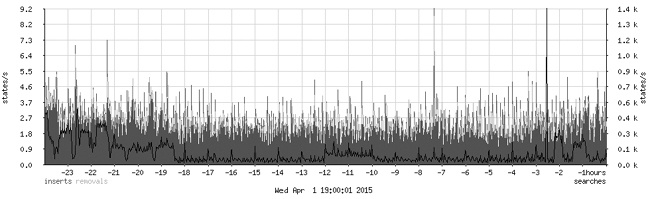
}The configuration here starts off with three collect statements, where each of the data series is assigned a unique numeric identifier. Here, we capture the number of insertions, removals, and searches in the state table. Next up is the image definition, which specifies the data that is to be graphed. The from line specifies the period to display (from 1 days to now means that only data collected during the last 24 hours is to be displayed). width and height specify the graph size measured in number of pixels in each direction. The graph statements specify how the data series are displayed as well as the graph legends. Collecting state insertions, removals, and searches once a minute and then graphing the data collected over one day produces a graph roughly like the one in Figure 9-1.
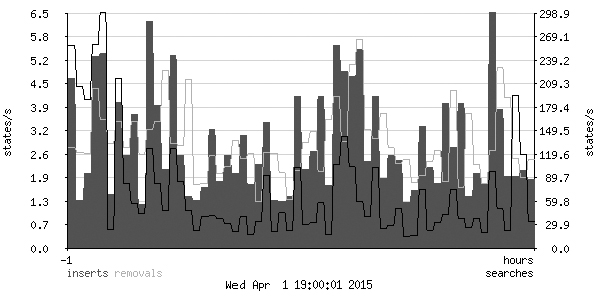
The graph can be tweaked to provide a more detailed view of the same data. For example, to see the data for the last hour in a slightly higher resolution, change the period to from 1 hours to now and the dimensions to width 600 height 300. The result is something like the graph in Figure 9-2.
The pfstat home page at http://www.benzedrine.cx/pfstat.html contains several examples, with demonstrations in the form of live graphs of the data from the benzedrine.cx domain’s gateways. By reading the examples and tapping your own knowledge of your traffic, you should be able to create pfstat configurations that are well suited to your site’s needs.
Note
In addition to pfstat, other system-monitoring packages offer at least some PF-monitoring features. One such package is the popular symon utility, which is usually configured with the symon data gatherer on all monitored systems and at least one host with symux and the optional syweb Web interface. Based on round-robin database tool (RRDtool), symon has a useful interface for recording PF data and offers a useful graphical interface for displaying PF statistics via the syweb Web interface. symon is available as a port or package on OpenBSD and FreeBSD as sysutils/symon, and the syweb Web interface is available as www/syweb.
Collecting NetFlow Data with pflow(4)
NetFlow is a network data collection and analysis method that has spawned many supporting tools for recording and analyzing data about TCP/IP connections. NetFlow originated at Cisco and over time has become an essential feature in various network equipment as a tool for network management and analysis.
The NetFlow data model defines a network flow as a unidirectional sequence of packets with the same source and destination IP address and protocol. For example, a TCP connection will appear in NetFlow data as two flows: one in each direction.
PF data can be made available to NetFlow tools via the pflow(4) pseudo-interface that was introduced in OpenBSD 4.5 along with the pflow state option. Essentially, all the information you’d expect to find in a NetFlow-style flow record is easily derived from the data PF keeps in the state table, and the pflow interface offers a straightforward way to export PF state-table data in this processing-friendly and well-documented format. As with other logging, you enable NetFlow data collection in your PF rule set on a per-rule basis.
A complete NetFlow-based network-monitoring system consists of several distinct parts. The NetFlow data originates at one or more sensors that generate data about network traffic. The sensors forward data about the flows to a collector, which stores the data it receives. Finally, a reporting or analysis system lets you extract and process the data.[46]
Setting Up the NetFlow Sensor
The NetFlow sensor requires two components: one or more configured pflow(4) devices and at least one pass rule in your rule set with the pflow state option enabled. The pflow interfaces are created with two required parameters: the flow source IP address and flow destination’s IP address and port. Here’s an example of the ifconfig command for the /etc/hostname.pflow0 file:
flowsrc 192.0.2.1 flowdst 192.0.2.105:3001
From the command line, use this command:
$ sudo ifconfig pflow0 create flowsrc 192.0.2.1 flowdst 192.0.2.105:3001In both cases, this command sets up the host to send NetFlow data with a flow source address 192.0.2.1 to a collector that should listen for NetFlow data at 192.0.2.105, UDP port 3001.
Note
It’s possible to set up several pflow devices with separate flow destinations. It’s not currently possible, however, to specify on a per-rule basis which pflow device should receive the generated data.
After enabling the pflow device, specify in /etc/pf.conf which pass rules should provide NetFlow data to the sensor. For example, if your main concern is to collect data on your clients’ email traffic to IPv4 hosts, this rule would set up the necessary sensor:
pass out log inet proto tcp from <client> to port $email
      label client-email keep state (pflow)
When pflow was first introduced to PF, the immediate reaction from early adopters was that more likely than not, they’d want to add the pflow option to most pass rules in their rule sets. This led PF developer Henning Brauer to introduce another useful PF feature—the ability to set state defaults that apply to all rules unless otherwise specified. For example, if you add the following line at the start of your rule set, all pass rules in the configuration will generate NetFlow data to be exported via the pflow device.
set state-defaults pflow
With at least one pflow device configured and at least one rule in your pf.conf that generates data for export via the pflow device, you’re almost finished setting up the sensor. You may still need to add a rule, however, that allows the UDP data to flow from the IP address you specified as the flow data source to the collector’s IP address and target port at the flow destination. Once you’ve completed this last step, you should be ready to turn your attention to collecting the data for further processing.
NetFlow Data Collecting, Reporting, and Analysis
If your site has a NetFlow-based collection and analysis infrastructure in place, you may already have added the necessary configuration to feed the PF-originated data into the data collection and analysis system. If you haven’t yet set up a flow-analysis environment, there are a number of options available.
The OpenBSD packages system offers three NetFlow collector and analysis packages: flow-tools, flowd, and nfdump.[47] All three systems have a dedicated and competent developer and user community as well as various add-ons, including graphical Web interfaces. flow-tools is the main component in many sites’ flow-analysis setups. The nfdump fans point to the nfsen analysis package that integrates the nfdump tools in a powerful and flexible Web-based analysis frontend that will, among other things, display the command-line equivalent of your GUI selections. You’ll find the command-line display useful when you need to drill down further into the data than the selections in the GUI allow. You can copy the command displayed in the GUI and make any further adjustments you need on the nfdump command line in a shell session or script to extract the exact data you want.
To illustrate some basic NetFlow collection and how to extract a subset of the collected data for further analysis, we’ll use flowd, developed by long-time OpenBSD developer Damien Miller and available via the package systems (on OpenBSD as net/flowd and on FreeBSD as net-mgmt/flowd).
I’ve chosen to use flowd here mainly because it was developed to be small, simple, and secure. As you’ll see, flowd still manages to be quite useful and flexible. Flow data operations with other tools will differ in some details, but the underlying principles remain the same.
When compared to other NetFlow collector suites, flowd is very compact, with only two executable programs—the collector daemon flowd and the flow-filtering and presentation program flowd-reader—as well as the supporting library and controlling configuration file. The documentation is adequate, if a bit terse, and the sample /etc/flowd.conf file contains a generous number of comments. Based on the man pages and the comments in the sample configuration file, it shouldn’t take you long to create a useful collector configuration.
After stripping out any comment lines—using grep -v # /etc/flowd.conf or similar—a very basic flowd configuration could look like this:
logfile "/var/log/flowd"
listen on 192.0.2.105:3001
flow source 192.0.2.1
store ALL
While this configuration barely contains more information than the pflow interface’s configuration in the earlier description of setting up the sensor, it does include two important items:
The
logfileline tells us where the collected data is to be stored (and reveals thatflowdtends to store all data in a single file).The final line tells us that
flowdwill store all fields in the data it receives from the designated flow source.
With this configuration in place, start up the flowd daemon, and almost immediately you should see the /var/log/flowd file grow as network traffic passes through your gateway and flow records are collected. After a while, you should be able to look at the data using flowd’s companion program flowd-reader. For example, with all fields stored, the data for one name lookup from a host on the NATed local network looks like this in flowd-reader’s default view:
$ sudo flowd-reader /var/log/flowd
FLOW recv_time 2011-04-01T21:15:53.607179 proto 17 tcpflags 00 tos 00 agent
[213.187.179.198] src [192.0.2.254]:55108 dst [192.0.2.1]:53 packets 1 octets
62
FLOW recv_time 2011-04-01T21:15:53.607179 proto 17 tcpflags 00 tos 00 agent
[213.187.179.198] src [192.0.2.1]:53 dst [192.0.2.254]:55108 packets 1 octets
129
Notice that the lookup generates two flows: one in each direction.
The first flow is identified mainly by the time it was received, followed by the protocol used (protocol 17 is UDP, as /etc/protocols will tell you). The connection had both TCP and TOS flags unset, and the collector received the data from our gateway at 192.0.2.1. The flow’s source address was 192.0.2.254, source port 55108, and the destination address was 192.0.2.1, source port 53, conventionally the DNS port. The flow consisted of 1 packet with a payload of 62 octets. The return flow was received by the collector at the same time, and we see that this flow has the source and destination reversed, with a slightly larger payload of 129 octets. flowd-reader’s output format lends itself to parsing by regular expressions for postprocessing in reporting tools or plotting software.
You might think that this data is all anyone would ever want to know about any particular set of network flows, but it’s possible to extract even more detailed information. For example, using the flowd-reader -v option for verbose output, you might see something like this:
FLOW recv_time 2011-04-01T21:15:53.607179 proto 17 tcpflags 00 tos 00
agent [213.187.179.198] src [192.0.2.254]:55108 dst [192.0.2.1]:53 gateway
[0.0.0.0] packets 1 octets 62 in_if 0 out_if 0 sys_uptime_ms 1w5d19m59s.000
time_sec 2011-04-01T21:15:53 time_nanosec 103798508 netflow ver 5 flow_start
1w5d19m24s.000 flow_finish 1w5d19m29s.000 src_AS 0 src_masklen 0 dst_AS 0
dst_masklen 0 engine_type 10752 engine_id 10752 seq 5184351 source 0 crc32
759adcbd
FLOW recv_time 2011-04-01T21:15:53.607179 proto 17 tcpflags 00 tos 00
agent [213.187.179.198] src [192.0.2.1]:53 dst [192.0.2.254]:55108 gateway
[0.0.0.0] packets 1 octets 129 in_if 0 out_if 0 sys_uptime_ms 1w5d19m59s.000
time_sec 2011-04-01T21:15:53 time_nanosec 103798508 netflow ver 5 flow_start
1w5d19m24s.000 flow_finish 1w5d19m29s.000 src_AS 0 src_masklen 0 dst_AS 0
dst_masklen 0 engine_type 10752 engine_id 10752 seq 5184351 source 0 crc32
f43cbb22
The gateway field indicates that the sensor itself served as the gateway for this connection. You see a list of the interfaces involved (the in_if and out_if values), the sensor’s system uptime (sys_uptime_ms), and a host of other parameters—such as AS numbers (src_AS and dst_AS)—that may be useful for statistics or filtering purposes in various contexts. Once again, the output is ideally suited to filtering via regular expressions.
You don’t need to rely on external software for the initial filtering on the data you collect from your pflow sensor. flowd itself offers a range of filtering features that make it possible to store only the data you need. One approach is to put the filtering expressions in the flowd.conf, as in the following example (with the comments stripped to save space):
logfile "/var/log/flowd.compact"
listen on 192.0.2.105:3001
flow source 192.0.2.1
store SRC_ADDR
store DST_ADDR
store SRCDST_PORT
store PACKETS
store OCTETS
internalnet = "192.0.2.0/24"
unwired = "10.168.103.0/24"
discard src $internalnet
discard dst $internalnet
discard src $unwired
discard dst $unwired
You can choose to store only certain fields in the flow records. For example, in configurations where there’s only one collector or agent, the agent field serves no useful purpose and doesn’t need to be stored. In this configuration, we choose to store only the source and destination address and port, the number of packets, and the number of octets.
You can limit the data you store even further. The macros internalnet and unwired expand to two NATed local networks, and the four discard lines following the macro definitions mean that flowd discards any data it receives about flows with either source or destination addresses in either of those local networks. The result is a more compact set of data, tailored to your specific needs, and you see only routable addresses and the address of the sensor gateway’s external interface:
$ sudo flowd-reader /var/log/flowd.compact | head
FLOW src [193.213.112.71]:38468 dst [192.0.2.1]:53 packets 1 octets 79
FLOW src [192.0.2.1]:53 dst [193.213.112.71]:38468 packets 1 octets 126
FLOW src [200.91.75.5]:33773 dst [192.0.2.1]:53 packets 1 octets 66
FLOW src [192.0.2.1]:53 dst [200.91.75.5]:33773 packets 1 octets 245
FLOW src [200.91.75.5]:3310 dst [192.0.2.1]:53 packets 1 octets 75
FLOW src [192.0.2.1]:53 dst [200.91.75.5]:3310 packets 1 octets 199
FLOW src [200.91.75.5]:2874 dst [192.0.2.1]:53 packets 1 octets 75
FLOW src [192.0.2.1]:53 dst [200.91.75.5]:2874 packets 1 octets 122
FLOW src [192.0.2.1]:15393 dst [158.37.91.134]:123 packets 1 octets 76
FLOW src [158.37.91.134]:123 dst [192.0.2.1]:15393 packets 1 octets 76
Even with the verbose option, flowd-reader’s display reveals only what you explicitly specify in the filtering configuration:
$ sudo flowd-reader -v /var/log/flowd.compact | head
LOGFILE /var/log/flowd.compact
FLOW src [193.213.112.71]:38468 dst [192.0.2.1]:53 packets 1 octets 79
FLOW src [192.0.2.1]:53 dst [193.213.112.71]:38468 packets 1 octets 126
FLOW src [200.91.75.5]:33773 dst [192.0.2.1]:53 packets 1 octets 66
FLOW src [192.0.2.1]:53 dst [200.91.75.5]:33773 packets 1 octets 245
FLOW src [200.91.75.5]:3310 dst [192.0.2.1]:53 packets 1 octets 75
FLOW src [192.0.2.1]:53 dst [200.91.75.5]:3310 packets 1 octets 199
FLOW src [200.91.75.5]:2874 dst [192.0.2.1]:53 packets 1 octets 75
FLOW src [192.0.2.1]:53 dst [200.91.75.5]:2874 packets 1 octets 122
FLOW src [192.0.2.1]:15393 dst [158.37.91.134]:123 packets 1 octets 76
Fortunately, flowd doesn’t force you to make all your filtering decisions when your collector receives the flow data from the sensor. Using the -f flag, you can specify a separate file with filtering statements to extract specific data from a larger set of collected flow data. For example, to see HTTP traffic to your Web server, you could write a filter that stores only flows with your Web server’s address and TCP port 80 as the destination or flows with your Web server and TCP port 80 as the source:
webserver = 192.0.2.227
discard all
accept dst $webserver port 80 proto tcp
accept src $webserver port 80 proto tcp
store RECV_TIME
store SRC_ADDR
store DST_ADDR
store PACKETS
store OCTETS
Assuming you stored the filter in towebserver.flowdfilter, you could then extract traffic matching your filtering criteria from /var/log/flowd, like this:
$ sudo flowd-reader -v -f towebserver.flowdfilter /var/log/flowd | tail
FLOW recv_time 2011-04-01T21:13:15.505524 src [89.250.115.174] dst
[192.0.2.227] packets 6 octets 414
FLOW recv_time 2011-04-01T21:13:15.505524 src [192.0.2.227] dst
[89.250.115.174] packets 4 octets 725
FLOW recv_time 2011-04-01T21:13:49.605833 src [216.99.96.53] dst [192.0.2.227]
packets 141 octets 7481
FLOW recv_time 2011-04-01T21:13:49.605833 src [192.0.2.227] dst [216.99.96.53]
packets 212 octets 308264
FLOW recv_time 2011-04-01T21:14:04.606002 src [91.121.94.14] dst [192.0.2.227]
packets 125 octets 6634
FLOW recv_time 2011-04-01T21:14:04.606002 src [192.0.2.227] dst [91.121.94.14]
packets 213 octets 308316
FLOW recv_time 2011-04-01T21:14:38.606384 src [207.46.199.44] dst
[192.0.2.227] packets 10 octets 642
FLOW recv_time 2011-04-01T21:14:38.606384 src [192.0.2.227] dst
[207.46.199.44] packets 13 octets 16438
FLOW recv_time 2011-04-01T21:15:14.606768 src [213.187.176.94] dst
[192.0.2.227] packets 141 octets 7469
FLOW recv_time 2011-04-01T21:15:14.606768 src [192.0.2.227] dst
[213.187.176.94] packets 213 octets 308278
In addition to the filtering options demonstrated here, the flowd filtering functions take a number of other options. Some of those options will be familiar from other filtering contexts such as PF, including a range of network-oriented parameters; others are more oriented to extracting data on flows originating at specific dates or time periods and other storage-oriented parameters. The full story, as always, is found in man flowd.conf.
Once you’ve extracted the data you need, you have several tools available for processing and presenting your data.
Collecting NetFlow Data with pfflowd
For systems that don’t support NetFlow data export via pflow, NetFlow support is available via the pfflowd package. As we already saw in the previous section, PF state table data maps very well to the NetFlow data model, and pfflowd is intended to record state changes from the local system’s pfsync device. Once enabled, pfflowd acts as a NetFlow sensor that converts pfsync data to NetFlow format for transmission to a NetFlow collector on the network.
The pfflowd tool was written and is maintained by Damien Miller and is available from http://www.mindrot.org/projects/pfflowd/ as well as through the package systems on OpenBSD and FreeBSD as net/pfflowd. The lack of pfsync support on NetBSD means that pfflowd isn’t available on that platform as of this writing.
SNMP Tools and PF-Related SNMP MIBs
Simple Network Management Protocol (SNMP) was designed to let network administrators collect and monitor key data about how their systems run and change configurations on multiple network nodes from a centralized system.[48] The SNMP protocol comes with a well-defined interface and a method for extending the management information base (MIB), which defines the managed devices and objects.
Both proprietary and open source network management and monitoring systems generally have SNMP support in one form or the other, and in some products, it’s a core feature. On the BSDs, SNMP support has generally come in the form of the net-snmp package, which provides the tools you need to retrieve SNMP data and to collect data for retrieval by management systems. The package is available on OpenBSD as net/net-snmp, on FreeBSD as net-mgmt/net-snmp, and on NetBSD as net/net-snmp. OpenBSD’s snmpd (written mainly by Reyk Floeter) debuted as part of the base system in OpenBSD 4.3 and implements all required SNMP functionality. (See man snmpd and man snmpd.conf for details.)
There are MIBs to make PF data available to SNMP monitoring. Joel Knight maintains the MIBs for retrieving data on PF, CARP, and OpenBSD kernel sensors, and he offers them for download from http://www.packetmischief.ca/openbsd/snmp/. The site also offers patches to the net-snmp package to integrate the OpenBSD MIBs.
After installing the package and the extension, your SNMP-capable monitoring systems will be able to watch PF data in any detail you desire. (FreeBSD’s bsnmpd includes a PF module. See the bsnmpd man page for details.)
Log Data as the Basis for Effective Debugging
In this chapter, we walked through the basics of collecting, displaying, and interpreting data about a running system with PF enabled. Knowing how to find and use information about how your system behaves is useful for several purposes.
Keeping track of the status of a running system is useful in itself, but the ability to read and interpret log data is even more essential when testing your setup. Another prime use for log data is to track the effect of changes you make in the configuration, such as when tuning your system to give optimal performance. In the next chapter, we’ll focus on checking your configuration and tuning it for optimal performance, based on log data and other observations.
[44] On OpenBSD, all pftop functionality is included in various systat views, as described in the previous section.
[45] The color values listed in the configuration example would give you a graph with red, blue, and green lines. For the print version of this book, we changed the colors to grayscale values: 0 192 0 became 105 105 105, 0 0 255 became 192 192 192, and 255 0 0 became 0 0 0.
[46] For a more in-depth treatment of network analysis with NetFlow-based tools, see Network Flow Analysis by Michael W. Lucas (No Starch Press, 2010).
[47] The actively maintained project home pages for flow-tools and nfdump are http://code.google.com/p/flow-tools/ and http://nfdump.sourceforge.net/. (The older versions should still be available from http://www.splintered.net/sw/flow-tools/.) The nfsen Web frontend has a project page at http://nfsen.sourceforge.net/. For the latest information about flowd, visit http://www.mindrot.org/flowd.html.
[48] The protocol debuted with RFC 1067 in August 1988 and is now in its third major version as defined in RFCs 3411 through 3418.