
Chapter 9
Human Resources Management
This chapter, which focuses on human resources (HR) data, is the last in the series dealing with cross-industry business applications. Similar to the accounting and finance data described in Chapter 7: Accounting, HR information is disseminated broadly throughout the organization. Organizations want to better understand their employees' demographics, skills, earnings, and performance to maximize their impact. In this chapter we'll explore several dimensional modeling techniques in the context of HR data.
Chapter 9 discusses the following concepts:
- Dimension tables to track employee profile changes
- Periodic headcount snapshots
- Bus matrix for a snippet of HR-centric processes
- Pros and cons of packaged DW/BI solutions or data models
- Recursive employee hierarchies
- Multivalued skill keyword attributes handled via dimension attributes, outriggers, or bridges
- Survey questionnaire data
- Text comments
Employee Profile Tracking
Thus far the dimensional models we have designed closely resemble each other; the fact tables contain key performance metrics that typically can be added across all the dimensions. It is easy for dimensional modelers to get lulled into a kind of additive complacency. In most cases, this is exactly how it is supposed to work. However, with HR employee data, a robust employee dimension supports numerous metrics required by the business on its own.
To frame the problem with a business vignette, let's assume you work in the HR department of a large enterprise. Each employee has a detailed HR profile with at least 100 attributes, including hire date, job grade, salary, review dates, review outcomes, vacation entitlement, organization, education, address, insurance plan, and many others. Employees are constantly hired, transferred, and promoted, as well as adjusting their profiles in a variety of ways.
A high-priority business requirement is to accurately track and analyze employee profile changes. You might immediately visualize a schema in which each employee profile change event is captured in a transaction-grained fact table, as depicted in Figure 9.1. The granularity of this somewhat generalized fact table would be one row per employee profile transaction. Because no numeric metrics are associated with changes made to employee profiles, such as a new address or job grade promotion, the fact table is factless.
Figure 9.1 Initial draft schema for tracking employees' profile changes.
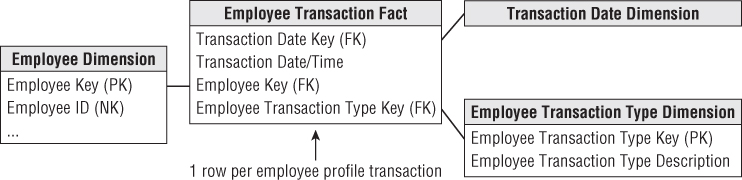
In this draft schema, the dimensions include the transaction date, transaction type, and employee. The transaction type dimension refers to the reason code that caused the creation of this particular row, such as a promotion or address change. The employee dimension is extremely wide with many attribute columns.
We envision using the type 2 slowly changing dimension technique for tracking changed profile attributes within the employee dimension. Consequently, with every employee profile transaction in the Figure 9.1 fact table, you would also create a new type 2 row in the employee dimension that represents the employee's profile as a result of the profile change event. This new row continues to accurately describe the employee until the next employee transaction occurs at some indeterminate time in the future. The alert reader is quick to point out that the employee profile transaction fact table and type 2 employee dimension table have the same number of rows; plus they are almost always joined to one another. At this point dimensional modeling alarms should be going off. You certainly don't want to have as many rows in a fact table as you do in a related dimension table.
Instead of using the initial schema, you can simplify the design by embellishing the employee dimension table to make it more powerful and thereby doing away with the profile transaction event fact table. As depicted in Figure 9.2, the employee dimension contains a snapshot of the employee profile characteristics following the employee's profile change. The transaction type description becomes a change reason attribute in the employee dimension to track the cause for the profile change. In some cases, the affected characteristics are numeric. If the numeric attributes are summarized rather than simply constrained upon, they belong in a fact table instead.
Figure 9.2 Employee dimension with profile characteristics.
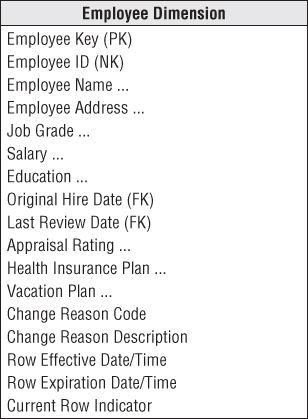
As you'd expect, the surrogate employee key is the primary key of the dimension table; the durable natural employee ID used in the HR operational system to persistently identify an employee is included as a dimension attribute.
Precise Effective and Expiration Timespans
As discussed in Chapter 5: Procurement with the coverage of slowly changing dimension techniques, you should include two columns on the employee dimension to capture when a specific row is effective and then expired. These columns define a precise timespan during which the employee's profile is accurate. Historically, when daily data latency was the norm, the effective and expiration columns were dates. However, if you load data from any business process on a more frequent basis, the columns should be date/time stamps so that you can associate the appropriate employee profile row, which may differ between 9 a.m. and 9 p.m. on the same day, to operational events.
The expiration attribute for the current row is set to a future date. When the row needs to be expired because the ETL system has detected a new profile of attributes, the expiration attribute is typically set to “just before” the new row's effective stamp, meaning either the prior day, minute, or second.
If the employee's profile is accurately changed for a period of time, then the employee reverts back to an earlier set of characteristics, a new employee dimension row is inserted. You should resist the urge to simply revisit the earlier profile row and modify the expiration date because multiple dimension rows would be effective at the same time.
The current row indicator enables the most recent status of any employee to be retrieved quickly. If a new profile row occurs for this employee, the indicator in the former profile row needs to be updated to indicate it is no longer the current profile.
On its own, a date/time stamped type 2 employee dimension answers a number of interesting HR inquiries. You can choose an exact historical point in time and ask how many employees you have and what their detailed profiles were at that specific moment by constraining the date/time to be equal to or greater than the effective date/time and strictly less than the expiration date/time. The query can perform counts and constraints against all the rows returned from these constraints.
Dimension Change Reason Tracking
When a dimension row contains type 2 attributes, you can embellish it with a change reason. In this way, some ETL-centric metadata is embedded with the actual data. The change reason attribute could contain a two-character abbreviation for each changed attribute on a dimension row. For example, the change reason attribute value for a last name change could be LN or a more legible value, such as Last Name, depending on the intended usage and audience. If someone asks how many people changed ZIP codes last year, the SELECT statement would include a LIKE operator and wild cards, such as “WHERE ChangeReason LIKE ‘%ZIP%’”.
Because multiple dimension attributes may change concurrently and be represented by a single new row in the dimension, the change reason would be multivalued. As we'll explore later in the chapter when discussing employee skills, the multiple reason codes could be handled as a single text string attribute, such as “|Last Name|ZIP|” or via a multivalued bridge table.
Finally, employee profile changes may be captured in the underlying source system by a set of micro-transactions corresponding to each individual employee attribute change. In the DW/BI system, you may want to encapsulate the series of micro-transactions from the source system and treat them as a super transaction, such as an employee promotion because it would be silly to treat these artificial micro-transactions as separate type 2 changes. The new type 2 employee dimension row would reflect all the relevant changed attributes in one step. Identifying these super transactions may be tricky. Obviously the best way to identify them is to ensure the HR operational application captures the higher level action.
Profile Changes as Type 2 Attributes or Fact Events
We just described the handling of employee attribute changes as slowly changing dimension type 2 attributes with profile effective and expiration dates within the employee dimension. Designers sometimes wholeheartedly embrace this pattern and try to leverage it to capture every employee-centric change. This results in a dimension table with potentially hundreds of attributes and millions of rows for a 100,000-employee organization given the attributes' volatility.
Tracking changes within the employee dimension table enables you to easily associate the employee's accurate profile with multiple business processes. You simply load these fact tables with the employee key in effect when the fact event occurred, and filter and group based on the full spectrum of employee attributes.
But the pendulum can swing too far. You probably shouldn't use the employee dimension to track every employee review event, every benefit participation event, or every professional development event. As illustrated in Figure 9.4's bus matrix in the next section, many of these events involve other dimensions, like an event date, organization, benefit description, reviewer, approver, exit interviewer, separation reasons, and the list goes on. Consequently, most of them should be handled as separate process-centric fact tables. Although many human resources events are factless, capturing them within a fact table enables business users to easily count or trend by time periods and all the other associated dimensions.
It's certainly common to include the outcome of these HR events, like the job grade resulting from a promotion, as an attribute on the employee dimension. But designers sometimes err by including lots of foreign keys to outriggers for the reviewer, benefit, separation reason and other dimensions within the employee dimension, resulting in an overloaded dimension that's difficult to navigate.
Headcount Periodic Snapshot
In addition to profiling employees in HR, you also want to report statuses of the employees on a regular basis. Business managers are interested in counts, statistics, and totals, including number of employees, salary paid, vacation days taken, vacation days accrued, number of new hires, and number of promotions. They want to analyze the data by all possible slices, including time and organization, plus employee characteristics.
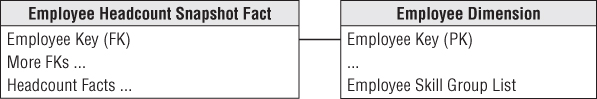
As shown in Figure 9.3, the employee headcount periodic snapshot consists of an ordinary looking fact table with three dimensions: month, employee, and organization. The month dimension table contains the usual descriptors for the corporate calendar at the month grain. The employee key corresponds to the employee dimension row in effect at the end of the last day of the given reporting month to guarantee the month-end report is a correct depiction of the employees' profiles. The organization dimension contains a description of the organization to which the employee belongs at the close of the relevant month.
Figure 9.3 Employee headcount periodic snapshot.
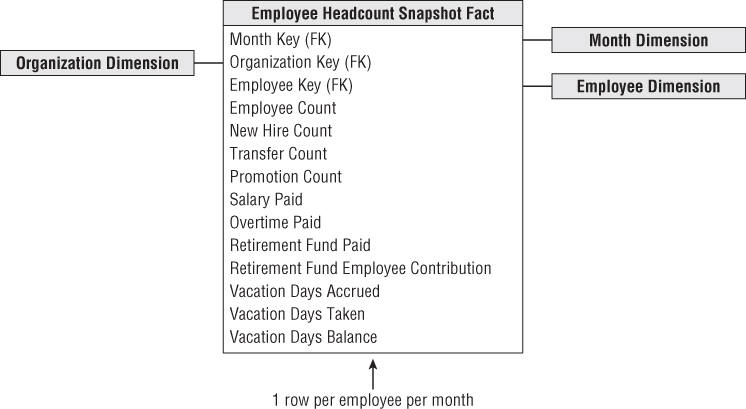
The facts in this headcount snapshot consist of monthly numeric metrics and counts that may be difficult to calculate from the employee dimension table alone. These monthly counts and metrics are additive across all the dimensions or dimension attributes, except for any facts labeled as balances. These balances, like all balances, are semi-additive and must be averaged across the month dimension after adding across the other dimensions.
Bus Matrix for HR Processes
Although an employee dimension with precise type 2 slowly changing dimension tracking coupled with a monthly periodic snapshot of core HR performance metrics is a good start, they just scratch the surface when it comes to tracking HR data. Figure 9.4 illustrates other processes that HR professionals and functional managers are likely keen to analyze. We've embellished this preliminary bus matrix with the type of fact table that might be used for each process; however, your source data realities and business requirements may warrant a different or complementary treatment.
Figure 9.4 Bus matrix rows for HR processes.
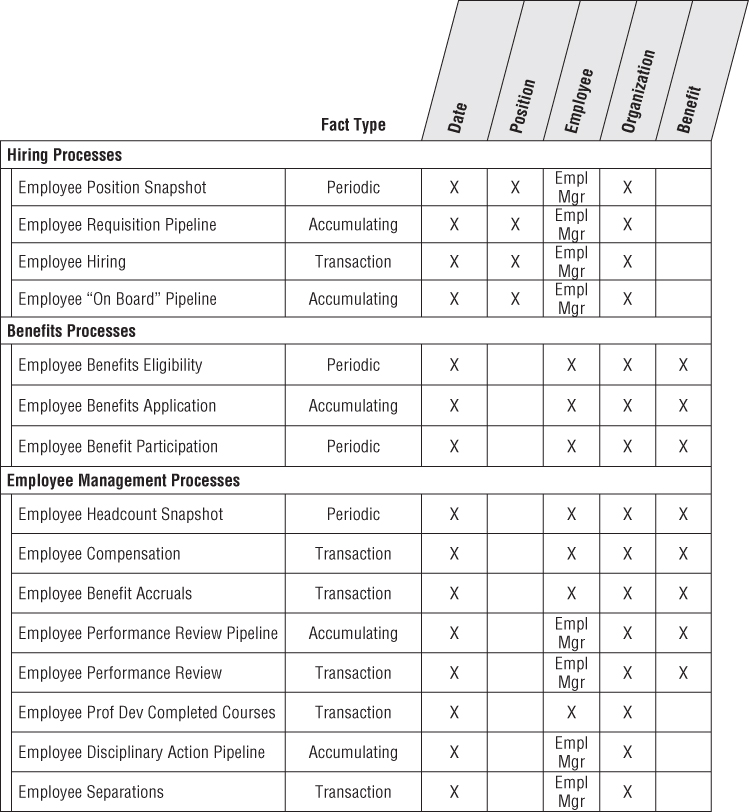
Some of these business processes capture performance metrics, but many result in factless fact tables, such as benefit eligibility or participation.
Packaged Analytic Solutions and Data Models
Many organizations purchase a vendor solution to address their operational HR application needs. Most of these products offer an add-on DW/BI solution. In addition, other vendors sell standard data models, potentially with prebuilt data loaders for the popular HR application products.
Vendors and proponents argue these standard, prebuilt solutions and models allow for more rapid, less risky implementations by reducing the scope of the data modeling and ETL development effort. After all, every HR department hires employees, signs them up for benefits, compensates them, reviews them, and eventually processes employee separations. Why bother re-creating the wheel by designing custom data models and solutions to support these common business processes when you can buy a standard data model or complete solution instead?
Although there are undoubtedly common functions, especially within the HR space, businesses typically have unique peculiarities. To handle these nuances, most application software vendors introduce abstractions in their products, which enable them to be more easily “customized.”
These abstractions, like the party table and associated apparatus to describe each role or generic attribute column names rather than more meaningful labels, provide flexibility to adapt to a variety of business situations. Although implementation adaptability is a win for vendors who want their products to address a broad range of potential customers' business scenarios, the downside is the associated complexity.
HR professionals who live with the vendor's product 24x7 are often willing to adjust their vocabulary to accommodate the abstractions. But these abstractions can feel like a foreign language for less-immersed functional managers. Delivering data to the business via a packaged DW/BI solution or industry-standard data model may bypass the necessary translations into the business's vernacular.
Besides the reliance on the vendor's terminology instead of incorporating the business's vocabulary in the DW/BI solution, another potential sharp corner is the integration of source data from other domains. Can you readily conform the dimensions in the vendor solution or industry model with other internally available master data? If not, the packaged model is destined to become another isolated stovepipe data set. Clearly, this outcome is unappealing; although it may be less of an obstacle if all your operational systems are supported by the same ERP vendor, or you're a small organization without an IT shop doing independent development.
What can you realistically expect to gain from a packaged model? Prebuilt generic models can help identify core business processes and associate common dimensions. That provides some comfort for DW/BI teams feeling initially overwhelmed by the design task. After a few days or weeks studying the standard model, most teams gain enough confidence to want to customize the schema for their data.
However, is this knowledge worth the price tag associated with the packaged solution or data model? You could likely gain the same insight by spending a few weeks with the business users. You'd not only improve your understanding of the business's needs, but also begin bonding business users to the DW/BI initiative.
It's also worth mentioning that just because a packaged model or solution costs thousands of dollars doesn't mean it exhibits generally accepted dimensional modeling best practices. Unfortunately, some standard models embody common dimensional modeling design flaws; this isn't surprising if the model's designers focused more on best practices for source system data capture rather than those required for BI reporting and analytics. It's difficult to design a predefined generic model, even if the vendor owns the data capture source code.
Recursive Employee Hierarchies
A common employee characteristic is the name of the employee's manager. You could simply embed this attribute along with the other attributes in the employee dimension. But if the business users want more than the manager's name, more complex structures are necessary.
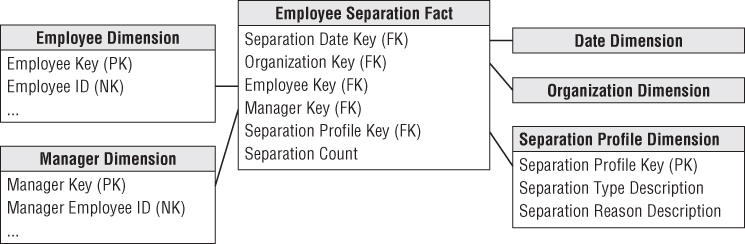
One approach is to include the manager's employee key as another foreign key in the fact table, as shown in Figure 9.5. This manager employee key joins to a role-playing employee dimension where every attribute name refers to “manager” to differentiate the manager's profile from the employee's. This approach associates the employee and their manager whenever a row is inserted into a fact table. BI analyses can easily filter and group by either employee or manager attributes with virtually identical query performance because both dimensions provide symmetrical access to the fact table. The downside of this approach is these dual foreign keys must be embedded in every fact table to support managerial reporting.
Figure 9.5 Dual role-playing employee and manager dimensions.
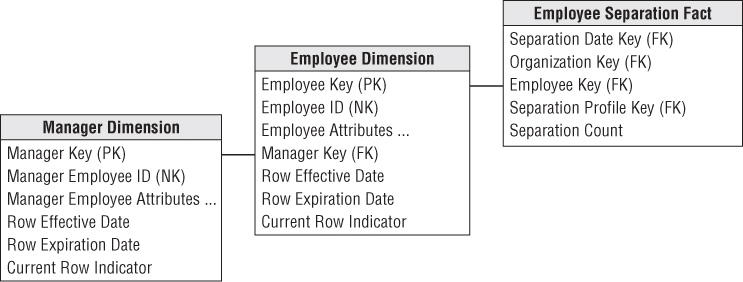
Another option is to include the manager's employee key as an attribute on the employee's dimension row. The manager key would join to an outrigger consisting of a role play on the employee dimension where all the attributes reference “manager” to differentiate them from the employee's characteristics, as shown in Figure 9.6.
Figure 9.6 Manager role-playing dimension as an outrigger.
If the manager's foreign key in the employee dimension is designated as a type 2 attribute, then new employee rows would be generated with each manager change. However, we encourage you to think carefully about the underlying ETL business rules.
Change Tracking on Embedded Manager Key
Let's walk through an example. Abby is Hayden's manager. With the outrigger approach just described, Hayden's employee dimension row would include an attribute linking to Abby's row in the manager role-play employee dimension. If Hayden's manager changes, and assuming the business wants to track these historical changes, then treating the manager foreign key as a type 2 and creating a new row for Hayden to capture his new profile with a new manager would be appropriate.
However, think about the desired outcome if Abby were still Hayden's manager, but her employee profile changes, perhaps caused by something as innocuous as a home address change. If the home address is designated as a type 2 attribute, this move would spawn a new employee dimension row for Abby. If the manager key is also designated as a type 2 attribute, then Abby's new employee key would also spawn a new dimension row for Hayden. Now imagine Abby is the CEO of a large organization. A type 2 change in her profile would ripple through the entire table; you'd end up replicating a new profile row for every employee due to a single type 2 attribute change on the CEO's profile.
Does the business want to capture these manager profile changes? If not, perhaps the manager key on the employee's row should be the manager's durable natural key linked to a role-playing dimension limited to just the current row for each manager's durable natural key in the dimension.
If you designate the manager's key in the employee dimension to be a type 1 attribute, it would always associate an employee with her current manager. Although this simplistic approach obliterates history, it may completely satisfy the business user's needs.
Drilling Up and Down Management Hierarchies
Adding an attribute, either a textual label or a foreign key to a role-playing dimension, to an employee dimension row is appropriate for handling the fixed depth, many-to-one employee-to-manager relationship. However, more complex approaches might be required if the business wants to navigate a deeper recursive hierarchy, such as identifying an employee's entire management chain or drilling down to identify the activity for all employees who directly or indirectly work for a given manager.
If you use an OLAP tool to query employee data, the embedded manager key on every employee dimension row may suffice. Popular OLAP products contain a parent/child hierarchy structure that works smoothly with variable depth recursive hierarchies. In fact, this is one of the strengths of OLAP products.
However, if you want to query the recursive employee/manager relationship in the relational environment, you must use Oracle's nonstandard CONNECT BY syntax or SQL's recursive common table extension (CTE) syntax. Both approaches are virtually unworkable for business users armed with a BI reporting tool.
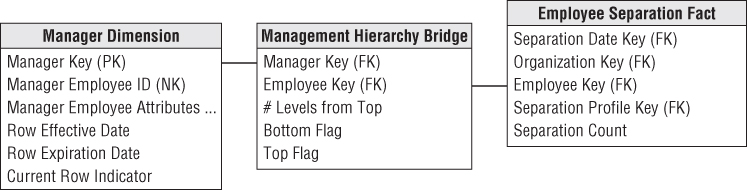
So you're left with the options described in Chapter 7 for dealing with variable depth customer hierarchies. In Figure 9.7, the employee dimension from Figure 9.6 relates to the fact table through a bridge table. The bridge table has one row for each manager and each employee who is directly or indirectly in their management chain, plus an additional row for the manager to himself. The bridge joins shown in Figure 9.7 enable you to drill down within a manager's chain of command.
Figure 9.7 Bridge table to drill down into a manager's reporting structure.
As previously described, there are several disadvantages to this approach. The bridge table is somewhat challenging to build, plus it contains many rows, so query performance can suffer. The BI user experience is complicated for ad hoc queries, although we've seen analysts effectively use it. Finally, if users want to aggregate information up rather than down a management chain, the join paths must be reversed.
Once again, the situation is further complicated if you want to track employee profile changes in conjunction with the bridge table. If the manager and employee reflect employee profiles with type 2 changes, the bridge table will experience rapid growth, especially when senior management profile changes cause new keys to ripple across the organization.
You could use durable natural keys in the bridge table, instead of the employee keys which capture type 2 profile changes. Limiting the relationship to the management hierarchy's current profiles is one thing. However, if the business wants to retain a history of employee/manager rollups, you need to embellish the bridge table with effective and expiration dates that capture the effective timespan for each employee/manager relationship.
The propagation of new rows in this bridge table using durable keys is substantially reduced compared to the Figure 9.7 bridge because new rows are added when reporting relationships change, not when any type 2 employee attribute is modified. A bridge table built on durable keys is easier to manage, but quite challenging to navigate, especially given the need to associate the relevant organizational structures with the event dates in the fact table. Given the complexities, the bridge table should be buried within a canned BI application for all but a small subset of power BI users.
The alternative approaches discussed in Chapter 7 for handling recursive hierarchies, like the pathstring attribute, are also relevant to the management hierarchy conundrum. Unfortunately, there's no silver bullet solution for handling these complex structures in a simple and fast way.
Multivalued Skill Keyword Attributes
Let's assume the IT department wants to supplement the employee dimension with technical skillset proficiency information. You could consider these technical skills, such as programming languages, operating systems, or database platforms, to be keywords describing employees. Each employee is tagged with a number of skill keywords. You want to search the IT employee population by their descriptive skills.
If the technical skills of interest were a finite number, you could include them as individual attributes in the employee dimension. The advantage of using positional dimension attributes, such as a Linux attribute with domain values such as Linux Skills and No Linux Skills, is they're easy to query and deliver fast query performance. This approach works well to a point but falls apart when the number of potential skills expands.
Skill Keyword Bridge
More realistically, each employee will have a variable, unpredictable number of skills. In this case, the skill keyword attribute is a prime candidate to be a multivalued dimension. Skill keywords, by their nature, are open-ended; new skills are added regularly as domain values. We'll show two logically equivalent modeling schemes for handling open-ended sets of skills.
Figure 9.8 shows a multivalued dimension design for handling the skills as an outrigger bridge table to the employee dimension table. As you'll see in Chapter 14: Healthcare, sometimes the multivalued bridge table is joined directly to a fact table.
Figure 9.8 Skills group keyword bridge table.
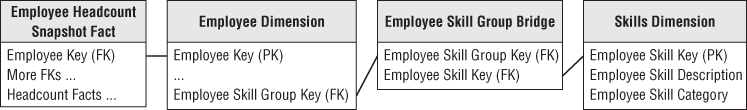
The skills group bridge identifies a given set of skill keywords. IT employees who are proficient in Oracle, Unix, and SQL would be assigned the same skills group key. In the skills group bridge table, there would be three rows for this particular group, one for each of the associated skill keywords (Oracle, Unix, and SQL).
AND/OR Query Dilemma
Assuming you built the schema shown in Figure 9.8, you are still left with a serious query problem. Query requests against the skill keywords fall into two categories. The OR queries (for example, Unix or Linux experience) can be satisfied by a simple OR constraint on the skills description attribute in the skills dimension table. However, AND queries (for example, Unix and Linux experience) are difficult because the AND constraint is a constraint across two rows in the skills dimension. SQL is notoriously poor at handling constraints across rows. The answer is to create SQL code using unions and intersections, probably in a custom interface that hides the complex logic from the business user. The SQL code would look like this:
 (SELECT employee_ID, employee_name
FROM Employee, SkillBridge, Skills
WHERE Employee.SkillGroupKey = SkillBridge.SkillGroupKey AND
  SkillGroup.SkillKey = Skill.SkillKey AND
  Skill.Skill = "UNIX")
UNION / INTERSECTION
 (SELECT employee_ID, employee_name
  FROM Employee, SkillBridge, Skills
  WHERE Employee.SkillGroupKey = SkillBridge.SkillGroupKey AND
    SkillGroup.SkillKey = Skill.SkillKey AND
    Skill.Skill = "LINUX")
Using the UNION lists employees with Unix or Linux experience, whereas using INTERSECTION identifies employees with Unix and Linux experience.
Skill Keyword Text String
You can remove the many-to-many bridge and the need for union/intersection SQL by simplifying the design. One approach would be to add a skills list outrigger to the employee dimension containing one long text string concatenating all the skill keywords for that list key. You would need a special delimiter such as a backslash or vertical bar at the beginning of the skills text string and after each skill in the list. Thus the skills string containing Unix and C++ would look like |Unix|C++|. This outrigger approach presumes a number of employees share a common list of skills. If the lists are not reused frequently, you could collapse the skills list outrigger by simply including the skills list text string as an employee dimension attribute, as shown in Figure 9.9.
Figure 9.9 Delimited skills list string.
Text string searches can be challenging because of the ambiguity caused by searching on uppercase or lowercase. Is it UNIX or Unix or unix? You can resolve this by coercing the skills list to upper case with the UCase function in most SQL environments.
With the design in Figure 9.9, the AND/OR dilemma can be addressed in a single SELECT statement. The OR constraint looks like this:
UCase(skill_list) like '%|UNIX|% OR UCase(skill_list) like '%|LINUX|%'
Meanwhile, the AND constraint has exactly the same structure:
UCase(skill_list) like '%|UNIX|' AND UCase(skill_list) like '%|LINUX|%'
The % symbol is a wild card pattern-matching character defined in SQL that matches zero or more characters. The vertical bar delimiter is used explicitly in the constraints to exactly match the desired keywords and not get erroneous matches.
The keyword list approach shown in Figure 9.9 can work in any relational database because it is based on standard SQL. Although the text string approach facilitates AND/OR searching, it doesn't support queries that count by skill keyword.
Survey Questionnaire Data
HR departments often collect survey data from employees, especially when gathering peer and/or management review data. The department analyzes questionnaire responses to determine the average rating for a reviewed employee and within a department.
To handle questionnaire data in a dimensional model, a fact table with one row for each question on a respondent's survey is typically created, as illustrated in Figure 9.10. Two role-playing employee dimensions in the schema correspond to the responding employee and reviewed employee. The survey dimension has descriptors about the survey instrument. The question dimension provides the question and its categorization; presumably, the same question is asked on multiple surveys. The survey and question dimensions can be useful when searching for specific topics in a broad database of questionnaires. The response dimension contains the responses and perhaps categories of responses, such as favorable or hostile.
Figure 9.10 Survey schema.
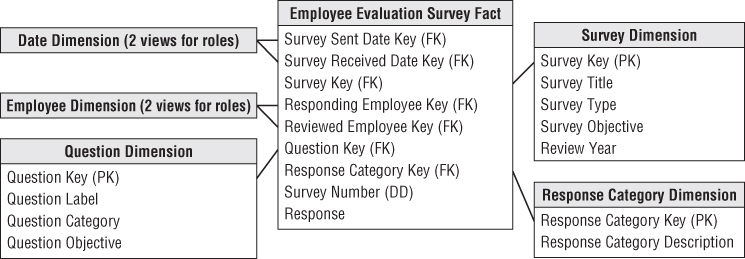
Creating the simple schema in Figure 9.10 supports robust slicing and dicing of survey data. Variations of this schema design would be useful for analyzing all types of survey data, including customer satisfaction and product usage feedback.
Text Comments
Facts are typically thought of as continuously valued numeric measures; dimension attributes, on the other hand, are drawn from a discrete list of domain values. So how do you handle textual comments, such as a manager's remarks on a performance review or freeform feedback on a survey question, which seem to defy clean classification into the fact or dimension category? Although IT professionals may instinctively want to simply exclude them from a dimensional design, business users may demand they're retained to further describe the performance metrics.
After it's been confirmed the business is unwilling to relinquish the text comments, you should determine if the comments can be parsed into well-behaved dimension attributes. Although there are sometimes opportunities to categorize the text, such as a compliment versus complaint, the full text verbiage is typically also required.
Because freeform text takes on so many potential values, designers are sometimes tempted to store the text comment within the fact table. Although cognizant that fact tables are typically limited to foreign keys, degenerate dimensions, and numeric facts, they contend the text comment is just another degenerate dimension. Unfortunately, text comments don't qualify as degenerate dimensions.
Freeform text fields shouldn't be stored in the fact table because they just add bulky clutter to the table. Depending on the database platform, this relatively low value bulk may get dragged along on every operation involving the fact table's much more valuable performance metrics.
Rather than treating the comments as textual metrics, we recommend retaining them outside the fact table. The comments should either be captured in a separate comments dimensions (with a corresponding foreign key in the fact table) or as an attribute on a transaction-grained dimension table. In some situations, identical comments are observed multiple times. At a minimum, this typically occurs with the No Comment comment. If the cardinality of the comments is less than the number of transactions, the text should be captured in a comments dimension. Otherwise, if there's a unique comment for every event, it's treated as a transaction dimension attribute. In either case, regardless of whether the comments are handled in a comment or transaction dimension, the query performance when this sizeable dimension is joined to the fact table will be slow. However, by the time users are viewing comments, they've likely significantly filtered their query as they can realistically read only a limited number of comments. Meanwhile, the more common analyses focusing on the fact table's performance metrics won't be burdened by the extra weight of the textual comments on every fact table query.
Summary
In this chapter, we discussed several concepts in the context of HR data. First, we further elaborated on the advantages of embellishing an employee dimension table. In the world of HR, this single table is used to address a number of questions regarding the status and profile of the employee base at any point in time. We drafted a bus matrix representing multiple processes within the HR arena and highlighted a core headcount snapshot fact table, along with the potential advantages and disadvantages of vendor-designed solutions and data models. The handling of managerial rollups and multivalued dimension attributes was discussed. Finally, we provided a brief overview regarding the handling of survey or questionnaire data, along with text comments.