
Chapter 14
Healthcare
The healthcare industry is undergoing tremendous change as it seeks to both improve patient outcomes, while simultaneously improving operational efficiencies. The challenges are plentiful as organizations attempt to integrate their clinical and administrative information. Healthcare data presents several interesting dimensional design patterns that we'll explore in this chapter.
Chapter 14 discusses the following concepts:
- Example bus matrix snippet for a healthcare organization
- Accumulating snapshot fact table to handle the claims billing and payment pipeline
- Dimension role playing for multiple dates and physicians
- Multivalued dimensions, such as patient diagnoses
- Supertype and subtype handling of healthcare charges
- Treatment of textual comments
- Measurement type dimension for sparse, heterogeneous measurements
- Handling of images with dimensional schemas
- Facility/equipment inventory utilization as transactions and periodic snapshots
Healthcare Case Study and Bus Matrix
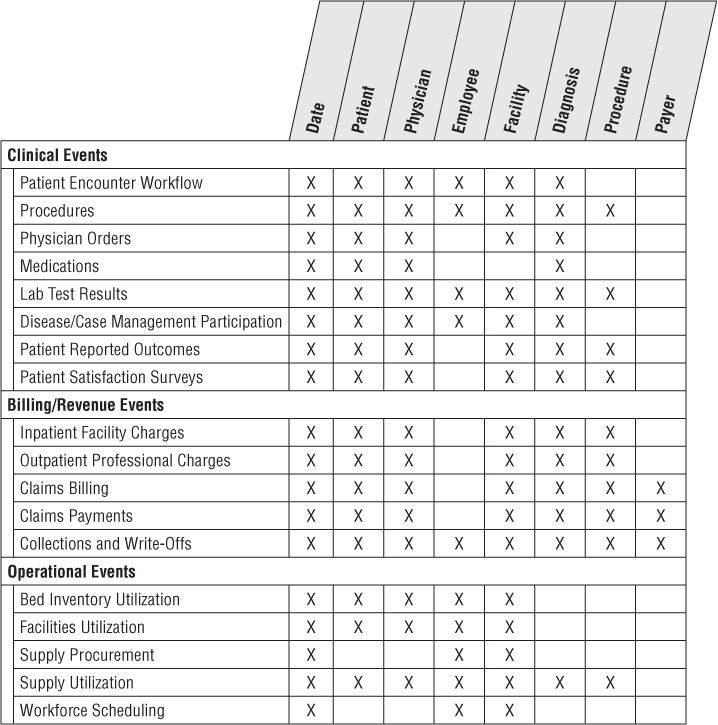
In the face of unprecedented consumer focus and governmental policy regulations, coupled with internal pressures, healthcare organizations need to leverage information more effectively to impact both patient outcomes and operational efficiencies. Healthcare organizations typically wrestle with many disparate systems to collect their clinical, financial, and operational performance metrics. This information needs to be better integrated to deliver more effective patient care, while concurrently managing costs and risks. Healthcare analysts want to better understand which procedures deliver the best outcomes, while identifying opportunities to impact resource utilization, including labor, facilities, and associated equipment and supplies. Large healthcare consortiums with networks of physicians, clinics, hospitals, pharmacies, and laboratories are focused on these requirements, especially as both the federal government and private payers are encouraging providers to assume more responsibility for the quality and cost of their healthcare services. Figure 14.1 illustrates a sample snippet of a healthcare organization's bus matrix.
Figure 14.1 Subset of bus matrix row for a healthcare consortium.
Traditionally, healthcare insurance payers have leveraged claims information to better understand their risk, improve underwriting policies, and detect potential fraudulent activity. Payers have historically been more sophisticated than healthcare provider organizations in leveraging data analytically, perhaps in part because their prime data source, claims, was more reliably captured and structured than providers' data. However, claims data is both a benefit and curse for payers' analytic efforts because it historically hasn't provided the robust, granular clinical picture. Increasingly, healthcare payers are partnering with providers to leverage detailed patient information to support more predictive analysis. In many ways, the needs and objectives of the providers and payers are converging, especially with the push for shared-risk delivery models.
Every patient's episode of care with a healthcare organization generates mounds of information. Patient-centric transactional data falls into two prime categories: administrative and clinical. The claims billing data provides detail on a patient bill from a physician's office, clinic, hospital, or laboratory. The clinical medical record, on the other hand, is more comprehensive and includes not only the services resulting in charges, but also the laboratory test results, prescriptions, physician's notes or orders, and sometimes outcomes.
The issues of conforming common dimensions remain exactly the same for healthcare as in other industries. Obviously, the most important conformed dimension is the patient. In Chapter 8: Customer Relationship Management, we described the need for a 360-degree view of customers. It's easy to argue that a 360-degree view of patients is even more critical given the stakes; adoption of patient electronic medical record (EMR) and electronic health record (EHR) systems clearly focus on this objective.
Other dimensions that must be conformed include:
- Date
- Responsible party
- Employer
- Health plan
- Payer (primary and secondary)
- Physician
- Procedure
- Equipment
- Lab test
- Medication
- Diagnosis
- Facility (office, clinic, outpatient facility, and hospital)
In the healthcare arena, some of these dimensions are hard to conform, whereas others are easier than they look at first glance. The patient dimension has historically been challenging, at least in the United States, because of the lack of a reliable national identity number and/or consistent patient identifier across facilities and physicians. To further complicate matters, the Health Insurance Portability and Accountability Act (HIPAA) includes strict privacy and security requirements to protect the confidential nature of patient information. Operational process improvements, like electronic medical records, are ensuring more consistent master patient identification.
The diagnosis and treatment dimensions are considerably more structured and predictable than you might expect because the insurance industry and government have mandated their content. For example, diagnosis and disease classifications follow the International Classification of Diseases (ICD) standard for consistent reporting. Similarly, the Healthcare Common Procedure Coding System (HCPCS) is based on the American Medical Association's Current Procedural Terminology (CPT) to describe medical, surgical, and diagnostic services, along with supplies and devices. Dentists use the Current Dental Terminology (CDT) code set, which is updated and distributed by the American Dental Association.
Finally, beyond integrated patient-centric clinical and financial information, healthcare organizations also want to analyze operational information regarding the utilization of their workforce, facilities, and supplies. Much of the discussion from earlier chapters about human resources, inventory management, and procurement processes is also applicable to healthcare organizations.
Claims Billing and Payments
Imagine you work in the healthcare consortium's billing organization. You receive the primary charges from the physicians and facilities, prepare bills for the responsible payers, and track the progress of the claims payments received.
The dimensional model for the claims billing process must address a number of business objectives. You want to analyze the billed dollar amounts by every available dimension, including patient, physician, facility, diagnosis, procedure, and date. You want to see how these claims have been paid and what percentage of the claims have not been collected. You want to see how long it takes to get paid, and the current status of all unpaid claims.
As we discussed in Chapter 4: Inventory, whenever a source business process is considered for inclusion in the DW/BI system, there are three essential grain choices. Remember the fact table's granularity determines what constitutes a fact table row. In other words, what is the measurement event being recorded?
The transaction grain is the most fundamental. In the healthcare billing example, the transaction grain would include every billing transaction from the physicians and facilities, as well as every claim payment transaction received. We'll talk more about these fact tables in a moment.
The periodic snapshot is the grain of choice for long-running time series, such as bank accounts and insurance policies. However, the periodic snapshot doesn't do a good job of capturing the behavior of relatively short-lived processes, such as orders or medical claims billing.
The accumulating snapshot grain is chosen to analyze the claims billing and payment workflow. A single fact table row represents a single line on a medical claim. Furthermore, the row represents the accumulated history of the line item from the moment of creation to the current state. When anything about the line changes, the row is revisited and modified appropriately. From the point of view of the billing organization, let's assume the standard scenario of a claim includes:
- Treatment date
- Primary insurance billing date
- Secondary insurance billing date
- Responsible party billing date
- Last primary insurance payment date
- Last secondary insurance payment date
- Last responsible party payment date
- Zero balance date
These dates describe the normal claim workflow. An accumulating snapshot does not attempt to fully describe unusual situations. Business users undoubtedly need to see all the details of messy claim payment scenarios because multiple payments are sometimes received for a single line, or conversely, a single payment sometimes applies to multiple claims. Companion transaction schemas inevitably will be needed. In the meantime, the purpose of the accumulating snapshot grain is to place every claim into a standard framework so that the analytic objectives described earlier can be satisfied easily.
With a clear understanding that an individual fact table row represents the accumulated history of a line item on a claim bill, you can identify the dimensions by carefully listing everything known to be true in the context of this row. In this hypothetical scenario, you know the patient, responsible party, physician, physician organization, procedure, facility, diagnosis, primary insurance organization, secondary insurance organization, and master patient bill ID number, as shown in Figure 14.2.
Figure 14.2 Accumulating snapshot fact table for medical claim billing and payment workflow.
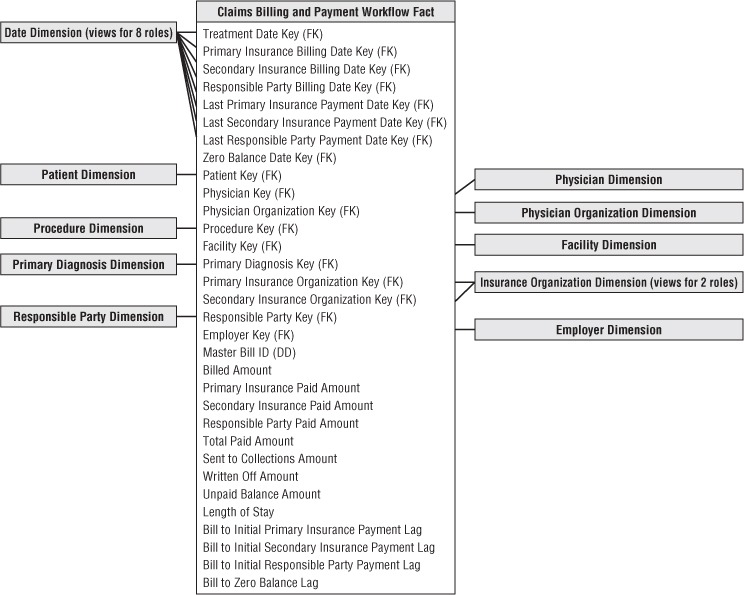
The interesting facts accumulated over the claim line's history include the billed amount, primary insurance paid amount, secondary insurance paid amount, responsible party paid amount, total paid amount (calculated), amount sent to collections, amount written off, amount remaining to be paid (calculated), length of stay, number of days from billing to initial primary insurance, secondary insurance, and responsible party payments, and finally, number of days to zero balance.
A row is initially created in this fact table when the charge transactions are received from the physicians or facilities and the initial bills are generated. On a given bill, perhaps the primary insurance company is billed, but the secondary insurance and responsible party are not billed, pending a response from the primary insurance company. For a period of time after the row is first entered into the fact table, the last seven dates are not applicable. Because the surrogate date keys in the fact table must not be null, they will point to a date dimension row reserved for a To Be Determined date.
In the weeks after creation of the row, some payments are received. Bills are then sent to the secondary insurance company and responsible party. Each time these events take place, the same fact table row is revisited, and the appropriate keys and facts are destructively updated. This destructive updating poses some challenges for the database administrator. If most of the accumulating rows stabilize and stop changing within a given timeframe, a physical reorganization of the database at that time can recover disk storage and improve performance. If the fact table is partitioned on the treatment date key, the physical clustering or partitioning probably will be well preserved throughout these changes because the treatment date is not revisited and changed.
Date Dimension Role Playing
Accumulating snapshot fact tables always involve multiple date stamps, like the eight foreign keys pointing to the date dimension in Figure 14.2. The eight date foreign keys should not join to a single instance of the date dimension table. Instead, create eight views on the single underlying date dimension table, and join the fact table separately to these eight views, as if they were eight independent date dimension tables. The eight view definitions should cosmetically relabel the column names to be distinguishable, so BI tools accessing the views present understandable column names to the business users.
Although the role-playing behavior of the date dimension is a common characteristic of accumulating snapshot fact tables, other dimensions in Figure 14.2 play roles in similar ways, such as the payer dimension. In the section “Supertypes and Subtypes for Charges,” the physician dimension will play multiple roles depending on whether the physician is the referring physician, attending physician, or working in a consulting or assisting capacity.
Multivalued Diagnoses
Normally the dimensions surrounding a fact table take on a single value in the context of the fact event. However, there are situations where multivaluedness is natural and unavoidable. The diagnosis dimension in healthcare fact tables is a good example. At the moment of a procedure or lab test, the patient has one or more diagnoses. Electronic medical record applications facilitate the physician's selection of multiple diagnoses well beyond the historical practice of providing the minimal coding needed for reimbursement; the result is a richer, more complete picture of the severity of the patient's medical condition. There is strong analytic incentive to retain the multivalued diagnoses, along with the other financial performance data, especially as organizations do more comparative utilization and cost benchmarking.
If there were always a maximum of three diagnoses, for instance, you might be tempted to create three diagnosis foreign keys in the fact table with corresponding dimensions, almost as if they were roles. However, diagnoses don't behave like independent roles. And unfortunately, there are often more than three diagnoses, especially for hospitalized elderly patients who may present 20 simultaneous diagnoses! Diagnoses don't fit into well-defined roles other than potentially the primary admitting and discharging diagnoses. Finally, a design with multiple diagnosis foreign keys would make for very inefficient BI applications because the query doesn't know which dimensional slot to constrain for a particular diagnosis.
The design shown in Figure 14.3 handles the open-ended nature of multiple diagnoses. The diagnosis foreign key in the fact table is replaced with a diagnosis group key. This diagnosis group key is connected by a many-to-many join to a diagnosis group bridge table, which contains a separate row for each individual diagnosis in a particular group.
Figure 14.3 Bridge table to handle multivalued diagnoses.
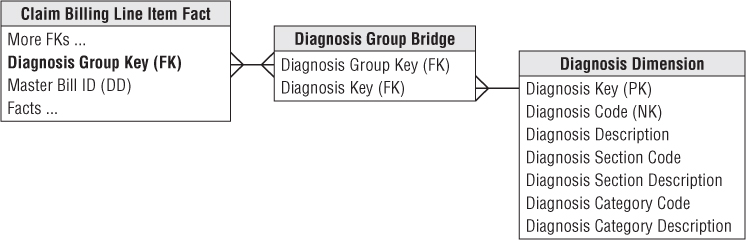
If a patient has three diagnoses, he is assigned a diagnosis group with three corresponding rows in the bridge table. In Chapter 10: Financial Services, we described the use of a weighting factor on each bridge table row to allocate the fact table's metrics accordingly. However, in the case of multiple patient diagnoses, it's virtually impossible to weight their impact on a patient's treatment or bill, beyond the potential determination of a primary diagnosis. Without a realistic way of assigning weighting factors, the analysis of diagnosis codes must largely focus on impact questions like “What is the total billed amount for procedures involving the diagnosis of congestive heart failure?” Most healthcare analysts understand impact analysis may result in over counting as the same metrics are associated with multiple diagnoses.
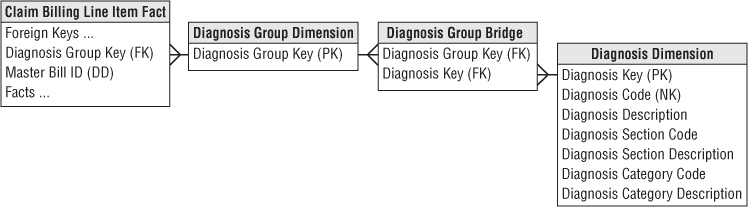
If the many-to-many join in Figure 14.3 causes problems for a modeling tool that insists on proper foreign-key-to-primary-key relationships, the equivalent design of Figure 14.4 can be used. In this case an extra table whose primary key is a diagnosis group is inserted between the fact and bridge tables. There is likely no new information in this extra table, unless there were labels for a cluster of diagnoses, such as the Kimball Syndrome, but now both the fact table and bridge table have conventional many-to-one joins in all directions.
Figure 14.4 Diagnosis group dimension to create a primary key relationship.
If a unique diagnosis group is created for every patient encounter, the number of rows could become astronomical and many of the groups would be identical. Probably a better approach is to have a portfolio of diagnosis groups that are repeatedly used. Each set of diagnoses would be looked up in the master diagnosis group table during the ETL. If the existing group is found, it is used; if not found, a new diagnosis group is created. Chapter 19: ETL Subsystems and Techniques provides guidance for creating and administering bridge tables.
In an inpatient hospital stay scenario, the diagnosis group may be unique to each patient if it evolves over time during the patient's stay. In this case you would supplement the bridge table with two date stamps to capture begin and end dates. Although the twin date stamps complicate updates to the diagnosis group bridge table, they are useful for change tracking, as described more fully in Chapter 7: Accounting.
Supertypes and Subtypes for Charges
We've described a design for billed healthcare treatments to cover both inpatient and outpatient claims. In reality, healthcare charges resemble the supertype and subtype pattern described in Chapter 10. Facility charges for inpatient hospital stays differ from professional charges for outpatient treatments in clinics and doctor offices.
If you were focused exclusively on hospital stays, it would be reasonable to tweak the Figure 14.2 dimensional structure to incorporate more hospital-specific information. Figure 14.5 shows a revised set of dimensions specialized for hospital stays, with the new dimensions bolded.
Figure 14.5 Accumulating snapshot for hospital stay charges.

Referring to Figure 14.5, you can see two roles for the physician: admitting physician and attending physician. The figure shows physician organizations for both roles because physicians may represent different organizations in a hospital setting. With more complex surgical events, such as a heart transplant operation, whole teams of specialists and assistants are assembled. In this case, you could include a key in the fact table for the primary responsible physician; the other physicians and medical staff would be linked to the fact row via a group key to a multivalued bridge table.
You also have two multivalued diagnosis dimensions on each fact table row. The admitting diagnosis group is determined at the beginning of the hospital stay and should be the same for every treatment row that is part of the same hospital stay. The discharge diagnosis group is not known until the patient is discharged.
Electronic Medical Records
Many healthcare organizations are moving from paper-based processes to electronic medical records. In the United States, federally mandated quality goals to support improved population health management may be achievable only with their adoption. Healthcare providers are aggressively implementing electronic health record systems; the movement is significantly impacting healthcare DW /BI initiatives.
Electronic medical records can present challenges for data warehouse environments because of their extreme variability and potentially extreme volumes. Patients' medical record data comes in many different forms, ranging from numeric data to freeform text comments entered by a healthcare professional to images and photographs. We'll further discuss unstructured data in Chapter 21: Big Data Analytics; electronic medical and/or health records may become a classic use case for big data. One thing is certain. The amount and variability of electronic data in the healthcare industry will continue to grow.
Measure Type Dimension for Sparse Facts
As designers, it is tempting to strive for a more standardized framework that could be extended to handle data variability. For example, you could potentially handle the variability of lab test results with a measurement type dimension describing what the fact row means, or in other words, what the generic fact represents. The unit of measure for a given numeric entry is found in the associated measurement type dimension row, along with any additivity restrictions, as shown in Figure 14.6.
Figure 14.6 Lab test observations with measurement type dimension.
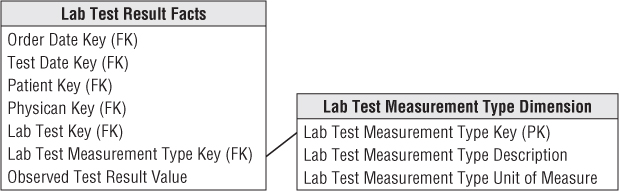
This approach is superbly flexible; you can add new measurement types simply by adding new rows in the measurement type dimension, not by altering the structure of the fact table. This approach also eliminates the nulls in the classic positional fact table design because a row exists only if the measurement exists. However, there are trade-offs. Using a measurement type dimension may generate lots of new fact table rows because the grain is “one row per measurement per event” rather than the more typical “one row per event.” If a lab test results in 10 numeric measurements, there are now 10 rows in the fact table rather than a single row in the classic design. For extremely sparse situations, such as clinical laboratory or manufacturing test environments, this is a reasonable compromise. However, as the density of the facts grows, you end up spewing out too many fact rows. At this point you no longer have sparse facts and should return to the classic fact table design with fixed columns.
Moreover, this measurement type approach may complicate BI data access applications. In the relational star schema, combining two numbers that were captured as part of a single event is more difficult with this approach because now you must fetch two rows from the fact table. SQL likes to perform arithmetic functions within a row, not across rows. In addition, you must be careful not to mix incompatible amounts in a calculation because all the numeric measures reside in a single amount column. It's worth noting that multidimensional OLAP cubes are more tolerant of performing calculations across measurement types.
Freeform Text Comments
Freeform text comments, such as clinical notes, are sometimes associated with fact table events. Although text comments are not very analytically potent unless they're parsed into well-behaved dimension attributes, business users are often unwilling to part with them given the embedded nuggets of information.
Textual comments should not be stored in a fact table directly because they waste space and rarely participate in queries. Some designers think it's permissible to store textual fields in the fact table, as long as they're referred to as degenerate dimensions. Degenerate dimensions are most typically used for operational transaction control numbers and identifiers; it's not an acceptable approach or pattern for contending with bulky text fields. Storing freeform comments in the fact table adds clutter that may negatively impact the performance of analysts' more typical quantitative queries.
The unbounded text comments should either be stored in a separate comments dimension or treated as attributes in a transaction event dimension. A key consideration when evaluating these two approaches is the text field's cardinality. If there's nearly a unique comment for every fact table event, storing the textual field in a transaction dimension makes the most sense. However, in many cases, No Comment is associated with numerous fact rows. Because the number of unique text comments in this scenario is much smaller than the number of unique transactions, it would make more sense to store the textual data in a comments dimension with an associated foreign key in the fact table. In either case, queries involving both the text comments and fact metrics will perform relatively poorly given the need to resolve joins between two voluminous tables. Often business users want to drill into text comments for further investigation after highly selective fact table query filters have been applied.
Images
Sometimes the data captured in a patient's electronic medical record is an image, in addition to either quantitative numbers or qualitative notes. There are trade-offs between capturing a JPEG filename in the fact table to refer to an associated image versus embedding the image as a blob directly in the database. The advantage of using a JPEG filename is that other image creation, viewing, and editing programs can freely access the image. The disadvantage is that a separate database of graphic files must be maintained in synchrony with the fact table.
Facility/Equipment Inventory Utilization
In addition to financial and clinical data, healthcare organizations are also keenly interested in more operationally oriented metrics, such as utilization and availability of their assets, whether referring to patient beds or surgical operating theatres. In Chapter 4, we discussed product inventory data as transaction events as well as periodic snapshots. Facility or equipment inventories in a healthcare organization can be handled similarly.
For example, you can envision a bed utilization periodic snapshot with every bed's status at regularly recurring points in time, perhaps at midnight, the start of every shift, or even more frequently throughout the day. In addition to a snapshot date and potentially time-of-day, this factless fact table would include foreign keys to identify the patient, attending physician, and perhaps an assigned nurse on duty.
Conversely, you can imagine treating the bed inventory data as a transaction fact table with one row per movement into and out of a hospital bed. This may be a simplistic transaction fact table with transaction date and time dimension foreign keys, along with dimensions to describe the type of movement, such as filled or vacated. In the case of operating room utilization and availability, you can envision a lengthier list of statuses, such as pre-operation, post-operation, or downtime, along with time durations.
If the inventory changes are not terribly volatile, such as the beds in a rehabilitation or eldercare inpatient environment, you should consider a timespan fact table, as discussed in Chapter 8, with row effective and expiration dates and times to represent the various states of a bed over a period of time.
Dealing with Retroactive Changes
As DW/BI practitioners, we have well-developed techniques for accurately capturing the historical flow of data from our enterprise's source applications. Numeric measurements go into fact tables, which are surrounded with contemporary descriptions of what you know is true at the time of the measurements, packaged as dimension tables. The descriptions of patient, physician, facility, and payer evolve as slowly changing dimensions whenever these entities change their descriptions.
However, in the healthcare industry, especially with legacy operational systems, you often need to contend with late arriving data that should have been loaded into the data warehouse weeks or months ago. For example, you might receive data regarding patient procedures that occurred several weeks ago, or updates to patient profiles that were back-dated as effective several months ago. The more delayed the incoming records are, the more challenging the DW/BI system's ETL processing becomes. We'll discuss these late arriving fact and dimension scenarios in Chapter 19. Unfortunately, these patterns are common in healthcare DW/BI environments; in fact, they may be the dominant modes of processing rather than specialized techniques for outlier cases. Eventually, more effective source data capture systems should reduce the frequency of these late arriving data anomalies.
Summary
Healthcare provides a wealth of dimensional design examples. In this chapter, the enterprise data warehouse bus matrix illustrated the critical linkages between a healthcare organization's administrative and clinical data. We used an accumulating snapshot grain fact table with role-playing date dimensions for the healthcare claim billing and payment pipeline. We also saw role playing used for the physician and payer dimensions in other fact tables of this chapter.
Healthcare schemas are littered with multivalued dimensions, especially the diagnosis dimension. Complex surgical events might also use multivalued bridge tables to represent the teams of involved physicians and other staff members. The bridge tables used with healthcare data seldom contain weighting factors, as discussed in earlier chapters, because it is extremely difficult to establish weighting business rules, beyond the designation of a “primary” relationship.
We discussed medical records and test results, suggesting a measurement type dimension to organize sparse, heterogeneous measurements into a single, uniform framework. We also discussed the handling of text comments and linked images. Transaction and periodic snapshot fact tables were used to represent facility or equipment inventory utilization and availability. In closing, we touched upon retroactive fact and dimension changes that are often all too common with healthcare performance data.