
Chapter 1
Data Warehousing, Business Intelligence, and Dimensional Modeling Primer
This first chapter lays the groundwork for the following chapters. We begin by considering data warehousing and business intelligence (DW/BI) systems from a high-level perspective. You may be disappointed to learn that we don't start with technology and tools—first and foremost, the DW/BI system must consider the needs of the business. With the business needs firmly in hand, we work backwards through the logical and then physical designs, along with decisions about technology and tools.
We drive stakes in the ground regarding the goals of data warehousing and business intelligence in this chapter, while observing the uncanny similarities between the responsibilities of a DW/BI manager and those of a publisher.
With this big picture perspective, we explore dimensional modeling core concepts and establish fundamental vocabulary. From there, this chapter discusses the major components of the Kimball DW/BI architecture, along with a comparison of alternative architectural approaches; fortunately, there's a role for dimensional modeling regardless of your architectural persuasion. Finally, we review common dimensional modeling myths. By the end of this chapter, you'll have an appreciation for the need to be one-half DBA (database administrator) and one-half MBA (business analyst) as you tackle your DW/BI project.
Chapter 1 discusses the following concepts:
- Business-driven goals of data warehousing and business intelligence
- Publishing metaphor for DW/BI systems
- Dimensional modeling core concepts and vocabulary, including fact and dimension tables
- Kimball DW/BI architecture's components and tenets
- Comparison of alternative DW/BI architectures, and the role of dimensional modeling within each
- Misunderstandings about dimensional modeling
Different Worlds of Data Capture and Data Analysis
One of the most important assets of any organization is its information. This asset is almost always used for two purposes: operational record keeping and analytical decision making. Simply speaking, the operational systems are where you put the data in, and the DW/BI system is where you get the data out.
Users of an operational system turn the wheels of the organization. They take orders, sign up new customers, monitor the status of operational activities, and log complaints. The operational systems are optimized to process transactions quickly. These systems almost always deal with one transaction record at a time. They predictably perform the same operational tasks over and over, executing the organization's business processes. Given this execution focus, operational systems typically do not maintain history, but rather update data to reflect the most current state.
Users of a DW/BI system, on the other hand, watch the wheels of the organization turn to evaluate performance. They count the new orders and compare them with last week's orders, and ask why the new customers signed up, and what the customers complained about. They worry about whether operational processes are working correctly. Although they need detailed data to support their constantly changing questions, DW/BI users almost never deal with one transaction at a time. These systems are optimized for high-performance queries as users' questions often require that hundreds or hundreds of thousands of transactions be searched and compressed into an answer set. To further complicate matters, users of a DW/BI system typically demand that historical context be preserved to accurately evaluate the organization's performance over time.
In the first edition of The Data Warehouse Toolkit (Wiley, 1996), Ralph Kimball devoted an entire chapter to describe the dichotomy between the worlds of operational processing and data warehousing. At this time, it is widely recognized that the DW/BI system has profoundly different needs, clients, structures, and rhythms than the operational systems of record. Unfortunately, we still encounter supposed DW/BI systems that are mere copies of the operational systems of record stored on a separate hardware platform. Although these environments may address the need to isolate the operational and analytical environments for performance reasons, they do nothing to address the other inherent differences between the two types of systems. Business users are underwhelmed by the usability and performance provided by these pseudo data warehouses; these imposters do a disservice to DW/BI because they don't acknowledge their users have drastically different needs than operational system users.
Goals of Data Warehousing and Business Intelligence
Before we delve into the details of dimensional modeling, it is helpful to focus on the fundamental goals of data warehousing and business intelligence. The goals can be readily developed by walking through the halls of any organization and listening to business management. These recurring themes have existed for more than three decades:
- “We collect tons of data, but we can't access it.”
- “We need to slice and dice the data every which way.”
- “Business people need to get at the data easily.”
- “Just show me what is important.”
- “We spend entire meetings arguing about who has the right numbers rather than making decisions.”
- “We want people to use information to support more fact-based decision making.”
Based on our experience, these concerns are still so universal that they drive the bedrock requirements for the DW/BI system. Now turn these business management quotations into requirements.
- The DW/BI system must make information easily accessible. The contents of the DW/BI system must be understandable. The data must be intuitive and obvious to the business user, not merely the developer. The data's structures and labels should mimic the business users' thought processes and vocabulary. Business users want to separate and combine analytic data in endless combinations. The business intelligence tools and applications that access the data must be simple and easy to use. They also must return query results to the user with minimal wait times. We can summarize this requirement by simply saying simple and fast.
- The DW/BI system must present information consistently. The data in the DW/BI system must be credible. Data must be carefully assembled from a variety of sources, cleansed, quality assured, and released only when it is fit for user consumption. Consistency also implies common labels and definitions for the DW/BI system's contents are used across data sources. If two performance measures have the same name, they must mean the same thing. Conversely, if two measures don't mean the same thing, they should be labeled differently.
- The DW/BI system must adapt to change. User needs, business conditions, data, and technology are all subject to change. The DW/BI system must be designed to handle this inevitable change gracefully so that it doesn't invalidate existing data or applications. Existing data and applications should not be changed or disrupted when the business community asks new questions or new data is added to the warehouse. Finally, if descriptive data in the DW/BI system must be modified, you must appropriately account for the changes and make these changes transparent to the users.
- The DW/BI system must present information in a timely way. As the DW/BI system is used more intensively for operational decisions, raw data may need to be converted into actionable information within hours, minutes, or even seconds. The DW/BI team and business users need to have realistic expectations for what it means to deliver data when there is little time to clean or validate it.
- The DW/BI system must be a secure bastion that protects the information assets. An organization's informational crown jewels are stored in the data warehouse. At a minimum, the warehouse likely contains information about what you're selling to whom at what price—potentially harmful details in the hands of the wrong people. The DW/BI system must effectively control access to the organization's confidential information.
- The DW/BI system must serve as the authoritative and trustworthy foundation for improved decision making. The data warehouse must have the right data to support decision making. The most important outputs from a DW/BI system are the decisions that are made based on the analytic evidence presented; these decisions deliver the business impact and value attributable to the DW/BI system. The original label that predates DW/BI is still the best description of what you are designing: a decision support system.
- The business community must accept the DW/BI system to deem it successful. It doesn't matter that you built an elegant solution using best-of-breed products and platforms. If the business community does not embrace the DW/BI environment and actively use it, you have failed the acceptance test. Unlike an operational system implementation where business users have no choice but to use the new system, DW/BI usage is sometimes optional. Business users will embrace the DW/BI system if it is the “simple and fast” source for actionable information.
Although each requirement on this list is important, the final two are the most critical, and unfortunately, often the most overlooked. Successful data warehousing and business intelligence demands more than being a stellar architect, technician, modeler, or database administrator. With a DW/BI initiative, you have one foot in your information technology (IT) comfort zone while your other foot is on the unfamiliar turf of business users. You must straddle the two, modifying some tried-and-true skills to adapt to the unique demands of DW/BI. Clearly, you need to bring a spectrum of skills to the party to behave like you're a hybrid DBA/MBA.
Publishing Metaphor for DW/BI Managers
With the goals of DW/BI as a backdrop, let's compare the responsibilities of DW/BI managers with those of a publishing editor-in-chief. As the editor of a high-quality magazine, you would have broad latitude to manage the magazine's content, style, and delivery. Anyone with this job title would likely tackle the following activities:
- Understand the readers:
- Identify their demographic characteristics.
- Find out what readers want in this kind of magazine.
- Identify the “best” readers who will renew their subscriptions and buy products from the magazine's advertisers.
- Find potential new readers and make them aware of the magazine.
- Ensure the magazine appeals to the readers:
- Choose interesting and compelling magazine content.
- Make layout and rendering decisions that maximize the readers' pleasure.
- Uphold high-quality writing and editing standards while adopting a consistent presentation style.
- Continuously monitor the accuracy of the articles and advertisers' claims.
- Adapt to changing reader profiles and the availability of new input from a network of writers and contributors.
- Sustain the publication:
- Attract advertisers and run the magazine profitably.
- Publish the magazine on a regular basis.
- Maintain the readers' trust.
- Keep the business owners happy.
You also can identify items that should be non-goals for the magazine's editor-in-chief, such as building the magazine around a particular printing technology or exclusively putting management's energy into operational efficiencies, such as imposing a technical writing style that readers don't easily understand, or creating an intricate and crowded layout that is difficult to read.
By building the publishing business on a foundation of serving the readers effectively, the magazine is likely to be successful. Conversely, go through the list and imagine what happens if you omit any single item; ultimately, the magazine would have serious problems.
There are strong parallels that can be drawn between being a conventional publisher and being a DW/BI manager. Driven by the needs of the business, DW/BI managers must publish data that has been collected from a variety of sources and edited for quality and consistency. The main responsibility is to serve the readers, otherwise known as business users. The publishing metaphor underscores the need to focus outward on your customers rather than merely focusing inward on products and processes. Although you use technology to deliver the DW/BI system, the technology is at best a means to an end. As such, the technology and techniques used to build the system should not appear directly in your top job responsibilities.
Now recast the magazine publisher's responsibilities as DW/BI manager responsibilities:
- Understand the business users:
- Understand their job responsibilities, goals, and objectives.
- Determine the decisions that the business users want to make with the help of the DW/BI system.
- Identify the “best” users who make effective, high-impact decisions.
- Find potential new users and make them aware of the DW/BI system's capabilities.
- Deliver high-quality, relevant, and accessible information and analytics to the business users:
- Choose the most robust, actionable data to present in the DW/BI system, carefully selected from the vast universe of possible data sources in your organization.
- Make the user interfaces and applications simple and template-driven, explicitly matched to the users' cognitive processing profiles.
- Make sure the data is accurate and can be trusted, labeling it consistently across the enterprise.
- Continuously monitor the accuracy of the data and analyses.
- Adapt to changing user profiles, requirements, and business priorities, along with the availability of new data sources.
- Sustain the DW/BI environment:
- Take a portion of the credit for the business decisions made using the DW/BI system, and use these successes to justify staffing and ongoing expenditures.
- Update the DW/BI system on a regular basis.
- Maintain the business users' trust.
- Keep the business users, executive sponsors, and IT management happy.
If you do a good job with all these responsibilities, you will be a great DW/BI manager! Conversely, go through the list and imagine what happens if you omit any single item. Ultimately, the environment would have serious problems. Now contrast this view of a DW/BI manager's job with your own job description. Chances are the preceding list is more oriented toward user and business issues and may not even sound like a job in IT. In our opinion, this is what makes data warehousing and business intelligence interesting.
Dimensional Modeling Introduction
Now that you understand the DW/BI system's goals, let's consider the basics of dimensional modeling. Dimensional modeling is widely accepted as the preferred technique for presenting analytic data because it addresses two simultaneous requirements:
- Deliver data that's understandable to the business users.
- Deliver fast query performance.
Dimensional modeling is a longstanding technique for making databases simple. In case after case, for more than five decades, IT organizations, consultants, and business users have naturally gravitated to a simple dimensional structure to match the fundamental human need for simplicity. Simplicity is critical because it ensures that users can easily understand the data, as well as allows software to navigate and deliver results quickly and efficiently.
Imagine an executive who describes her business as, “We sell products in various markets and measure our performance over time.” Dimensional designers listen carefully to the emphasis on product, market, and time. Most people find it intuitive to think of such a business as a cube of data, with the edges labeled product, market, and time. Imagine slicing and dicing along each of these dimensions. Points inside the cube are where the measurements, such as sales volume or profit, for that combination of product, market, and time are stored. The ability to visualize something as abstract as a set of data in a concrete and tangible way is the secret of understandability. If this perspective seems too simple, good! A data model that starts simple has a chance of remaining simple at the end of the design. A model that starts complicated surely will be overly complicated at the end, resulting in slow query performance and business user rejection. Albert Einstein captured the basic philosophy driving dimensional design when he said, “Make everything as simple as possible, but not simpler.”
Although dimensional models are often instantiated in relational database management systems, they are quite different from third normal form (3NF) models which seek to remove data redundancies. Normalized 3NF structures divide data into many discrete entities, each of which becomes a relational table. A database of sales orders might start with a record for each order line but turn into a complex spider web diagram as a 3NF model, perhaps consisting of hundreds of normalized tables.
The industry sometimes refers to 3NF models as entity-relationship (ER) models. Entity-relationship diagrams (ER diagrams or ERDs) are drawings that communicate the relationships between tables. Both 3NF and dimensional models can be represented in ERDs because both consist of joined relational tables; the key difference between 3NF and dimensional models is the degree of normalization. Because both model types can be presented as ERDs, we refrain from referring to 3NF models as ER models; instead, we call them normalized models to minimize confusion.
Normalized 3NF structures are immensely useful in operational processing because an update or insert transaction touches the database in only one place. Normalized models, however, are too complicated for BI queries. Users can't understand, navigate, or remember normalized models that resemble a map of the Los Angeles freeway system. Likewise, most relational database management systems can't efficiently query a normalized model; the complexity of users' unpredictable queries overwhelms the database optimizers, resulting in disastrous query performance. The use of normalized modeling in the DW/BI presentation area defeats the intuitive and high-performance retrieval of data. Fortunately, dimensional modeling addresses the problem of overly complex schemas in the presentation area.
Star Schemas Versus OLAP Cubes
Dimensional models implemented in relational database management systems are referred to as star schemas because of their resemblance to a star-like structure. Dimensional models implemented in multidimensional database environments are referred to as online analytical processing (OLAP) cubes, as illustrated in Figure 1.1.
Figure 1.1 Star schema versus OLAP cube.
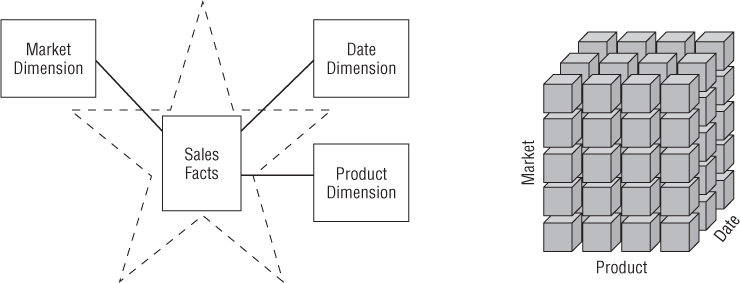
If your DW/BI environment includes either star schemas or OLAP cubes, it leverages dimensional concepts. Both stars and cubes have a common logical design with recognizable dimensions; however, the physical implementation differs.
When data is loaded into an OLAP cube, it is stored and indexed using formats and techniques that are designed for dimensional data. Performance aggregations or precalculated summary tables are often created and managed by the OLAP cube engine. Consequently, cubes deliver superior query performance because of the precalculations, indexing strategies, and other optimizations. Business users can drill down or up by adding or removing attributes from their analyses with excellent performance without issuing new queries. OLAP cubes also provide more analytically robust functions that exceed those available with SQL. The downside is that you pay a load performance price for these capabilities, especially with large data sets.
Fortunately, most of the recommendations in this book pertain regardless of the relational versus multidimensional database platform. Although the capabilities of OLAP technology are continuously improving, we generally recommend that detailed, atomic information be loaded into a star schema; optional OLAP cubes are then populated from the star schema. For this reason, most dimensional modeling techniques in this book are couched in terms of a relational star schema.
OLAP Deployment Considerations
Here are some things to keep in mind if you deploy data into OLAP cubes:
- A star schema hosted in a relational database is a good physical foundation for building an OLAP cube, and is generally regarded as a more stable basis for backup and recovery.
- OLAP cubes have traditionally been noted for extreme performance advantages over RDBMSs, but that distinction has become less important with advances in computer hardware, such as appliances and in-memory databases, and RDBMS software, such as columnar databases.
- OLAP cube data structures are more variable across different vendors than relational DBMSs, thus the final deployment details often depend on which OLAP vendor is chosen. It is typically more difficult to port BI applications between different OLAP tools than to port BI applications across different relational databases.
- OLAP cubes typically offer more sophisticated security options than RDBMSs, such as limiting access to detailed data but providing more open access to summary data.
- OLAP cubes offer significantly richer analysis capabilities than RDBMSs, which are saddled by the constraints of SQL. This may be the main justification for using an OLAP product.
- OLAP cubes gracefully support slowly changing dimension type 2 changes (which are discussed in Chapter 5: Procurement), but cubes often need to be reprocessed partially or totally whenever data is overwritten using alternative slowly changing dimension techniques.
- OLAP cubes gracefully support transaction and periodic snapshot fact tables, but do not handle accumulating snapshot fact tables because of the limitations on overwriting data described in the previous point.
- OLAP cubes typically support complex ragged hierarchies of indeterminate depth, such as organization charts or bills of material, using native query syntax that is superior to the approaches required for RDBMSs.
- OLAP cubes may impose detailed constraints on the structure of dimension keys that implement drill-down hierarchies compared to relational databases.
- Some OLAP products do not enable dimensional roles or aliases, thus requiring separate physical dimensions to be defined.
We'll return to the world of dimensional modeling in a relational platform as we consider the two key components of a star schema.
Fact Tables for Measurements
The fact table in a dimensional model stores the performance measurements resulting from an organization's business process events. You should strive to store the low-level measurement data resulting from a business process in a single dimensional model. Because measurement data is overwhelmingly the largest set of data, it should not be replicated in multiple places for multiple organizational functions around the enterprise. Allowing business users from multiple organizations to access a single centralized repository for each set of measurement data ensures the use of consistent data throughout the enterprise.
The term fact represents a business measure. Imagine standing in the marketplace watching products being sold and writing down the unit quantity and dollar sales amount for each product in each sales transaction. These measurements are captured as products are scanned at the register, as illustrated in Figure 1.2.
Figure 1.2 Business process measurement events translate into fact tables.
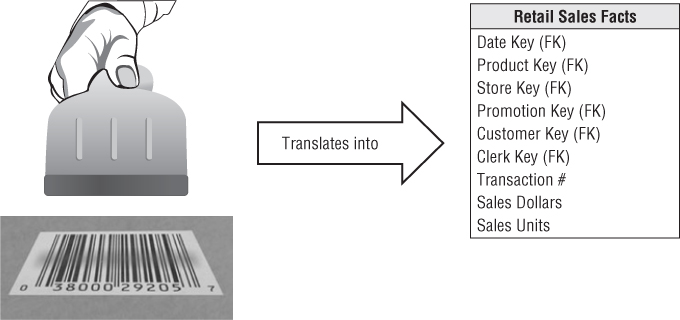
Each row in a fact table corresponds to a measurement event. The data on each row is at a specific level of detail, referred to as the grain, such as one row per product sold on a sales transaction. One of the core tenets of dimensional modeling is that all the measurement rows in a fact table must be at the same grain. Having the discipline to create fact tables with a single level of detail ensures that measurements aren't inappropriately double-counted.
The most useful facts are numeric and additive, such as dollar sales amount. Throughout this book we will use dollars as the standard currency to make the case study examples more tangible—you can substitute your own local currency if it isn't dollars.
Additivity is crucial because BI applications rarely retrieve a single fact table row. Rather, they bring back hundreds, thousands, or even millions of fact rows at a time, and the most useful thing to do with so many rows is to add them up. No matter how the user slices the data in Figure 1.2, the sales units and dollars sum to a valid total. You will see that facts are sometimes semi-additive or even non-additive. Semi-additive facts, such as account balances, cannot be summed across the time dimension. Non-additive facts, such as unit prices, can never be added. You are forced to use counts and averages or are reduced to printing out the fact rows one at a time—an impractical exercise with a billion-row fact table.
Facts are often described as continuously valued to help sort out what is a fact versus a dimension attribute. The dollar sales amount fact is continuously valued in this example because it can take on virtually any value within a broad range. As an observer, you must stand out in the marketplace and wait for the measurement before you have any idea what the value will be.
It is theoretically possible for a measured fact to be textual; however, the condition rarely arises. In most cases, a textual measurement is a description of something and is drawn from a discrete list of values. The designer should make every effort to put textual data into dimensions where they can be correlated more effectively with the other textual dimension attributes and consume much less space. You should not store redundant textual information in fact tables. Unless the text is unique for every row in the fact table, it belongs in the dimension table. A true text fact is rare because the unpredictable content of a text fact, like a freeform text comment, makes it nearly impossible to analyze.
Referring to the sample fact table in Figure 1.2, if there is no sales activity for a given product, you don't put any rows in the table. It is important that you do not try to fill the fact table with zeros representing no activity because these zeros would overwhelm most fact tables. By including only true activity, fact tables tend to be quite sparse. Despite their sparsity, fact tables usually make up 90 percent or more of the total space consumed by a dimensional model. Fact tables tend to be deep in terms of the number of rows, but narrow in terms of the number of columns. Given their size, you should be judicious about fact table space utilization.
As examples are developed throughout this book, you will see that all fact table grains fall into one of three categories: transaction, periodic snapshot, and accumulating snapshot. Transaction grain fact tables are the most common. We will introduce transaction fact tables in Chapter 3: Retail Sales, and both periodic and accumulating snapshots in Chapter 4: Inventory.
All fact tables have two or more foreign keys (refer to the FK notation in Figure 1.2) that connect to the dimension tables' primary keys. For example, the product key in the fact table always matches a specific product key in the product dimension table. When all the keys in the fact table correctly match their respective primary keys in the corresponding dimension tables, the tables satisfy referential integrity. You access the fact table via the dimension tables joined to it.
The fact table generally has its own primary key composed of a subset of the foreign keys. This key is often called a composite key. Every table that has a composite key is a fact table. Fact tables express many-to-many relationships. All others are dimension tables.
There are usually a handful of dimensions that together uniquely identify each fact table row. After this subset of the overall dimension list has been identified, the rest of the dimensions take on a single value in the context of the fact table row's primary key. In other words, they go along for the ride.
Dimension Tables for Descriptive Context
Dimension tables are integral companions to a fact table. The dimension tables contain the textual context associated with a business process measurement event. They describe the “who, what, where, when, how, and why” associated with the event.
As illustrated in Figure 1.3, dimension tables often have many columns or attributes. It is not uncommon for a dimension table to have 50 to 100 attributes; although, some dimension tables naturally have only a handful of attributes. Dimension tables tend to have fewer rows than fact tables, but can be wide with many large text columns. Each dimension is defined by a single primary key (refer to the PK notation in Figure 1.3), which serves as the basis for referential integrity with any given fact table to which it is joined.
Figure 1.3 Dimension tables contain descriptive characteristics of business process nouns.

Dimension attributes serve as the primary source of query constraints, groupings, and report labels. In a query or report request, attributes are identified as the by words. For example, when a user wants to see dollar sales by brand, brand must be available as a dimension attribute.
Dimension table attributes play a vital role in the DW/BI system. Because they are the source of virtually all constraints and report labels, dimension attributes are critical to making the DW/BI system usable and understandable. Attributes should consist of real words rather than cryptic abbreviations. You should strive to minimize the use of codes in dimension tables by replacing them with more verbose textual attributes. You may have already trained the business users to memorize operational codes, but going forward, minimize their reliance on miniature notes attached to their monitor for code translations. You should make standard decodes for the operational codes available as dimension attributes to provide consistent labeling on queries, reports, and BI applications. The decode values should never be buried in the reporting applications where inconsistency is inevitable.
Sometimes operational codes or identifiers have legitimate business significance to users or are required to communicate back to the operational world. In these cases, the codes should appear as explicit dimension attributes, in addition to the corresponding user-friendly textual descriptors. Operational codes sometimes have intelligence embedded in them. For example, the first two digits may identify the line of business, whereas the next two digits may identify the global region. Rather than forcing users to interrogate or filter on substrings within the operational codes, pull out the embedded meanings and present them to users as separate dimension attributes that can easily be filtered, grouped, or reported.
In many ways, the data warehouse is only as good as the dimension attributes; the analytic power of the DW/BI environment is directly proportional to the quality and depth of the dimension attributes. The more time spent providing attributes with verbose business terminology, the better. The more time spent populating the domain values in an attribute column, the better. The more time spent ensuring the quality of the values in an attribute column, the better. Robust dimension attributes deliver robust analytic slicing-and-dicing capabilities.
When triaging operational source data, it is sometimes unclear whether a numeric data element is a fact or dimension attribute. You often make the decision by asking whether the column is a measurement that takes on lots of values and participates in calculations (making it a fact) or is a discretely valued description that is more or less constant and participates in constraints and row labels (making it a dimensional attribute). For example, the standard cost for a product seems like a constant attribute of the product but may be changed so often that you decide it is more like a measured fact. Occasionally, you can't be certain of the classification; it is possible to model the data element either way (or both ways) as a matter of the designer's prerogative.
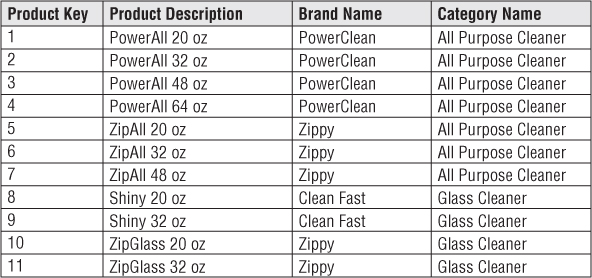
Figure 1.4 shows that dimension tables often represent hierarchical relationships. For example, products roll up into brands and then into categories. For each row in the product dimension, you should store the associated brand and category description. The hierarchical descriptive information is stored redundantly in the spirit of ease of use and query performance. You should resist the perhaps habitual urge to normalize data by storing only the brand code in the product dimension and creating a separate brand lookup table, and likewise for the category description in a separate category lookup table. This normalization is called snowflaking. Instead of third normal form, dimension tables typically are highly denormalized with flattened many-to-one relationships within a single dimension table. Because dimension tables typically are geometrically smaller than fact tables, improving storage efficiency by normalizing or snowflaking has virtually no impact on the overall database size. You should almost always trade off dimension table space for simplicity and accessibility.
Figure 1.4 Sample rows from a dimension table with denormalized hierarchies.
Contrary to popular folklore, Ralph Kimball didn't invent the terms fact and dimension. As best as can be determined, the dimension and fact terminology originated from a joint research project conducted by General Mills and Dartmouth University in the 1960s. In the 1970s, both AC Nielsen and IRI used the terms consistently to describe their syndicated data offerings and gravitated to dimensional models for simplifying the presentation of their analytic information. They understood that their data wouldn't be used unless it was packaged simply. It is probably accurate to say that no single person invented the dimensional approach. It is an irresistible force in designing databases that always results when the designer places understandability and performance as the highest goals.
Presentation Area to Support Business Intelligence
Now that you understand fact and dimension tables, it's time to bring the building blocks together in a dimensional model, as shown in Figure 1.5. Each business process is represented by a dimensional model that consists of a fact table containing the event's numeric measurements surrounded by a halo of dimension tables that contain the textual context that was true at the moment the event occurred. This characteristic star-like structure is often called a star join, a term dating back to the earliest days of relational databases.
Figure 1.5 Fact and dimension tables in a dimensional model.
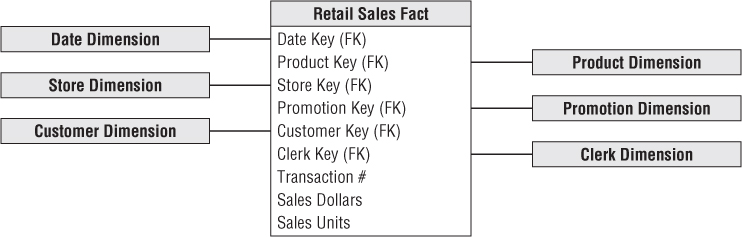
The first thing to notice about the dimensional schema is its simplicity and symmetry. Obviously, business users benefit from the simplicity because the data is easier to understand and navigate. The charm of the design in Figure 1.5 is that it is highly recognizable to business users. We have observed literally hundreds of instances in which users immediately agree that the dimensional model is their business. Furthermore, the reduced number of tables and use of meaningful business descriptors make it easy to navigate and less likely that mistakes will occur.
The simplicity of a dimensional model also has performance benefits. Database optimizers process these simple schemas with fewer joins more efficiently. A database engine can make strong assumptions about first constraining the heavily indexed dimension tables, and then attacking the fact table all at once with the Cartesian product of the dimension table keys satisfying the user's constraints. Amazingly, using this approach, the optimizer can evaluate arbitrary n-way joins to a fact table in a single pass through the fact table's index.
Finally, dimensional models are gracefully extensible to accommodate change. The predictable framework of a dimensional model withstands unexpected changes in user behavior. Every dimension is equivalent; all dimensions are symmetrically-equal entry points into the fact table. The dimensional model has no built-in bias regarding expected query patterns. There are no preferences for the business questions asked this month versus the questions asked next month. You certainly don't want to adjust schemas if business users suggest new ways to analyze their business.
This book illustrates repeatedly that the most granular or atomic data has the most dimensionality. Atomic data that has not been aggregated is the most expressive data; this atomic data should be the foundation for every fact table design to withstand business users' ad hoc attacks in which they pose unexpected queries. With dimensional models, you can add completely new dimensions to the schema as long as a single value of that dimension is defined for each existing fact row. Likewise, you can add new facts to the fact table, assuming that the level of detail is consistent with the existing fact table. You can supplement preexisting dimension tables with new, unanticipated attributes. In each case, existing tables can be changed in place either by simply adding new data rows in the table or by executing an SQL ALTER TABLE command. Data would not need to be reloaded, and existing BI applications would continue to run without yielding different results. We examine this graceful extensibility of dimensional models more fully in Chapter 3.
Another way to think about the complementary nature of fact and dimension tables is to see them translated into a report. As illustrated in Figure 1.6, dimension attributes supply the report filters and labeling, whereas the fact tables supply the report's numeric values.
Figure 1.6 Dimensional attributes and facts form a simple report.
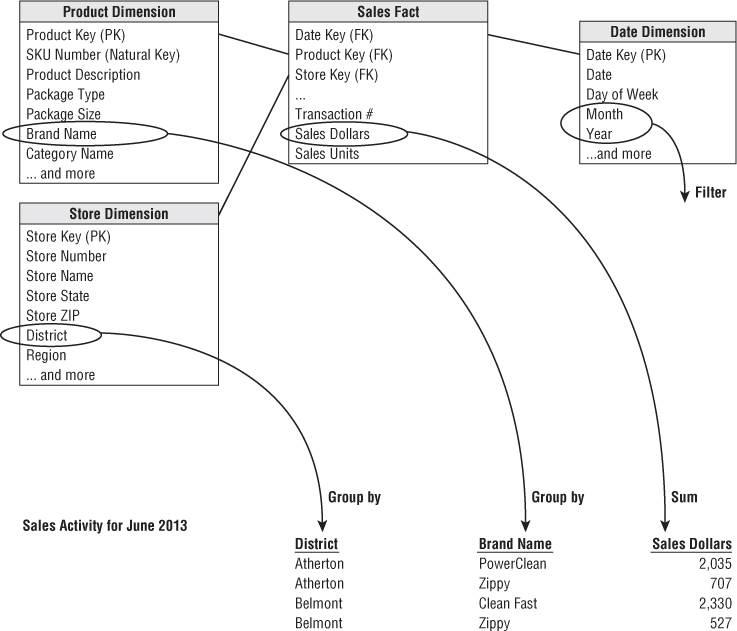
You can easily envision the SQL that's written (or more likely generated by a BI tool) to create this report:
SELECT
     store.district_name,
     product.brand,
     sum(sales_facts.sales_dollars) AS "Sales Dollars"
FROM
     store,
     product,
     date,
     sales_facts
WHERE
     date.month_name="January" AND
     date.year=2013 AND
     store.store_key = sales_facts.store_key AND
     product.product_key = sales_facts.product_key AND
     date.date_key = sales_facts.date_key
GROUP BY
     store.district_name,
     product.brand
If you study this code snippet line-by-line, the first two lines under the SELECT statement identify the dimension attributes in the report, followed by the aggregated metric from the fact table. The FROM clause identifies all the tables involved in the query. The first two lines in the WHERE clause declare the report's filter, and the remainder declare the joins between the dimension and fact tables. Finally, the GROUP BY clause establishes the aggregation within the report.
Kimball's DW/BI Architecture
Let's build on your understanding of DW/BI systems and dimensional modeling fundamentals by investigating the components of a DW/BI environment based on the Kimball architecture. You need to learn the strategic significance of each component to avoid confusing their role and function.
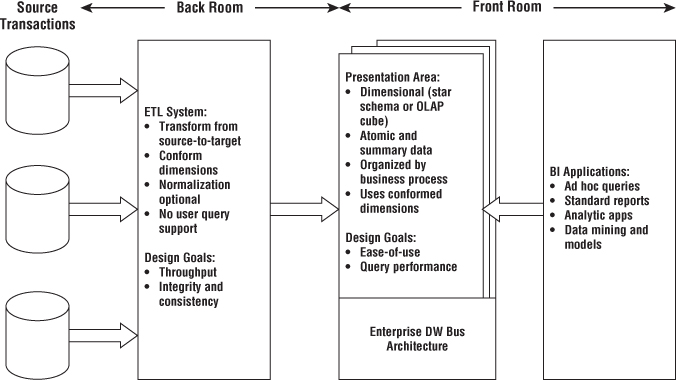
As illustrated in Figure 1.7, there are four separate and distinct components to consider in the DW/BI environment: operational source systems, ETL system, data presentation area, and business intelligence applications.
Figure 1.7 Core elements of the Kimball DW/BI architecture.
Operational Source Systems
These are the operational systems of record that capture the business's transactions. Think of the source systems as outside the data warehouse because presumably you have little or no control over the content and format of the data in these operational systems. The main priorities of the source systems are processing performance and availability. Operational queries against source systems are narrow, one-record-at-a-time queries that are part of the normal transaction flow and severely restricted in their demands on the operational system. It is safe to assume that source systems are not queried in the broad and unexpected ways that DW/BI systems typically are queried. Source systems maintain little historical data; a good data warehouse can relieve the source systems of much of the responsibility for representing the past. In many cases, the source systems are special purpose applications without any commitment to sharing common data such as product, customer, geography, or calendar with other operational systems in the organization. Of course, a broadly adopted cross-application enterprise resource planning (ERP) system or operational master data management system could help address these shortcomings.
Extract, Transformation, and Load System
The extract, transformation, and load (ETL) system of the DW/BI environment consists of a work area, instantiated data structures, and a set of processes. The ETL system is everything between the operational source systems and the DW/BI presentation area. We elaborate on the architecture of ETL systems and associated techniques in Chapter 19: ETL Subsystems and Techniques, but we want to introduce this fundamental piece of the overall DW/BI system puzzle.
Extraction is the first step in the process of getting data into the data warehouse environment. Extracting means reading and understanding the source data and copying the data needed into the ETL system for further manipulation. At this point, the data belongs to the data warehouse.
After the data is extracted to the ETL system, there are numerous potential transformations, such as cleansing the data (correcting misspellings, resolving domain conflicts, dealing with missing elements, or parsing into standard formats), combining data from multiple sources, and de-duplicating data. The ETL system adds value to the data with these cleansing and conforming tasks by changing the data and enhancing it. In addition, these activities can be architected to create diagnostic metadata, eventually leading to business process reengineering to improve data quality in the source systems over time.
The final step of the ETL process is the physical structuring and loading of data into the presentation area's target dimensional models. Because the primary mission of the ETL system is to hand off the dimension and fact tables in the delivery step, these subsystems are critical. Many of these defined subsystems focus on dimension table processing, such as surrogate key assignments, code lookups to provide appropriate descriptions, splitting, or combining columns to present the appropriate data values, or joining underlying third normal form table structures into flattened denormalized dimensions. In contrast, fact tables are typically large and time consuming to load, but preparing them for the presentation area is typically straightforward. When the dimension and fact tables in a dimensional model have been updated, indexed, supplied with appropriate aggregates, and further quality assured, the business community is notified that the new data has been published.
There remains industry consternation about whether the data in the ETL system should be repurposed into physical normalized structures prior to loading into the presentation area's dimensional structures for querying and reporting. The ETL system is typically dominated by the simple activities of sorting and sequential processing. In many cases, the ETL system is not based on relational technology but instead may rely on a system of flat files. After validating the data for conformance with the defined one-to-one and many-to-one business rules, it may be pointless to take the final step of building a 3NF physical database, just before transforming the data once again into denormalized structures for the BI presentation area.
However, there are cases in which the data arrives at the doorstep of the ETL system in a 3NF relational format. In these situations, the ETL system developers may be more comfortable performing the cleansing and transformation tasks using normalized structures. Although a normalized database for ETL processing is acceptable, we have some reservations about this approach. The creation of both normalized structures for the ETL and dimensional structures for presentation means that the data is potentially extracted, transformed, and loaded twice—once into the normalized database and then again when you load the dimensional model. Obviously, this two-step process requires more time and investment for the development, more time for the periodic loading or updating of data, and more capacity to store the multiple copies of the data. At the bottom line, this typically translates into the need for larger development, ongoing support, and hardware platform budgets. Unfortunately, some DW/BI initiatives have failed miserably because they focused all their energy and resources on constructing the normalized structures rather than allocating time to developing a dimensional presentation area that supports improved business decision making. Although enterprise-wide data consistency is a fundamental goal of the DW/BI environment, there may be effective and less costly approaches than physically creating normalized tables in the ETL system, if these structures don't already exist.
Presentation Area to Support Business Intelligence
The DW/BI presentation area is where data is organized, stored, and made available for direct querying by users, report writers, and other analytical BI applications. Because the back room ETL system is off-limits, the presentation area is the DW/BI environment as far as the business community is concerned; it is all the business sees and touches via their access tools and BI applications. The original pre-release working title for the first edition of The Data Warehouse Toolkit was Getting the Data Out. This is what the presentation area with its dimensional models is all about.
We have several strong opinions about the presentation area. First of all, we insist that the data be presented, stored, and accessed in dimensional schemas, either relational star schemas or OLAP cubes. Fortunately, the industry has matured to the point where we're no longer debating this approach; it has concluded that dimensional modeling is the most viable technique for delivering data to DW/BI users.
Our second stake in the ground about the presentation area is that it must contain detailed, atomic data. Atomic data is required to withstand assaults from unpredictable ad hoc user queries. Although the presentation area also may contain performance-enhancing aggregated data, it is not sufficient to deliver these summaries without the underlying granular data in a dimensional form. In other words, it is completely unacceptable to store only summary data in dimensional models while the atomic data is locked up in normalized models. It is impractical to expect a user to drill down through dimensional data almost to the most granular level and then lose the benefits of a dimensional presentation at the final step. Although DW/BI users and applications may look infrequently at a single line item on an order, they may be very interested in last week's orders for products of a given size (or flavor, package type, or manufacturer) for customers who first purchased within the last 6 months (or reside in a given state or have certain credit terms). The most finely grained data must be available in the presentation area so that users can ask the most precise questions possible. Because users' requirements are unpredictable and constantly changing, you must provide access to the exquisite details so they can roll up to address the questions of the moment.
The presentation data area should be structured around business process measurement events. This approach naturally aligns with the operational source data capture systems. Dimensional models should correspond to physical data capture events; they should not be designed to deliver the report-of-the-day. An enterprise's business processes cross the boundaries of organizational departments and functions. In other words, you should construct a single fact table for atomic sales metrics rather than populating separate similar, but slightly different, databases containing sales metrics for the sales, marketing, logistics, and finance teams.
All the dimensional structures must be built using common, conformed dimensions. This is the basis of the enterprise data warehouse bus architecture described in Chapter 4. Adherence to the bus architecture is the final stake in the ground for the presentation area. Without shared, conformed dimensions, a dimensional model becomes a standalone application. Isolated stovepipe data sets that cannot be tied together are the bane of the DW/BI movement as they perpetuate incompatible views of the enterprise. If you have any hope of building a robust and integrated DW/BI environment, you must commit to the enterprise bus architecture. When dimensional models have been designed with conformed dimensions, they can be readily combined and used together. The presentation area in a large enterprise DW/BI solution ultimately consists of dozens of dimensional models with many of the associated dimension tables shared across fact tables.
Using the bus architecture is the secret to building distributed DW/BI systems. When the bus architecture is used as a framework, you can develop the enterprise data warehouse in an agile, decentralized, realistically scoped, iterative manner.
Business Intelligence Applications
The final major component of the Kimball DW/BI architecture is the business intelligence (BI) application. The term BI application loosely refers to the range of capabilities provided to business users to leverage the presentation area for analytic decision making. By definition, all BI applications query the data in the DW/BI presentation area. Querying, obviously, is the whole point of using data for improved decision making.
A BI application can be as simple as an ad hoc query tool or as complex as a sophisticated data mining or modeling application. Ad hoc query tools, as powerful as they are, can be understood and used effectively by only a small percentage of the potential DW/BI business user population. Most business users will likely access the data via prebuilt parameter-driven applications and templates that do not require users to construct queries directly. Some of the more sophisticated applications, such as modeling or forecasting tools, may upload results back into the operational source systems, ETL system, or presentation area.
Restaurant Metaphor for the Kimball Architecture
One of our favorite metaphors reinforces the importance of separating the overall DW/BI environment into distinct components. In this case, we'll consider the similarities between a restaurant and the DW/BI environment.
ETL in the Back Room Kitchen
The ETL system is analogous to the kitchen of a restaurant. The restaurant's kitchen is a world unto itself. Talented chefs take raw materials and transform them into appetizing, delicious meals for the restaurant's diners. But long before a commercial kitchen swings into operation, a significant amount of planning goes into designing the workspace layout and components.
The kitchen is organized with several design goals in mind. First, the layout must be highly efficient. Restaurant managers want high kitchen throughput. When the restaurant is packed and everyone is hungry, there is no time for wasted movement. Delivering consistent quality from the restaurant's kitchen is the second important goal. The establishment is doomed if the plates coming out of the kitchen repeatedly fail to meet expectations. To achieve consistency, chefs create their special sauces once in the kitchen, rather than sending ingredients out to the table where variations will inevitably occur. Finally, the kitchen's output, the meals delivered to restaurant customers, must also be of high integrity. You wouldn't want someone to get food poisoning from dining at your restaurant. Consequently, kitchens are designed with integrity in mind; salad preparation doesn't happen on the same surfaces where raw chicken is handled.
Just as quality, consistency, and integrity are major considerations when designing the restaurant's kitchen, they are also ongoing concerns for everyday management of the restaurant. Chefs strive to obtain the best raw materials possible. Procured products must meet quality standards and are rejected if they don't meet minimum standards. Most fine restaurants modify their menus based on the availability of quality ingredients.
The restaurant staffs its kitchen with skilled professionals wielding the tools of their trade. Cooks manipulate razor-sharp knives with incredible confidence and ease. They operate powerful equipment and work around extremely hot surfaces without incident.
Given the dangerous surroundings, the back room kitchen is off limits to restaurant patrons. Things happen in the kitchen that customers just shouldn't see. It simply isn't safe. Professional cooks handling sharp knives shouldn't be distracted by diners' inquiries. You also wouldn't want patrons entering the kitchen to dip their fingers into a sauce to see whether they want to order an entree. To prevent these intrusions, most restaurants have a closed door that separates the kitchen from the area where diners are served. Even restaurants that boast an open kitchen format typically have a barrier, such as a partial wall of glass, separating the two environments. Diners are invited to watch but can't wander into the kitchen. Although part of the kitchen may be visible, there are always out-of-view back rooms where the less visually desirable preparation occurs.
The data warehouse's ETL system resembles the restaurant's kitchen. Source data is magically transformed into meaningful, presentable information. The back room ETL system must be laid out and architected long before any data is extracted from the source. Like the kitchen, the ETL system is designed to ensure throughput. It must transform raw source data into the target model efficiently, minimizing unnecessary movement.
Obviously, the ETL system is also highly concerned about data quality, integrity, and consistency. Incoming data is checked for reasonable quality as it enters. Conditions are continually monitored to ensure ETL outputs are of high integrity. Business rules to consistently derive value-add metrics and attributes are applied once by skilled professionals in the ETL system rather than relying on each patron to develop them independently. Yes, that puts extra burden on the ETL team, but it's done to deliver a better, more consistent product to the DW/BI patrons.
Finally, ETL system should be off limits to the business users and BI application developers. Just as you don't want restaurant patrons wandering into the kitchen and potentially consuming semi-cooked food, you don't want busy ETL professionals distracted by unpredictable inquiries from BI users. The consequences might be highly unpleasant if users dip their fingers into interim staging pots while data preparation is still in process. As with the restaurant kitchen, activities occur in the ETL system that the DW/BI patrons shouldn't see. When the data is ready and quality checked for user consumption, it's brought through the doorway into the DW/BI presentation area.
Data Presentation and BI in the Front Dining Room
Now turn your attention to the restaurant's dining room. What are the key factors that differentiate restaurants? According to the popular restaurant ratings and reviews, restaurants are typically scored on four distinct qualities:
- Food (quality, taste, and presentation)
- Decor (appealing, comfortable surroundings for the patrons)
- Service (prompt food delivery, attentive support staff, and food received as ordered)
- Cost
Most patrons focus initially on the food score when they're evaluating dining options. First and foremost, does the restaurant serve good food? That's the restaurant's primary deliverable. However, the decor, service, and cost factors also affect the patrons' overall dining experience and are considerations when evaluating whether to eat at a restaurant.
Of course, the primary deliverable from the DW/BI kitchen is the data in the presentation area. What data is available? Like the restaurant, the DW/BI system provides “menus” to describe what's available via metadata, published reports, and parameterized analytic applications. The DW/BI patrons expect consistency and high quality. The presentation area's data must be properly prepared and safe to consume.
The presentation area's decor should be organized for the patrons' comfort. It must be designed based on the preferences of the BI diners, not the development staff. Service is also critical in the DW/BI system. Data must be delivered, as ordered, promptly in a form that is appealing to the business user or BI application developer.
Finally, cost is a factor for the DW/BI system. The kitchen staff may be dreaming up elaborate, expensive meals, but if there's no market at that price point, the restaurant won't survive.
If restaurant patrons like their dining experience, then everything is rosy for the restaurant manager. The dining room is always busy; sometimes there's even a waiting list. The restaurant manager's performance metrics are all promising: high numbers of diners, table turnovers, and nightly revenue and profit, while staff turnover is low. Things look so good that the restaurant's owner is considering an expansion site to handle the traffic. On the other hand, if the restaurant's diners aren't happy, things go downhill in a hurry. With a limited number of patrons, the restaurant isn't making enough money to cover its expenses, and the staff isn't making any tips. In a relatively short time, the restaurant closes.
Restaurant managers often proactively check on their diners' satisfaction with the food and dining experience. If a patron is unhappy, they take immediate action to rectify the situation. Similarly, DW/BI managers should proactively monitor satisfaction. You can't afford to wait to hear complaints. Often, people will abandon a restaurant without even voicing their concerns. Over time, managers notice that diner counts have dropped but may not even know why.
Inevitably, the prior DW/BI patrons will locate another “restaurant” that better suits their needs and preferences, wasting the millions of dollars invested to design, build, and staff the DW/BI system. Of course, you can prevent this unhappy ending by managing the restaurant proactively; make sure the kitchen is properly organized and utilized to deliver as needed to the presentation area's food, decor, service, and cost.
Alternative DW/BI Architectures
Having just described the Kimball architecture, let's discuss several other DW/BI architectural approaches. We'll quickly review the two dominant alternatives to the Kimball architecture, highlighting the similarities and differences. We'll then close this section by focusing on a hybrid approach that combines alternatives.
Fortunately, over the past few decades, the differences between the Kimball architecture and the alternatives have softened. Even more fortunate, there's a role for dimensional modeling regardless of your architectural predisposition.
We acknowledge that organizations have successfully constructed DW/BI systems based on the approaches advocated by others. We strongly believe that rather than encouraging more consternation over our philosophical differences, the industry would be far better off devoting energy to ensure that our DW/BI deliverables are broadly accepted by the business to make better, more informed decisions. The architecture should merely be a means to this objective.
Independent Data Mart Architecture
With this approach, analytic data is deployed on a departmental basis without concern to sharing and integrating information across the enterprise, as illustrated in Figure 1.8. Typically, a single department identifies requirements for data from an operational source system. The department works with IT staff or outside consultants to construct a database that satisfies their departmental needs, reflecting their business rules and preferred labeling. Working in isolation, this departmental data mart addresses the department's analytic requirements.
Figure 1.8 Simplified illustration of the independent data mart “architecture.”
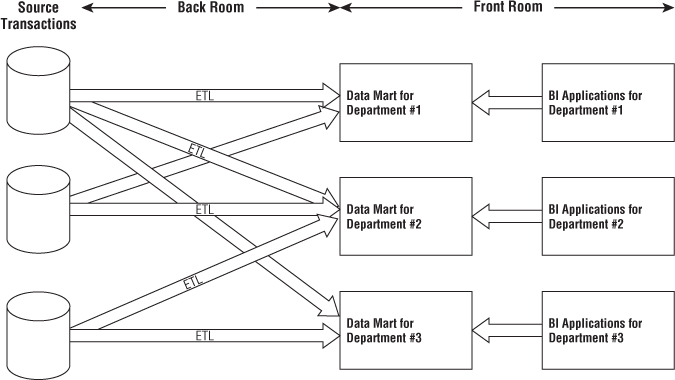
Meanwhile, another department is interested in the same source data. It's extremely common for multiple departments to be interested in the same performance metrics resulting from an organization's core business process events. But because this department doesn't have access to the data mart initially constructed by the other department, it proceeds down a similar path on its own, obtaining resources and building a departmental solution that contains similar, but slightly different data. When business users from these two departments discuss organizational performance based on reports from their respective repositories, not surprisingly, none of the numbers match because of the differences in business rules and labeling.
These standalone analytic silos represent a DW/BI “architecture” that's essentially un-architected. Although no industry leaders advocate these independent data marts, this approach is prevalent, especially in large organizations. It mirrors the way many organizations fund IT projects, plus it requires zero cross-organizational data governance and coordination. It's the path of least resistance for fast development at relatively low cost, at least in the short run. Of course, multiple uncoordinated extracts from the same operational sources and redundant storage of analytic data are inefficient and wasteful in the long run. Without any enterprise perspective, this independent approach results in myriad standalone point solutions that perpetuate incompatible views of the organization's performance, resulting in unnecessary organizational debate and reconciliation.
We strongly discourage the independent data mart approach. However, often these independent data marts have embraced dimensional modeling because they're interested in delivering data that's easy for the business to understand and highly responsive to queries. So our concepts of dimensional modeling are often applied in this architecture, despite the complete disregard for some of our core tenets, such as focusing on atomic details, building by business process instead of department, and leveraging conformed dimensions for enterprise consistency and integration.
Hub-and-Spoke Corporate Information Factory Inmon Architecture
The hub-and-spoke Corporate Information Factory (CIF) approach is advocated by Bill Inmon and others in the industry. Figure 1.9 illustrates a simplified version of the CIF, focusing on the core elements and concepts that warrant discussion.
Figure 1.9 Simplified illustration of the hub-and-spoke Corporate Information Factory architecture.
With the CIF, data is extracted from the operational source systems and processed through an ETL system sometimes referred to as data acquisition. The atomic data that results from this processing lands in a 3NF database; this normalized, atomic repository is referred to as the Enterprise Data Warehouse (EDW) within the CIF architecture. Although the Kimball architecture enables optional normalization to support ETL processing, the normalized EDW is a mandatory construct in the CIF. Like the Kimball approach, the CIF advocates enterprise data coordination and integration. The CIF says the normalized EDW fills this role, whereas the Kimball architecture stresses the importance of an enterprise bus with conformed dimensions.
Organizations who have adopted the CIF approach often have business users accessing the EDW repository due to its level of detail or data availability timeliness. However, subsequent ETL data delivery processes also populate downstream reporting and analytic environments to support business users. Although often dimensionally structured, the resultant analytic databases typically differ from structures in the Kimball architecture's presentation area in that they're frequently departmentally-centric (rather than organized around business processes) and populated with aggregated data (rather than atomic details). If the data delivery ETL processes apply business rules beyond basic summarization, such as departmental renaming of columns or alternative calculations, it may be difficult to tie these analytic databases to the EDW's atomic repository.
Hybrid Hub-and-Spoke and Kimball Architecture
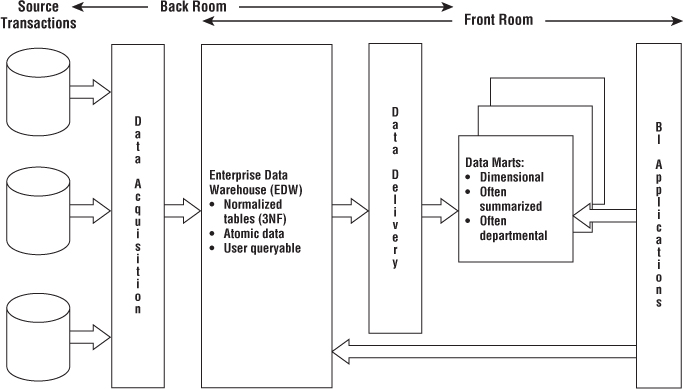
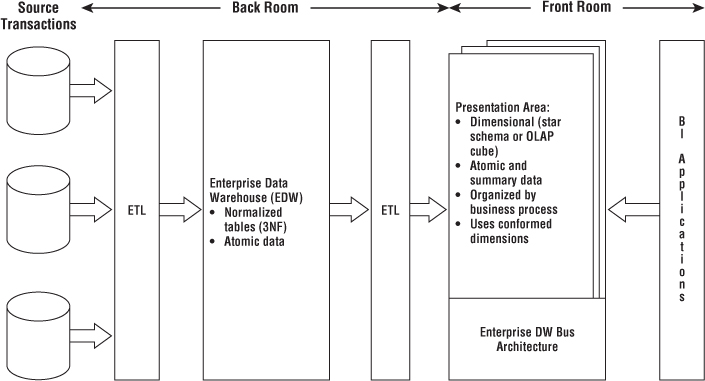
The final architecture warranting discussion is the marriage of the Kimball and Inmon CIF architectures. As illustrated in Figure 1.10, this architecture populates a CIF-centric EDW that is completely off-limits to business users for analysis and reporting. It's merely the source to populate a Kimball-esque presentation area in which the data is dimensional, atomic (complemented by aggregates), process-centric, and conforms to the enterprise data warehouse bus architecture.
Figure 1.10 Hybrid architecture with 3NF structures and dimensional Kimball presentation area.
Some proponents of this blended approach claim it's the best of both worlds. Yes, it blends the two enterprise-oriented approaches. It may leverage a preexisting investment in an integrated repository, while addressing the performance and usability issues associated with the 3NF EDW by offloading queries to the dimensional presentation area. And because the end deliverable to the business users and BI applications is constructed based on Kimball tenets, who can argue with the approach?
If you've already invested in the creation of a 3NF EDW, but it's not delivering on the users' expectations of fast and flexible reporting and analysis, this hybrid approach might be appropriate for your organization. If you're starting with a blank sheet of paper, the hybrid approach will likely cost more time and money, both during development and ongoing operation, given the multiple movements of data and redundant storage of atomic details. If you have the appetite, the perceived need, and perhaps most important, the budget and organizational patience to fully normalize and instantiate your data before loading it into dimensional structures that are well designed according to the Kimball methods, go for it.
Dimensional Modeling Myths
Despite the widespread acceptance of dimensional modeling, some misperceptions persist in the industry. These false assertions are a distraction, especially when you want to align your team around common best practices. If folks in your organization continually lob criticisms about dimensional modeling, this section should be on their recommended reading list; their perceptions may be clouded by these common misunderstandings.
Myth 1: Dimensional Models are Only for Summary Data
This first myth is frequently the root cause of ill-designed dimensional models. Because you can't possibly predict all the questions asked by business users, you need to provide them with queryable access to the most detailed data so they can roll it up based on the business question. Data at the lowest level of detail is practically impervious to surprises or changes. Summary data should complement the granular detail solely to provide improved performance for common queries, but not replace the details.
A related corollary to this first myth is that only a limited amount of historical data should be stored in dimensional structures. Nothing about a dimensional model prohibits storing substantial history. The amount of history available in dimensional models must only be driven by the business's requirements.
Myth 2: Dimensional Models are Departmental, Not Enterprise
Rather than drawing boundaries based on organizational departments, dimensional models should be organized around business processes, such as orders, invoices, and service calls. Multiple business functions often want to analyze the same metrics resulting from a single business process. Multiple extracts of the same source data that create multiple, inconsistent analytic databases should be avoided.
Myth 3: Dimensional Models are Not Scalable
Dimensional models are extremely scalable. Fact tables frequently have billions of rows; fact tables containing 2 trillion rows have been reported. The database vendors have wholeheartedly embraced DW/BI and continue to incorporate capabilities into their products to optimize dimensional models' scalability and performance.
Both normalized and dimensional models contain the same information and data relationships; the logical content is identical. Every data relationship expressed in one model can be accurately expressed in the other. Both normalized and dimensional models can answer exactly the same questions, albeit with varying difficulty.
Myth 4: Dimensional Models are Only for Predictable Usage
Dimensional models should not be designed by focusing on predefined reports or analyses; the design should center on measurement processes. Obviously, it's important to consider the BI application's filtering and labeling requirements. But you shouldn't design for a top ten list of reports in a vacuum because this list is bound to change, making the dimensional model a moving target. The key is to focus on the organization's measurement events that are typically stable, unlike analyses that are constantly evolving.
A related corollary is that dimensional models aren't responsive to changing business needs. On the contrary, because of their symmetry, dimensional structures are extremely flexible and adaptive to change. The secret to query flexibility is building fact tables at the most granular level. Dimensional models that deliver only summary data are bound to be problematic; users run into analytic brick walls when they try to drill down into details not available in the summary tables. Developers also run into brick walls because they can't easily accommodate new dimensions, attributes, or facts with these prematurely summarized tables. The correct starting point for your dimensional models is to express data at the lowest detail possible for maximum flexibility and extensibility. Remember, when you pre-suppose the business question, you'll likely pre-summarize the data, which can be fatal in the long run.
As the architect Mies van der Rohe is credited with saying, “God is in the details.” Delivering dimensional models populated with the most detailed data possible ensures maximum flexibility and extensibility. Delivering anything less in your dimensional models undermines the foundation necessary for robust business intelligence.
Myth 5: Dimensional Models Can't Be Integrated
Dimensional models most certainly can be integrated if they conform to the enterprise data warehouse bus architecture. Conformed dimensions are built and maintained as centralized, persistent master data in the ETL system and then reused across dimensional models to enable data integration and ensure semantic consistency. Data integration depends on standardized labels, values, and definitions. It is hard work to reach organizational consensus and then implement the corresponding ETL rules, but you can't dodge the effort, regardless of whether you're populating normalized or dimensional models.
Presentation area databases that don't adhere to the bus architecturewith shared conformed dimensions lead to standalone solutions. You can't hold dimensional modeling responsible for organizations' failure to embrace one of its fundamental tenets.
More Reasons to Think Dimensionally
The majority of this book focuses on dimensional modeling for designing databases in the DW/BI presentation area. But dimensional modeling concepts go beyond the design of simple and fast data structures. You should think dimensionally at other critical junctures of a DW/BI project.
When gathering requirements for a DW/BI initiative, you need to listen for and then synthesize the findings around business processes. Sometimes teams get lulled into focusing on a set of required reports or dashboard gauges. Instead you should constantly ask yourself about the business process measurement events producing the report or dashboard metrics. When specifying the project's scope, you must stand firm to focus on a single business process per project and not sign up to deploy a dashboard that covers a handful of them in a single iteration.
Although it's critical that the DW/BI team concentrates on business processes, it's equally important to get IT and business management on the same wavelength. Due to historical IT funding policies, the business may be more familiar with departmental data deployments. You need to shift their mindset about the DW/BI rollout to a process perspective. When prioritizing opportunities and developing the DW/BI roadmap, business processes are the unit of work. Fortunately, business management typically embraces this approach because it mirrors their thinking about key performance indicators. Plus, they've lived with the inconsistencies, incessant debates, and never ending reconciliations caused by the departmental approach, so they're ready for a fresh tactic. Working with business leadership partners, rank each business process on business value and feasibility, then tackle processes with the highest impact and feasibility scores first. Although prioritization is a joint activity with the business, your underlying understanding of the organization's business processes is essential to its effectiveness and subsequent actionability.
If tasked with drafting the DW/BI system's data architecture, you need to wrap your head around the organization's processes, along with the associated master descriptive dimension data. The prime deliverable for this activity, the enterprise data warehouse bus matrix, will be fully vetted in Chapter 4. The matrix also serves as a useful tool for touting the potential benefits of a more rigorous master data management platform.
Data stewardship or governance programs should focus first on the major dimensions. Depending on the industry, the list might include date, customer, product, employee, facility, provider, student, faculty, account, and so on. Thinking about the central nouns used to describe the business translates into a list of data governance efforts to be led by subject matter experts from the business community. Establishing data governance responsibilities for these nouns is the key to eventually deploying dimensions that deliver consistency and address the business's needs for analytic filtering, grouping, and labeling. Robust dimensions translate into robust DW/BI systems.
As you can see, the fundamental motivation for dimensional modeling is front and center long before you design star schemas or OLAP cubes. Likewise, the dimensional model will remain in the forefront during the subsequent ETL system and BI application designs. Dimensional modeling concepts link the business and technical communities together as they jointly design the DW/BI deliverables. We'll elaborate on these ideas in Chapter 17: Kimball DW/BI Lifecycle Overview and Chapter 18: Dimensional Modeling Process and Tasks, but wanted to plant the seeds early so they have time to germinate.
Agile Considerations
Currently, there's significant interest within the DW/BI industry on agile development practices. At the risk of oversimplification, agile methodologies focus on manageably sized increments of work that can be completed within reasonable timeframes measured in weeks, rather than tackling a much larger scoped (and hence riskier) project with deliverables promised in months or years. Sounds good, doesn't it?
Many of the core tenets of agile methodologies align with Kimball best practices, including
- Focus on delivering business value. This has been the Kimball mantra for decades.
- Value collaboration between the development team and business stakeholders. Like the agile camp, we strongly encourage a close partnership with the business.
- Stress ongoing face-to-face communication, feedback, and prioritization with the business stakeholders.
- Adapt quickly to inevitably evolving requirements.
- Tackle development in an iterative, incremental manner.
Although this list is compelling, a common criticism of the agile approaches is the lack of planning and architecture, coupled with ongoing governance challenges. The enterprise data warehouse bus matrix is a powerful tool to address these shortcomings. The bus matrix provides a framework and master plan for agile development, plus identifies the reusable common descriptive dimensions that provide both data consistency and reduced time-to-market delivery. With the right collaborative mix of business and IT stakeholders in a room, the enterprise data warehouse bus matrix can be produced in relatively short order. Incremental development work can produce components of the framework until sufficient functionality is available and then released to the business community.
Some clients and students lament that although they want to deliver consistently defined conformed dimensions in their DW/BI environments, it's “just not feasible.” They explain that they would if they could, but with the focus on agile development techniques, it's “impossible” to take the time to get organizational agreement on conformed dimensions. We argue that conformed dimensions enable agile DW/BI development, along with agile decision making. As you flesh out the portfolio of master conformed dimensions, the development crank starts turning faster and faster. The time-to-market for a new business process data source shrinks as developers reuse existing conformed dimensions. Ultimately, new ETL development focuses almost exclusively on delivering more fact tables because the associated dimension tables are already sitting on the shelf ready to go.
Without a framework like the enterprise data warehouse bus matrix, some DW/BI teams have fallen into the trap of using agile techniques to create analytic or reporting solutions in a vacuum. In most situations, the team worked with a small set of users to extract a limited set of source data and make it available to solve their unique problems. The outcome is often a standalone data stovepipe that others can't leverage, or worse yet, delivers data that doesn't tie to the organization's other analytic information. We encourage agility, when appropriate, however building isolated data sets should be avoided. As with most things in life, moderation and balance between extremes is almost always prudent.
Summary
In this chapter we discussed the overriding goals for DW/BI systems and the fundamental concepts of dimensional modeling. The Kimball DW/BI architecture and several alternatives were compared. We closed out the chapter by identifying common misunderstandings that some still hold about dimensional modeling, despite its widespread acceptance across the industry, and challenged you to think dimensionally beyond data modeling. In the next chapter, you get a turbocharged tour of dimensional modeling patterns and techniques, and then begin putting these concepts into action in your first case study in Chapter 3.