
4. The Changing Physical Environment
Cl + O3 → ClO + O2
ClO + O3 → Cl + 2O2
These expressions, while foreign to most of us, are simple statements describing one of the most profound occurrences of our age. In basic terms of chemical reactions, together they explain the destructive relationship between chlorine and oxygen in our atmosphere. When industrial chemical particles get released into the air, they float into the stratosphere, where they are exposed to ultraviolet radiation. These ultraviolet rays then break apart the chemicals and release chlorine atoms that destroy ozone molecules. Ozone in Earth’s stratosphere serves as the planet’s protective shield from the sun’s ultraviolet radiation (UV-B and UV-C). When the ozone is depleted, more UV-B and UV-C radiation reaches the Earth’s surface. Higher levels of UV-B exposure have been conclusively demonstrated to result in greater incidences of skin cancer and cataracts in humans. A hole in the ozone above Chile is suspected of increasing skin melanomas by 56%.
Because the current and recent levels of ozone depletion represent radical deviations from past data, they appear to be an unnaturally occurring phenomenon. A preponderance of scientists has pinpointed industrial activity as a major culprit in this scenario. Is ozone depletion the dastardly deed of a diabolical scientist looking to doom the Earth and its inhabitants? Not at all. The introduction of chlorofluorocarbon (CFC) chemicals dates back to the 1920s, when General Motors Chemical Company, working jointly with DuPont Chemical, sought an alternative to ammonia-based refrigerants. Although effective as refrigerants, these substances were known to be toxic and generally unsafe when improperly contained. This called for some sort of solution that preserved the benefits of CFCs while curbing their side effects.
In the mid-1920s, noted industry research scientist Thomas Midgely, Jr. and his team devised the solution—a synthesis of dichlorodifluoromethane that came to be known as Freon, a brand introduced by DuPont. Freon, a seemingly inert gas, would become the primary refrigerant for air conditioning and refrigeration systems for decades. CFCs also found common usage as degreasing solvents and propellants, like those employed in aerosol cans and fire extinguishers. Freon was feared to be a hazard on the ground. Several cases of lead poisoning and a handful of deaths had been attributed to lead exposure at DuPont’s New Jersey production plant for tetraethyl lead (TEL). Nevertheless, CFCs’ atmospheric hazards were years away from detection. Unbeknownst to the scientists, the new compounds had lasting, negative effects on the planet well beyond their lifetimes. Believing in the inertness of the chemicals with which he worked, Midgely famously poured TEL over his hands and inhaled TEL vapors from an open bottle for a full minute in a public demonstration of its innocuous nature. Midgely later suffered multiple bouts of lead poisoning and poor health before his premature death.
The science connecting CFC use with ozone depletion began yielding conclusions in the 1970s. Early reports were considered mere measurement errors. In a landmark 1976 study, however, the influential U.S. National Academy of Sciences reported the ozone depletion hypothesis as strongly supported by the scientific community. By the 1980s, proof of an ozone hole over Antarctica emerged, and satellite imagery confirmed its presence and an alarming rate of depletion. Governments convened and started taking steps toward phasing out and, ultimately, banning CFC production and usage, first in aerosols and later in all forms.
Though CFCs were banned in most developed markets, their production continued at DuPont until 1993. It is reported that production continues in China and Brazil, with black markets perpetuating the distribution and use of the chemical in many parts of the world. However, even if the use of CFCs completely halted today, they would continue to plague the ozone. It is estimated that it takes five to seven years for a CFC molecule used on Earth to reach the stratosphere. Once there, it can last for almost a century, taking out up to 100,000 ozone molecules during that time.1
1 “Stratospheric Ozone Depletion by CFCs.” (2012). Encyclopedia of Earth.
What has replaced the role once filled by CFCs? Hydrochlorofluorocarbons (HCFCs) serve as the primary refrigerant in commercial and household uses, representing a multibillion-dollar industry in 2012. Although they are believed to be up to 98% less damaging as ozone-depletion agents, they are regarded as potent greenhouse gases (GHGs). As a result, HCFCs are now seeing phaseout provisions around the world. The United States and other developed markets are scheduled to ban HCFC production and imports by 2030, with lesser-developed countries expected to follow by 2040. Hydrofluoro-carbons (HFCs), which contain no chlorine or bromine, are now hailed as the successor to HCFCs, though they too are regarded as damaging greenhouse gases.
Such is the story of many innovations. The transitional scientific developments that solved one problem created others. In the case of environmental impact, short-term human benefit often creates long-term scars on our natural environment that imperil humanity’s future. It would be unfair to label the creators of these innovations as villains, but the perpetuation of the innovations’ use once the hazards are uncovered is less defensible. Midgely never sought to be known as having “more impact on the atmosphere than any other single organism in Earth’s history,” as environmentalist author J.R. McNeil has depicted him. But ignorance is a not an acceptable excuse, and modern organizations are increasingly held accountable for their actions and the impacts of those actions on the people and environment around us.
Supply chain management, given its broad and holistic realm of influence, is neck-deep in environmental responsibility. Our supply chains reach every aspect of business engagement and interface with the natural environment throughout the product life cycle. This includes designing products/services, supplying raw materials, transporting, conversion/production, distribution, use, and post-use collection, including recycling/remanufacturing/reuse/disposal. In light of the far-reaching effects of manmade operations on the physical environment, and the inverse effects, understanding the implications of supply chain strategies and operations is critical. Should we really be concerned that whales are getting sunburns? Certainly, we should be concerned, but several direct business implications are tied to how we use the environment and how it responds to our actions. If those who cannot remember the past are condemned to repeat it—or so the saying goes—industry cycles and tolerances for imperfections will be shorter and more strict in the future.
This chapter reviews how economic activity impacts the environment. We subsequently consider how these impacts will influence companies and the supply chains in which they operate.
The Environment and You, You and the Environment
An inescapable reality is that with economic activity comes a consumption of natural resources and the residues of that consumption. Everything we use and consume comes from the Earth. This simple observation is lost on many people. Do not be confused by terms like “synthetic,” “composite,” “alloy,” and “artificial flavors.” These terms simply refer to the blending of natural elements into combinations that in some way exceed the capabilities of the raw elements, or match the capabilities more affordably. Once extracted from the Earth, raw materials are converted into usable materials, components, and, ultimately, the products we know and love. Products might be used immediately, like perishable food items, or remain in the “usage” stage for decades, like a Boeing 737 aircraft.
One residue of consumption is the product itself after it fulfills its useful life. At what point can someone else use the product next? Does it have any resale value? Can it be refurbished, recycled, or repurposed? Otherwise, disposal in dumps and landfills is the most common fate for spent merchandise. Aside from the product, its packaging materials can undergo the same review of options. Increasingly, firms are seeking to extend the useful stage of products and their supporting materials in the life cycle and to keep them in play for successive life cycles. After the U.S. government released new emission standards in 2004, Ford expanded its “Recycle Your Ride” program to include models from 1995 to 2003. This program awards customers up to $2,300 in credit toward a new vehicle if they turned in their old one for recycling purposes—not a bad deal for cars that could be as much as 17 years old.2 Apple’s MacBook Pro laptop line can sustain nearly 1,000 charges, keeping the product in its useful stage of life for a considerable time. However, when a user exhausts the battery, it can be submitted to Apple for recycling. In return, the customer receives a gift card for the laptop’s residual value.3
2 Recycle Your Ride Program. (24 June 2009). Ford Motor Company.
3 “Get an Apple Gift Card for your old device.” (2012). Apple.com.
Sadly, the residuals of economic activity do not begin and end with spent materials that are too often destined for landfills. Pollution of the air, water, and ground accompanies most sourcing, manufacturing, and logistics activity. The opening to this chapter addressed the emission of CFCs, which once spewed egregiously into the air and, eventually, the atmosphere. The primary culprits of air pollution are the burning of fossil fuels and coal, both of which serve as sources of greenhouse gases yet remain essential ingredients in today’s industrial activity. Combustion engines running on fossil fuels are responsible for emitting carbon dioxide, particulate matter, and often an array of other pollutants, including sulfur dioxide, nitrogen oxides, and carbon monoxide. Greenhouse gases trap heat on the Earth’s surface and lower temperatures in the troposphere. Even though many developed nations around the world have instituted pollution controls, such as the U.S. Clean Air Act and the EU’s Air Quality Directive, the integrity of our air continues to be compromised. The American Lung Association finds that more than half of the U.S. population resides in areas with unsafe levels of smog and particulate pollution. It is estimated that 80% to 90% of Europe’s urban population is subjected to particulate matter (PM10) that exceeds World Health Organization (WHO) guidelines.4
4 Air Quality in Europe, 2011 report.
The problem is much worse in China, where air quality enforcement is lax. It is estimated that only 1% of China’s urban population enjoys “safe air” by modern standards, with pollution in Beijing rated as 16 times worse than that in New York City. The WHO reports that the airborne particulate levels in the industrial north of China are 20 times greater than its guidelines for acceptable air quality. Some areas have pollution so dense that the cities cannot be seen by satellite. Should the Chinese government elect to take stringent action on air pollution, however, the tide could turn immediately.5 Such dramatic changes in policy can occur rapidly if global pressure redirects central planning from growth to sustainment. Figure 4.1 illustrates the harmful particulate matter (PM) present across different world regions. Harmful particulate matter is a result of factory, power plant, and automobile emissions and can create health problems if inhaled in large quantities. According to Figure 4.1, China’s east coast has the highest concentration of harmful PMs.
5 Hays, Jeffrey. (2008). “Air Pollution in China.” Facts and Details.com.

Figure 4.1. Harmful particulate matter concentrations6
6 Voiland, Adam. (22 September 2010). “New Map Offers a Global View of Health-Sapping Air Pollution.” NASA.gov.
Given our dependence on fossil fuels and the accelerated pace of economic activity in developing regions, the degradation of air quality is expected to worsen before it improves. The WHO estimates that 2.4 million people die each year from air pollution. The Organization for Economic Cooperation and Development (OECD) predicts that poor air quality in the world’s cities will lead to 3.6 million premature deaths per year by 2050. Air pollution also contributes to climate change. Figure 4.2 shows how climate change will heat up the United States in the coming decades.7
7 Youngman, Betsy, Mark Chandler, Linda Sohl, Mark Hafen, Tamara Ledley, Steve Ackerman, and Steve Kluge. (January 2010). “Envisioning Climate Change Using a Global Climate Model.” Science Education Resource Center (SERC) at Carleton College.

Figure 4.2. Climate change
Though alarming, this number of premature deaths from air pollution pales in comparison to the death rate associated with scarce and unsafe water today. Many world regions face significant potable water shortages, and more than 5 million people die each year from waterborne diseases. As shown in Figure 4.3, in 2010 significant portions of North and South America, as well as eastern Africa and northwest and southeast Asia, faced severe water shortages. The lower pane of the figure extrapolates these shortages based on the climate change trends shown in Figure 4.2. The result is quite serious: Many nations will be looking to import potable water in the next 20 or so years, and few areas will have surplus to offer. Additionally, as shown in Figure 4.4, much of the available supply is currently or will be contaminated. The United Nations Environment Program points out that currently, a child under the age of 5 dies every 20 seconds from water pollution-related disease. The problem is greatest in the cities of underdeveloped regions, where sewage and wastewater contaminate the potable supply. Again, recalling the maps shown in Chapter 2, “Global Population Growth and Migration,” the areas with the greatest growth and lowest GDP are also those with the poorest water supply and quality. Interestingly, as discussed in Chapter 5, “Geopolitical and Social Systems Disruptions,” these are also the same areas where the greatest natural resource stocks remain, so they will become the next frontier of global competition.
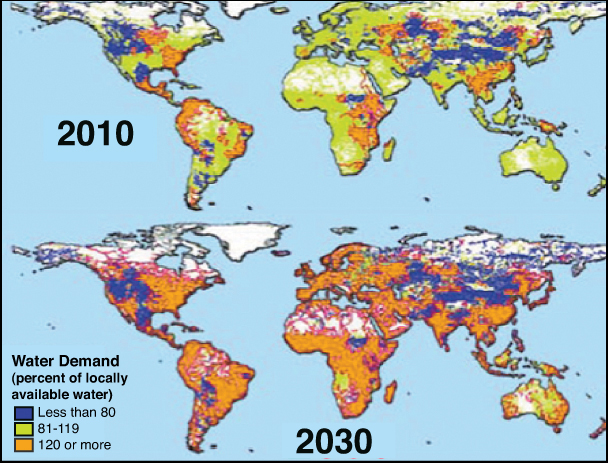
Figure 4.3. Future water supply degradation

Figure 4.4. World regional lack of access to safe drinking water, 2012
Figure 4.4 shows the percentage of each country’s population that does not have access to safe drinking water.8 The water shortage is greatest in Africa. For a potable water supply that faces imbalances in supply and demand, the OECD estimates that demand will increase by more than 50% by 2050 and that as much as 40% of the world’s population will live in areas of severe water stress. These instances show that natural resource scarcity isn’t just attributed to overuse and overproduction; pollution is also a major part of the problem. These problems will contribute to both future supply chain disruptions and resource security issues.
8 “Human Development Report 2004.” (2004). United Nations Development Program (UNDP). Tables 7 and 33.
We find these air and water pollution statistics particularly alarming because they relate to everyday occurrences, as opposed to the less frequent “disasters” that claim news headlines. In 1989, the 300-meter-long oil tanker Exxon Valdez ran aground in Prince William Sound off the coast of Alaska. The accident spread between 25 million and 32 million gallons of oil over 11,000 square miles and 1,300 miles of coastline. The accident also generated worldwide attention and resulted in more than 38,000 litigants and immeasurable damage to the region’s ecosystem, which remains impaired today. This disaster was superseded by the BP Deepwater Horizon oil spill of 2010 in the Gulf of Mexico. It was perhaps the first such disaster that ordinary people could watch unfold over the course of its three-month duration in real time on their personal computers and handheld devices. A U.S. White House commission report blamed BP and its partners for making cost-cutting decisions that led to the blowout. The commission also indicated that unless significant reform in industry practices occurred, a similar incident might occur again elsewhere.
Less visible to the naked eye, but growing in size and awareness, is what has become known as the “Great Pacific Garbage Patch.” It consists of plastics, chemical sludge, and other debris that is trapped by the current of the North Pacific between the U.S. West Coast and Japan. Since the patch is not visible from the sky or in images taken from space, its size is impossible to estimate with any accuracy. Estimates range from 700,000 square kilometers to more than 15 million square kilometers (or 270,000 square miles to 5.8 million square miles). The latter estimate would represent just over 8% of the Pacific Ocean’s area, or double the size of the continental U.S. The sources of the garbage are believed to be both land-based and shipping vessels. Cruise ships are often targeted as a primary source of such waste, because a large ship carrying 3,000 passengers generates 8 tons of solid waste per week.9 But industry practices fueled by an outraged public have led to better alternatives than ocean dumping.
9 Bluewater Network, 2000.
Scientists believe that garbage patches of similar composition exist in most of the world’s oceans. Though they may be out of sight, they do not leave us out of harm’s way. The most direct impacts are felt by marine life, which can ingest the long-lasting plastics. These often contain organic pollutants like polychlorinated biphenyl (PCBs), dichlorodiphenyltrichloroethane (DDT), and polycyclic aromatic hydrocarbons (PAHs). The food chain is then affected when species like jellyfish consume these toxins and then are eaten by larger fish. The impact on humans, while difficult to measure, cannot be dismissed.
Back on terra firma, soil contamination from a variety of sources impairs our ability to live off the land. Indiscriminate use of pesticides, solvents, and other heavy metals; corrosion of underground storage tanks; the dumping of oil, fuel, and industrial waste; and surface water contamination contribute to soil infertility and the contamination of precious water aquifers. Soil contaminants can also vaporize, introducing carcinogens into the air. These hazards are correlated strongly with the level of industrialization and the intensity of chemical usage. One estimate suggests that 10% of China’s cultivatable land is unsafe for agricultural purposes, with much of this land in economically developed areas.10
10 Qi, Xu. (29 January 2007). “Facing Up to ‘Invisible Pollution.’” ChinaDialogue.net.
In total, manmade activity impacts our natural environment considerably. The various pollutions are sometimes seen and directly affect our daily existence. In other cases, they take years or decades to reach us in some substantive way. They all relate to the economic pursuit of trade, with many implications tied to our patterns of usage and consumption. With the emergence of an ever-growing class of global consumers, the taxes placed on the Earth will increase. The chains that supply, produce, and deliver the goods demanded by the world’s consumers will have to incorporate a life cycle perspective, assuming accountability for the direct and indirect impacts of the products and services they market. The next section addresses the forces that shape a company’s environmental posture—its position on environmental stewardship.
Environmental Pressures on Supply Chains
Four broad forces affect a company’s environmental posture: customer demand, supply, the public, and governments and their policies, as shown in Figure 4.5. The following sections describe each force and explain their implications for supply chain management.
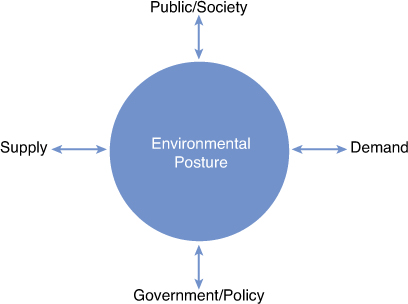
Figure 4.5. Drivers and consequences of environmental posture
Customer Demand
Customers should be the first source of inspiration for environmental action in our supply chains. Providing products and services that fulfill customers’ environmental expectations has top-line implications—an opportunity to grow the business. Increasingly, companies are embracing a “green” imperative brought forward by business customers and consumers. Prominent efforts have been made by such heavyweights as Starbucks, Walmart, Hewlett-Packard, Ford, and IBM. Walmart has set far-reaching environmental goals to be supplied completely by renewable energy, create zero waste, and sell products that sustain people and the environment. Currently Walmart is falling far short on most of these goals. (It is closest on the second item, with reportedly 80% of the company’s waste staying out of landfills.) However, the setting of such ambitious goals is not intended to only serve a corporate responsibility agenda, but also to serve as good business. CEO Mike Duke was quoted in 2012 as saying, “We’ve done all this (sustainability initiatives) because it is the right thing to do for the generations that will follow us. But sustainability is also the right thing to do for our business.”11
11 Walmart’s Global Sustainability Milestone Meeting, 18 April 2012.
Supply Capability
Supply capability refers to the company’s ability to meet customer demand through both internal and external sources. The environmental impact of supply operations is something that no company can avoid. Even the most innocuous of operations will impact the natural environment. The supplier relationship management (SRM) process seeks to form appropriate relations with suppliers so that the needs of both the buying and selling party are met through the trading relationship. Similar to CRM, segmentation is essential for customizing the relationship, as needed, to ensure that balance among inputs and outputs is found in the arrangement. It is impossible for large firms managing a multitude of business relationships to manage all partners as “choice.” Therefore, selectivity is required to determine how many resources should be directed to distinct suppliers or groups of similarly valuable suppliers.
When determining whether to “make” or “buy” manufactured items in the supply chain, companies often measure the transaction costs associated with outsourcing. Transaction costs are associated with managing an outside company to act as an agent of the focal firm, to align its interest with yours. When opportunity presents itself in the form of an outside party and is regarded as an irreversible threat, the focal company will feel inclined to “make” (insource) the item. When transaction costs are low, however, the company elects to outsource. Companies seeking to shift the burden of environmental stewardship to other supply chain partners soon realize that this strategy offers little refuge. The practice of outsourcing (and, often, offshoring) operations does not present a buffer. Think back to when talk-show host Kathie Lee Gifford’s clothing line became associated with sweatshop labor conditions in Honduras in the mid-1990s. Just as apparel makers could not run away from poor labor conditions, manufacturers and retailers cannot escape responsibility for environmental stewardship in the supply chain—particularly when their brand is on the product label. Critics claim that manufacturers in developed regions are outsourcing not only their production operations to China, but their pollution as well. With this in mind, companies are trying to ensure that life cycle impacts are minimized.
As we will elaborate later, natural resource scarcity and the natural environment are intimately entwined. The preface to this book explores the case study of Coca-Cola in the Indian market, along with the ensuing “water wars” that followed among the soft drink giant and the communities housing the bottling operations. But not all scarcity issues are so well documented. We return to water for one of the more pronounced scarcity problems. We’ve all heard that “there are plenty of fish in the sea,” but that’s not the case anymore. Shark and bluefin tuna populations are disappearing at an alarming rate due to overfishing. Their populations are 80% to 90% lower than in 1970. At current depletion rates, there is expected to be only 10 to 12 years’ supply of bluefin, and fewer than 30 years of orange roughy, another popular entrée item. Both species are slow to mature but are in great demand. Also, the “efficiency of seafood” (in terms of a measure called “feed conversion ratio”) is challenged, because large quantities of feed are required to achieve relatively little yield. This is particularly troublesome when you consider how Asia’s rapidly growing economies rely on seafood as a primary source of protein. Farm-raised species like catfish, tilapia, and carp are looked toward as more sustainable options.
The upsides of environmental stewardship in supply include the harvesting of innovation and leveraging sustainability as a motivating force for continuous improvement. As for innovation, suppliers are increasingly considered rich sources of new-product ideas and process breakthroughs. Former Procter & Gamble CEO A.G. Lafley famously set the company’s objective to attain more than 50% of its marketable innovations from outside the company. This was despite the fact that P&G employs more than 9,300 researchers and spends $2 billion each year on internal R&D. Despite these immense resources, it was believed that casting the net more widely to existing and prospective suppliers could yield more and diverse ideas.
Companies are looking to continuously improve their supply chain operations, often in ways that reduce environmental impact. The implementation of strategies geared toward making the business lean, green, and sustainable is gaining rapid adoption. Lean practices seek to reduce muda, the Japanese term for waste. The muda reduced through lean practices includes the following areas:
• Inventory
• Motion
• Waiting
• Overprocessing
• Overproduction
• Defects
• Untapped knowledge and creativity
Reducing these wastes reduces environmental impact and costs. Effectively implementing the manufacturing flow management (MFM) and order fulfillment (OF) processes creates lean results in the sourcing, production, and delivery of goods. The company processes only the goods that customers demand, when they are demanded.
Public/Social Impacts
The perspectives of outside stakeholders are commonly integrated into today’s business decisions. These stakeholders can be citizens living in the communities in which the company operates, the families and friends of employees, nongovernmental organizations (NGOs), and a host of other nonaffiliated parties who have an interest in the company’s actions. Conventional business practice was to draw as little attention from these outside parties as possible. Nothing good could come from such meddling. As noted in the discussion of supply, if your brand is associated with the final product, society will hold you accountable for the actions of your suppliers, as they relate to the environment or any other social ill. Avoiding newspaper headlines was the goal.
Fast-forward to the present. Newspapers, while still serving as an important “beacon of truth,” are too slow in reporting news and are losing readership, especially among “millennials,” who find flipping through pages tedious. Rather, online reports and social media dominate. Social media has no editors, censors, or buffers. Grassroots movements on Facebook and Twitter are the latest worries that keep corporate executives up at night. While they try to slumber, groundswells can mobilize overnight from person to person in ways that were unimaginable until the mid-2000s. Consider that even though Coca-Cola consistently has one of Facebook’s most popular fan pages, the company does not maintain the site or control the content or comments posted. With more than 900 million Facebook users worldwide, anticorporate campaigns go viral around the world quickly and at no expense. Increasingly, customers are filing complaints on companies’ Facebook pages. If the companies fail to respond (as often happens), this reflects poorly on the offending company, and exodus follows. Cadbury faced a tsunami of opposition to its use of palm oil in its chocolate candies in Australia and New Zealand in 2009. Palm oil supply had been linked to deforestation and the loss of orangutan habitats in Southeast Asia.12 Volkswagen UK posted a seemingly innocuous message on its Facebook fan page on January 1, 2012, asking fans what they would like to see from the company as a New Year’s resolution. Greenpeace UK organized a concentrated response that yielded hundreds of pro-environmental postings. These examples speak to the changing landscape in customer service management, the supply chain process responsible for anticipating customer issues and addressing them. Manning a toll-free phone line is no longer sufficient to stem a tide of customer complaints and reverse customer sentiments.
12 Fitzsimmons, Caitlin. (21 August 2009). “Cadbury bows to people power, drops palm oil.” Ecosalon.com.
Smarter companies are learning not to run away from social media and the wrath of customers, but to embrace the medium. U.S. grocery retailer Safeway tries to respond to every customer complaint posted to its Facebook page, some of which exhibit an environmental interest. Rail company CSX embraced the “Earth Month” of April in 2012 by launching a Facebook page called “Environmental Pursuit” to test fans’ “green IQs” and stress the company’s pro-environmental messaging.
Environmental Regulatory Considerations
When all else fails, the final source of inspiration for environmental action is government mandate and regulations. This “reactive” posture rarely leads to growth in the top or bottom line. Furthermore, waiting for rules to be imposed spawns little inspiration for innovation through improved means of serving customers and/or enhanced cost competitiveness through environmental stewardship.
Though companies often struggle to quantify the value of pro-environmental action in terms of customer impact or internal cost savings, they sometimes strive to advance the state of the art in an effort to differentiate themselves. This is particularly true in product and service areas that are commonly viewed as commoditized, or industries where competition is largely driven by price. Chemical giant Dow demonstrates commitment to sustainability that greatly exceeds government mandates. Still others may seek to advance environmental action as a way to precede impending legislation and perhaps influence the rules, essentially creating the standards to which their peers must adhere.
Even though no single supply chain process is dedicated to ensuring adherence to the full array of government policies, actions tied to all eight of the key business processes carry implications for proving that the company is an upstanding, law-abiding corporate citizen. The reality is that the days of wreaking havoc on the environment, dumping, and running are over in most developed regions of the world. Someone is always watching, and the price of violating environmental laws, industry standards, and public expectations continues to escalate. Integrity throughout the implementation of the supply chain processes is the norm, because ignorance is no longer an acceptable excuse.
Environmental Challenges for Future Supply Chain Managers
Changes to the physical environment are threatening to knock out of balance many of the world’s ecosystems, including the global commercial ecosystem. These changes are trickling down to the industry and firm levels of operation, where supply chains are beginning to struggle to achieve balance in supply and demand. The following are key issues related to the physical environment that should be considered within supply chain strategy and planning efforts in the coming years:
• Greater accountability in companies’ environmental performance among all stakeholders, including customers, end users, regulators, suppliers, communities, and even shareholders
• Market opportunities for innovative companies that can devise products and services that perform as well as or better than competitors’ offerings, with reduced environmental impact
• Harsh and lasting negative responses when companies fail to live up to their environmental obligations under the scrutiny of the market and regulators
• Advantages that will stem from early adoption of alternative fuels and technologies, which will reduce environmental impact and/or comply early on with anticipated regulations
The challenges associated with physical environmental change are numerous and have the potential to greatly affect each of the eight GSCF supply chain processes in the coming years. Future supply chain managers are advised to consider the ramifications of environmental change on supply chain management to better integrate demand with supply. Table 4.1 matches each process to its environmental implications.
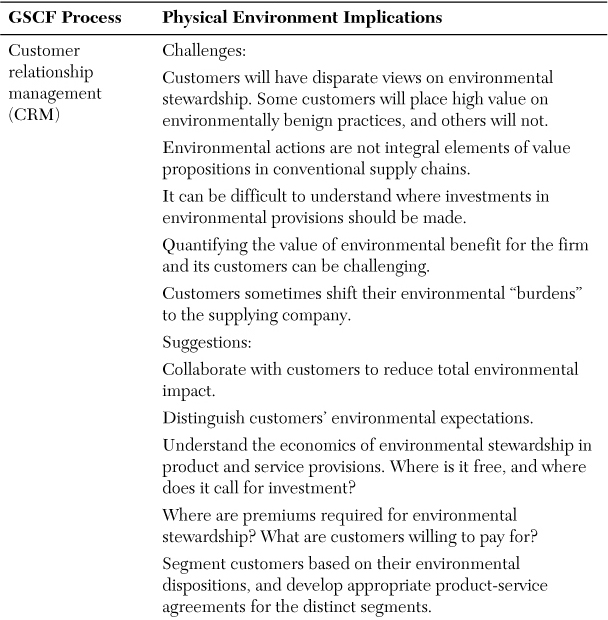

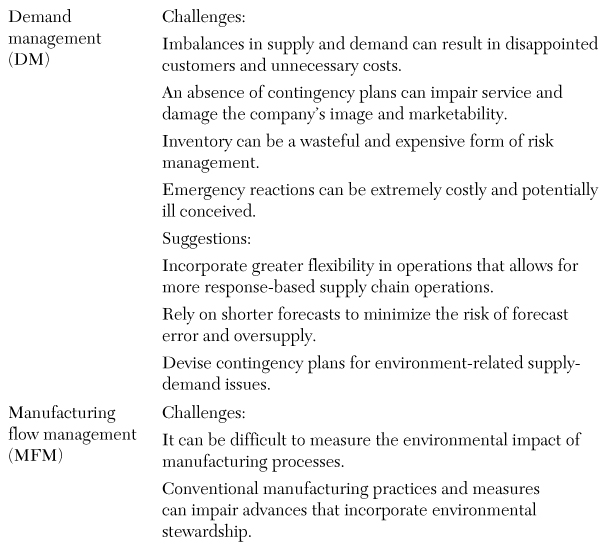

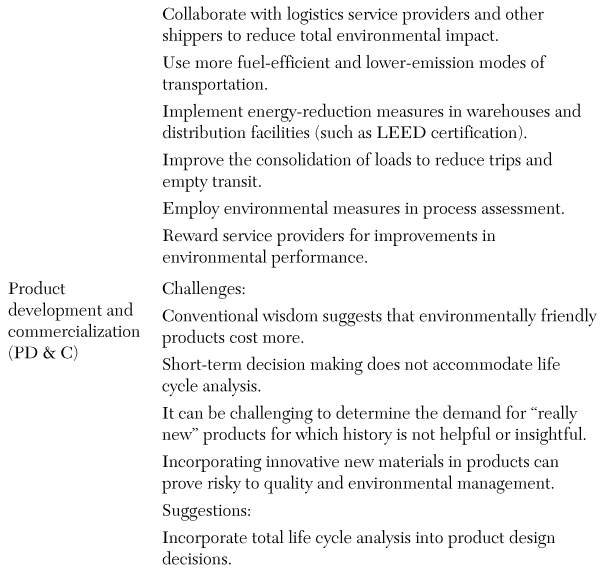

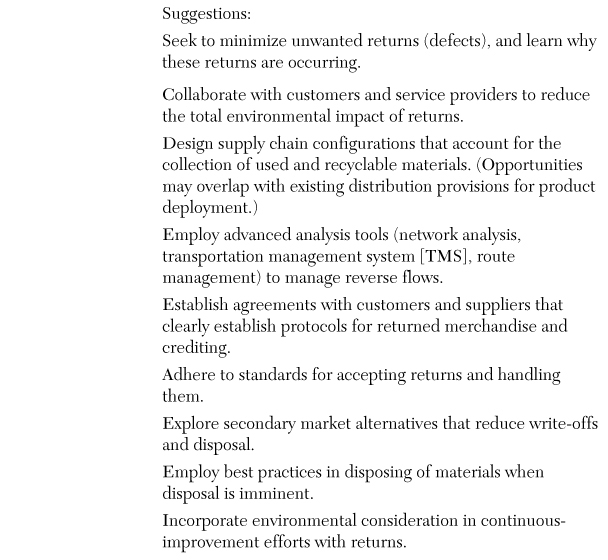
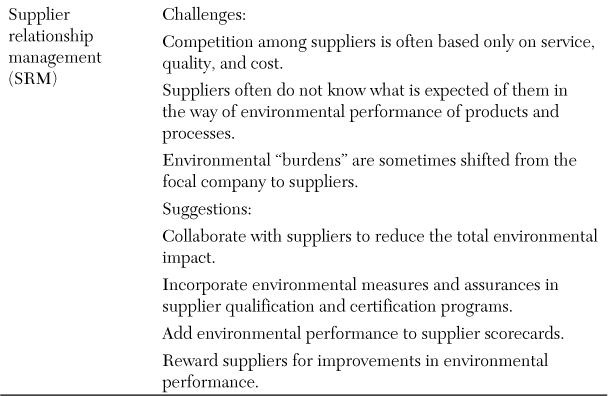
Table 4.1. Physical Environment Implications for SCM
Environmental issues affect each of the eight supply chain processes significantly. We’ll begin by discussing the impacts on customer relationship management, which is focused on forming effective, profitable relationships with customers. Segmentation of the market is an essential step toward forming relationships that meet the needs of distinct customers while ensuring profitability for the company. An important realization is that not all customers of the future will view environmental stewardship as a primary concern relative to matters of product performance, delivery assurance, and price. One major consumer goods company currently distinguishes “greenies” (those who favor environmentally friendly products) from “nevergreens” (consumers who are opposed or even hostile to environmental messaging). We expect these trends to continue for the next couple of decades, until and if the recognition of the global climate crisis becomes imperative. As indicated earlier, customers can be an instrumental force in directing companies to more environmentally benign products and processes.
Once customer segments are defined, the company must devise value propositions that resonate with the distinct segments. Assessing customer opinion and ensuring relevance to distinct segments is essential to drawing up relationships that serve the needs of buyers and suppliers. A caveat to anyone considering green messaging toward customers is to bring it forward with sincerity and integrity. “Greenwashing,” disingenuous concern for the environment associated with a featured product or service, can (irreparably) impact a company or an entire industry.
Where customers are not properly informed about the environmental risks they will face, the supplying company needs to provide this expertise. While suppliers will be expected more than ever to have expert knowledge of the materials and products they provide to customers, imparting the complete array of risks that customers might face in using the product is an activity at which many firms would balk. However, there is potential for the supplying firm to serve as a consultant on matters of environmental risks—to fully inform customers of potential risks and even to anticipate possible consequences. Incorporating failure modes and effects analysis (FMEA), a common tool used in continuous improvement, into customer service arrangements helps illuminate events that could pose harm and challenges to the customer company.
In addition to anticipating potential environmental challenges, suppliers can implement environmental stewardship in their assessments of customer service performance. Did the firm maintain a proactive posture to events? When events occurred, were they remedied to the customer’s satisfaction and in an acceptable time frame? Furthermore, what can be gleaned from the situation to prepare better for future occurrences? These questions are commonly asked in the customer service management process, but they are rarely applied specifically to matters of environmental concern.
Demand management finds itself at the heart of balancing supply and demand within and across companies. When supply exceeds demand, a company finds itself with excess inventory, which is a problem in itself. From an environmental perspective, however, the excess inventory is but one form of waste embodied in the imbalance. Materials were wasted in generating the excess inventory. Energy was also consumed in extracting, processing, and transporting the materials. Emissions were generated in these activities as well. Therefore, the pallet of unwanted merchandise represents just one manifestation of the supply-demand imbalance.
To better maintain balance—and to make it easier to achieve the balance—companies will be forced to underscore flexibility in their operations so that they can rely less on speculative forecasts and more on actual demand. Some managers use the term “endcasting” to refer to the use of actual demand to drive supply chain execution, as opposed to the use of long-term forecasts that are highly speculative.
To accommodate customer demand in a responsive manner, manufacturing flexibility is key. The manufacturing flow management process determines just how much flexibility is warranted to meet customer demand and the company’s return on investment. When flexibility is free, companies should embrace every last bit of it. However, when a premium is required to enhance flexibility (such as by cross-training employees or acquiring new equipment or information technology), you must determine how much and what forms of flexibility need to be embraced. This determination is not static, however, and requires continuous review.
The order fulfillment process results in particularly high environmental costs, especially in light of the energy consumption and emission generation found in transportation. Transportation in the U.S. alone consumed nearly 14 million barrels of oil per day in 2007.13 In the late 1990s, transportation in the U.S. exceeded manufacturing activity as the leading contributor to greenhouse gas emissions, exceeding 2 billion metric tons of carbon dioxide emissions in 2007. Warehouse operations of the future will also be a leading source of energy consumption and emission generation, leading many companies to consolidate their logistics networks and reduce the impact of each individual facility.
13 Bureau of Transportation Statistics. (2012). Pocket Guide to Transportation. Also U.S. Department of Energy, Energy Information Administration.
Although collaborations among suppliers and customers are fairly common in pursuit of lean-ness, recent developments illustrate a new dimension of collaboration in the supply chain—horizontal collaboration among competitors. As noted in the discussion of strategies to avert traffic congestion in Chapter 9, competitors are sharing trucks and warehouse space to serve common customers. Sharing capacities means that fewer half-empty trucks and warehouses are employed, removing redundancy and waste from the companies’ operations. Europe, with its more progressive stance toward the environment and higher fuel costs, is seeing higher levels of collaboration. In one such example, JSP and Hammerwerk are co-bundling loads shipped from the Czech Republic to Germany, with reported transport cost savings of 10% and carbon dioxide reductions of 30%. Companies like Kimberly-Clark and Colgate-Palmolive are paving the way for similar collaborations in the United States. More collaborative practices among competitors are expected in the future, particularly with fuel price increases.
Determining whether a new product or service would meet customers’ environmental interests and fulfill the company’s business needs is the work of the product development and commercialization process. PD&C receives the customer input of the CRM process as well as the capabilities of internal departments and external supplies to assess the viability of new offerings. For most companies, new offerings and new markets represent the best opportunities for growth. For companies seeking relevance among youth, upper-income, and more highly educated market segments, the pressure is greatest to devise environmentally friendly products. These market segments tend to identify most closely with environmental messaging and seek out these products and services.
Increasingly, companies are examining the total life cycle of the products they produce and distribute. Life cycle analysis factors in the environmental impact of all activities, from raw-material extraction, through manufacturing and distribution of goods and services, to use and even post-use stages, including collection, remanufacturing, recycling, or disposal. Measurements like total cost of ownership (TCO) are also employed as a way to encourage holistic management of materials beyond their initial use.
An effective returns management process is required to efficiently collect used and recyclable materials for subsequent life cycles. Unfortunately, the economics of future material flows will be highly inconsistent with those found in the forward deployment of product. Whereas full pallet-loads of homogenous (similar) products are distributed in the forward channel, the reverse channel consists of odds and ends that are usually poorly contained and lack the original packaging. This will increase as customer segments diversify around the globe. Handling and transport of returned goods will be significantly more challenging. Adding to the challenge will be the lack of visibility and the inability to predict “demand” for returns.
For these reasons, returns flows will be harder than ever to integrate with forward flows and often will simply be ignored by management. They can represent significant costs, however, with returns reaching as high as 40% of sales for some goods, particularly those sold online. Furthermore, returns provide closure to one life cycle and the requirement for subsequent cycles. Strategic thinking therefore is required to manage returns. Given their strategic importance, wholly separate channels are often devised for returned goods. Specialized service providers are often called on to support the collection and flow of returned goods. One such third-party logistics provider (3PL), Genco ATC, has devised its business model on the premise of “product life cycle logistics,” providing focused support for reverse logistics.
Reduced environmental impact in products and services often calls for the input and involvement of outside parties in the supply chain. Customers are one such source of innovation, and so are suppliers, university researchers, research firms, and consultants. The supplier relationship management process seeks to identify the suppliers that possess the greatest potential to innovate. Suppliers demonstrating the most promise for new and valuable developments in products and processes are those that receive the best prices, terms of trade, and other forms of relationship nurturing.
Segmentation of suppliers will be virtually mandatory to identify suppliers that pose the greatest environmental hazards through the materials they provide or by virtue of the operations they perform. These suppliers require the greatest scrutiny on environmental performance. Provisions such as supplier screening, qualification, and certification might be required to ensure environmental safety and integrity. Increasingly, supplier scorecards will need enough granularity to convey the importance of supplier compliance and performance in light of agreed-upon standards and should lend opportunities for environmental innovation.
Our purpose in this chapter is not to encourage tree hugging, unless you are already so inclined. Instead, we want to help establish the intertwined linkages between supply chain activity and the future environment on which it depends. Virtually every action we take has some impact on the natural environment in which we live and on which future generations depend. Meeting the needs of the present without impairing future generations’ ability to meet their needs calls for immense creativity and problem-solving ability. To those engaged in such endeavors, however, it is fun and rewarding. And with such consideration and action, we could all breathe a little easier.