
7. World-Class Demand Forecasting
The efforts to understand what constitutes world-class performance in demand forecasting began, for members of the University of Tennessee research team, back in 1984 when none of the researchers involved was even a member of the University of Tennessee faculty! It was in 1984 that my colleague, Tom Mentzer, then a professor at Virginia Tech University, began his series of published papers that documented the state of forecasting practice in industry, which became known as “the Benchmark Studies.” The first two papers were published in the Journal of Forecasting, and they documented two large-scale survey efforts that took place ten years apart, the purpose of which was to take a snapshot of current practice in forecasting. The first study was labeled “Phase 1” and was published in 1984.1 The authors surveyed 157 companies, and documented the extent to which various forecasting techniques, both statistical and qualitative, were being utilized in practice. Now nearly 30 years old, this article reflected the focus of forecasting research at that time: namely, techniques. Most forecasting research was centered on statistical matters—devising and testing various statistical algorithms for modeling various types of demand patterns. Ten years later, a second study was undertaken, labeled as Phase 2, and published in 1995.2 To a large degree, the Phase 2 study replicated the methodology of the Phase 1 study, with a major exception. Reflecting the changing realization that forecasting excellence is much more than the selection of the right statistical algorithm, Mentzer and his colleagues also collected data from another large group of survey respondents—208 in this case—on the management approaches and systems implementations that they were using. Interestingly, even though more than 10 years had passed between the first and second studies in this series, the findings showed that in spite of advances in statistical sophistication, management focus, and computer system assistance, overall forecasting performance had not, on average, improved much at all!
1 Mentzer, John T. and James E. Cox, Jr. (1984), “Familiarity, Application, and Performance of Sales Forecasting Techniques,” Journal of Forecasting, 3, 27–36.
2 Mentzer, John T. and Kenneth B. Kahn (1995), “Forecasting Technique Familiarity, Satisfaction, Usage, and Application,” Journal of Forecasting, 14 (No. 5), 465–476.
This surprising finding led Mentzer and his team to embark upon a qualitative effort to understand the state of forecasting in industry. In Phase 3, the team selected 20 companies from a variety of industries and across various levels of their supply chains,3 and then conducted in-depth face-to-face interviews with a broad spectrum of individuals from those firms who were involved with forecasting. Individuals from forecasting functions, as well as those who provided input to forecasts (such as sales and marketing) and those who were the “customers” of forecasts (such as manufacturing, production planning, procurement, and finance) were interviewed. The results of this effort were published in Business Horizons,4 and this research brought tremendous clarity to the many of the unanswered questions from the first two phases of the Benchmark Studies.
3 The 20 companies that participated in the third phase of the benchmark studies were Anheuser-Busch, Becton-Dickinson, Coca-Cola, Colgate Palmolive, Federal Express, Kimberly-Clark, Lykes Pasco, Nabisco, J.C. Penney, Pillsbury, Pro-Source, Reckitt Colman, Red Lobster, RJR Tobacco, Sandoz, Schering Plough, Sysco, Tropicana, Warner Lambert, and Westwood Squibb.
4 Mentzer, John T., Carol C. Bienstock, and Kenneth B. Kahn (1999), “Benchmarking Sales Forecasting Management,” Business Horizons, (May–June), 48–56.
By this point, Mentzer had moved to the University of Tennessee, and beginning in 1996, I became part of the research team. It was at that point that I began to use many of the insights gained in Phases 1–3 of the Benchmark Studies to begin working directly with companies, conducting what we called forecasting audits. Fast-forward 16 years to the time of this writing, and our team has now completed 43 audits for companies around the world, from manufacturers to retailers, from consumer packaged goods companies to heavy industry companies.5 The methodology for conducting a forecasting audit has been well documented in the academic literature,6 and those readers who are interested in that methodology should consult the International Journal of Forecasting article cited in the footnote. This chapter focuses on the results of those audits, and the insights that we have gained about what constitutes world-class practice in demand forecasting and demand/supply integration.
5 As of this writing (September 2012), the following 42 companies have participated in the audit research, for whom 43 audits have been completed: Eastman Chemical Corporation, DuPont of Canada, Hershey Foods USA, Michelin, Allied Signal Automotive, Exxon, Union Pacific Railroad, Lucent Technologies, ConAgra, Smith & Nephew, Ethicon, Avery Denison, Corning, Pharmavite, Motorola PCS, Williamson-Dickie Manufacturing Co., Sara Lee (Intimate Apparel Division), John Deere, Continental Tire, AET Films, Whirlpool, Michelin (re-audit), Philips North America, Bacardi, Orbit Irrigation Products, Amway, Maxtor, OfficeMax, Lockheed-Martin, Nissan, Peerless Pump, Estee Lauder, Johnson & Johnson (Vistakon division), Radio Systems Corporation, Cooper Tire, Cummins Filtration, Cintas, Tyco Electronics (Wireless Network Solutions), Wal-Mart, Winn Dixie, Mohawk Industries, Boise, Walgreens.
6 Moon, Mark A., John T. Mentzer, and Carlo D. Smith (2003), “Conducting a Sales Forecasting Audit,” International Journal of Forecasting, 19 (No. 1), 5–25.
Initially, the focus of the Benchmark Studies was forecasting. However, because the purpose of the ongoing research effort, as manifested in the audits, was to keep our team up to date on best practice in the field, we began to change our perspective. Over time, it became clear that a good forecast, without a good process to use that forecast to make good business decisions, was quite useless. As our team worked with the dozens of companies that participated in the research, we came to realize that our thinking needed to expand beyond documenting world-class practice in forecasting, and encompass world-class practice in demand/supply integration as well. The result of this nearly 40 years of research, then, is a constantly evolving vision of what constitutes world-class practice in both demand forecasting and demand/supply integration. This chapter articulates that vision.
The sections that follow use the framework first articulated in the Mentzer, Bienstock, and Kahn Business Horizons article, and which was then expanded upon in the Moon, Mentzer, and Smith International Journal of Forecasting article, cited previously. In this framework, four dimensions of forecasting practice are described: functional integration, approach, systems, and performance measurement. Along each of these four dimensions, four “stages of sophistication” are articulated, ranging from Stage 1 to Stage 4. Stage 4 represents our vision of what constitutes being “World Class.” In the discussion that follows, the reader is encouraged to “grade” your own organization, and see whether you can recognize which stage of sophistication you fall into. This framework was designed to be used as a diagnostic tool, and should help you to determine which area is in most need of attention. Get out your highlighter, and make note of where your company stands relative to our vision of being World Class. Don’t be discouraged if you don’t find yourself highlighting many Stage 4 characteristics. Of the 43 audits our research team has conducted over the past 16 years, we have yet to find a company that has Stage 4 characteristics in all four dimensions. Every company has opportunities for growth in some area of forecasting management. This framework is designed to help you see where your company should assign priorities in your journey toward becoming World Class.
This chapter also describes how the four dimensions of forecasting relate to the three necessary elements for DSI excellence, described in Chapter 1, “Demand/Supply Integration”: culture, process, and tools. As I show, functional integration is all about culture; approach is all about process, systems is all about tools, and performance measurement is the use of tools to measure processes, which influences culture.
Functional Integration
The first dimension of demand forecasting is functional integration. This dimension gets at the question of “How successful is a company at getting information from those who have it to those who need it, in support of the forecasting and demand/supply integration efforts of the firm?” As noted earlier, functional integration is the dimension that truly describes the culture of the firm, specifically, the extent to which transparency, collaboration, and commitment exists for organization-wide goals. Table 7-1 summarizes the functional integration dimension, and the sections that follow describe the five themes found in it in detail.

Table 7-1. Functional Integration
DSI Processes
The first theme in functional integration is the extent to which the organization has successfully designed and implemented a DSI process. I do not repeat all the points that were discussed in Chapter 1 here, but rather encourage the reader to go back and make sure to note the important points from it. Briefly, however, I do make some observations about what constitutes a Stage 1, 2, 3, or 4 level company in terms of DSI processes. Stage 1 companies have no formal DSI process in place. In these companies, no formal forum is established that allows the demand and supply sides of the enterprise to meet and discuss their common issues and constraints. Often in Stage 1 companies, a forecast is prepared, “tossed over the transom” to the supply chain users, and no discussion takes place. In Stage 2 companies, a formal DSI process has often been defined, but execution of that defined process has either not yet reached maturity, or has “fizzled out” due to lack of appropriate change management. The most obvious deficiency in Stage 2 companies, in regard to DSI processes, is the lack of active engagement from one or more of the key players. For example, one retail company with whom I have worked has been successful in convincing the merchandising team to participate in the DSI process, but no representatives from store operations are ever present at any of the DSI meetings. In other cases, executives allow other obligations to take precedence over the DSI meetings, and send their lieutenants to represent them. However, these lieutenants are often not able to make important decisions about either demand shaping or supply flexing, and the DSI meetings become ineffective.
In Stage 3 companies, the organization has defined and implemented a formal DSI process, and individuals who are able to make both strategic and tactical decisions consistently attend the meetings. In addition, Stage 3 companies have strong executive support for the process. At one company that participated in the audit research, the CEO made it clear that his senior leadership team was absolutely expected to attend the executive DSI meetings, with only life-threatening illness as a valid excuse to miss them. His executive team members were to “build their calendars around the scheduled executive DSI meetings.” He took attendance, and sent nasty notes to anyone who failed to attend. This level of executive support worked its way downhill in the organization, and the entire series of DSI meetings were religiously attended by those who needed to be present.
A further example can help to illustrate this concept of “strong executive support.” One company in our audit database was in the early stages of implementing a DSI process. However, at one of the early executive DSI meetings, the chief marketing officer of the firm boldly stated, “When sales goals and supply chain goals are in conflict, sales will always take priority.” My reaction to this statement was, “They have a lot of work to do to change the culture.” This statement represents siloed thinking at its best. In a DSI culture, senior executives have committed themselves to the notion of cross-functional goals. Rather than “sales goals taking priority,” in a DSI culture, “profitability goals” or “shareholder value” goals are more salient, even for demand-side executives. This company had clearly not evolved to a Stage 3 company, because strong executive support did not exist for the ideals behind DSI.
Finally, in Stage 4 companies—representing world-class characteristics—not only is there a strong internal DSI process in place but there is also active collaboration with important external constituents, such as large customers and major suppliers. Stage 4 companies demonstrate a culture of collaboration, both internally and externally, and information flows freely from people who have it to people who need it.
Organization
The next functional integration theme is organization, and by this, I mean the organizational structure that is in place to support the DSI and forecasting processes. In a Stage 1 company, each function does its own forecast, and no effective functional entity is in place to develop and distribute forecasts. We observed an extreme example of this at one company that participated in the audit research. Although the company had a forecasting group, and they did utilize a very old, outdated legacy forecasting system, the forecasts created by this group, using this system, were virtually ignored by downstream users. The situation got so bad that the logistics department in the company decided to go out and buy its own PC-based forecasting system, and create its own forecast. The procurement department got wind of this, and followed suit by buying its own PC base forecasting system (a different system). One individual in the company described it to me as “black-market forecasting.” You can imagine what transpired. Each of the three forecasting systems—the “official” legacy system, and the two PC-based systems—developed different forecasts. No one was aligned, and the company was in chaos. Although this is a rather extreme example of this Stage 1 characteristic, it illustrates the problem of having no central organization of the process.
At Stage 2 companies, one organizational entity “owns” the forecasting process. This group creates the forecast—usually without effective input from other functions—then dictates that forecast to other entities without the benefit of DSI dialogue. This Stage 2 characteristic raises the question that is often asked of me by companies: “Who should own the forecasting process?” In most companies, forecasting reports to one of three different functions: sales (or marketing), supply chain, or finance. When forecasting reports to any of these three functions, structural bias can creep into the forecasting process. That bias normally takes the one of the following forms:
• If forecasting reports to sales or marketing, normally an upward bias exists. Sales or marketing executives are typically measured and rewarded based on top-line, or revenue, performance. If a forecast is biased high, then less risk exists that product won’t be available when a customer is ready to buy it, and this bias would support a revenue focused culture.
• If forecasting reports to supply chain, normally a downward bias exists. Supply chain executives are typically measured and rewarded based on cost control and inventory management. If a forecast is biased low, then less risk exists that inventory will be a problem.
• If forecasting reports to finance (which is, by the way, the worst organizational structure), then the forecasts often become plan-driven forecasts. Recall from Chapter 1 that a plan-driven forecast is one where the forecast is aligned to the financial goals of the firm, whether market demand exists to support those goals or not.
The answer, then, to the question of “Where should forecasting reside organizationally?” is found in the description of a Stage 3 company. An ideal organizational structure is one where the forecasting group reports to the COO of the company and is not aligned with any particular demand, supply, or finance function. In an ideal world, each company would have a “CFO”—Chief Forecasting Officer! This individual would lead a group that is not organizationally aligned with any function, and thus not subject to the structural biases described previously.
Although theoretically, this is the ideal organizational structure, I recognize that it is not likely in practice. Forecasting has to report somewhere, and to give a more practical solution, I cite two points:
• If forecasting has to report somewhere, I recommend that it report to the demand side of the firm. In manufacturing companies, that is sales or marketing. In retail companies, that is merchandising. I come down on the side of reporting to the demand side of the company because of what forecasting is trying to do—predict future demand. Sales, marketing, or merchandising should have the best view of demand, and thus, forecasting should report there.
• Even if the forecasting function is not independent on an organization chart, it can be independent culturally. A great example of this is at a company with which I’ve worked for several years. This company has a forecasting organization, headed by the same individual for more than 15 years, which is perceived throughout the company as independent and unbiased. Even though this group gets moved every 2 to 3 years—from marketing, to supply chain, to strategic planning—it remains intact and culturally independent. This forecasting group is also responsible for managing the company’s DSI process. It is an excellent example of a Stage 3 characteristic: that forecasting and DSI be housed in an independent organization.
Finally, Stage 4 companies are characterized by the presence of what we have called a “forecasting/DSI champion.”7 This individual has the responsibility for not only overseeing the forecasting and DSI processes at the firm, but also acting as an advocate for developing the culture, processes, and tools that are needed to make DSI successful. Our experience with the dozens of companies that have participated in our research has demonstrated, time and again, that without this dedicated, full-time, effective champion for forecasting and DSI, the firm has little chance of pursuing continuous improvement and achieving world-class status. When working with a company, I have a little trick that I use to see whether or not a forecasting/DSI champion is in place. During each interview that I conduct, I ask the interviewee the following question: “If your CEO wakes up in the middle of the night with a forecasting or DSI nightmare, who will he or she call?” At some companies, I will get multiple answers to this question, ranging from “He or she wouldn’t have any idea who to call” to “He or she would call the VP of Sales.” At other companies, I get the same answer from everyone, and the answer I get is an individual who has forecasting and DSI as his or her sole job responsibility. When this latter case exists, then I have evidence that this company is at Stage 4, and a true forecasting/DSI champion is in place.
7 Mentzer, John T., Mark A. Moon, John L. Kent, and Carlo D. Smith (1997), “The Need for a Forecasting Champion, Journal of Business Forecasting, 16 (Fall), 3–8.
Accountability
The next functional integration theme is accountability. In Stage 1 companies, no one who participates in the forecasting process is accountable for their forecasting performance. This lack of accountability is the primary driver behind some of the “game playing” that was described in Chapter 4, “Qualitative Forecasting.” In Chapter 6, “Performance Measurement,” I introduced the mantra of “what gets measured gets rewarded, and what gets rewarded gets done.” This management proverb is clearly relevant here. When no accountability exists for the accuracy or usefulness of a forecast, then those who are responsible for providing that forecast will either spend very little time and energy to do it well, or will use the forecasting process to advance the agendas that I described in Chapter 4. In terms of accountability, I emphasize that Stage 1 companies fail to impose accountability for forecasting performance. At one company with which I worked, the individuals from the sales team were paid bonuses if they completed their forecasts on time. It didn’t matter whether their forecasts were accurate—they just had to be in on time. That’s still a Stage 1 company.
Stage 2 companies introduce accountability for forecasting performance, but that accountability is limited to those who work in the forecasting group. In these companies, accuracy is measured and the forecasters have goals they strive to achieve. There are rewards for achieving those accuracy goals, and consequences for not achieving them. While this is better than Stage 1, it is suboptimal because it does not extend the accountability to others in the company, such as sales, marketing, or merchandising, who are involved in the forecasting process. This extended accountability is present in Stage 3 companies. Here, each individual who is involved in the process has his or her contribution to forecast accuracy measured. Again, “What gets measured gets rewarded, and what gets rewarded gets done.” If a company wants, for example, its salespeople to do a good job of forecasting, then their contribution to the forecast must be measured, and they must be accountable, through rewards and consequences, for good or bad performance.
Finally, Stage 4 companies recognize that forecast accuracy is a process measure, not an outcome measure. These companies work to affect the overall culture of the firm by incentivizing their employees, particularly their senior functional leaders, with cross-functional metrics. For example, at one company with which I’ve worked, the sales organization has begun including finished good inventory levels in the overall performance metric of their sales executives. Finished good inventory is an outcome metric. This individual, then, must create a culture where his sales team provides accurate, credible forecasts, a process metric, so that the firm can make good cross-functional decisions that keep finished goods inventories at healthy levels. This is an example of a Stage 4 company, applying cross-functional performance reward to those involved in the forecasting process.
Role of Forecasting versus Planning
The DSI process described in Chapter 1 is, at its essence, a planning process. The point was made at that time that DSI is most effective when it is positioned as the way to “plan the business,” rather than “plan the supply chain.” The vision of world-class demand/supply integration articulated in Chapter 1 is one where forecasts serve as inputs to business plans. In other words, a forecast—the best guess about what future demand will be, as well as the best guess about future supply capabilities—leads to a plan, which is a set of decisions about what to actually do. Further, every organization establishes many business goals—targets that individuals and organizations strive to achieve, and for which rewards are frequently given for successful attainment and consequences suffered from non-attainment. Again, following the vision of world-class demand/supply integration, goal setting is at least influenced by a realistic assessment of the true demand in the marketplace.
In Stage 1 companies, these three concepts are at best poorly coordinated, and at worst, unrelated. In these companies, plans are often formulated based only on the financial goals of the firm, rather than a dispassionate analysis of true demand in the marketplace. As discussed in Chapter 1, this is referred to as “plan-driven forecasting,” and it is one of the most insidious aberrations to an ideal DSI process. A good example of this phenomenon occurred at one company that participated in the audit research. At this company, the demand planners described a situation where they would work diligently all month to complete what they thought was a supportable, evidence-based forecast. However, at the consensus forecasting meeting, the senior executives would look at this forecast and say, “No, that’s not enough. We won’t make our numbers with this forecast. Raise everything by 10%.” In frustration, the forecaster commented to me, “Why don’t they just tell us what number they want at the beginning of the month? Then, I could spend my time doing something useful, like playing golf!” At this company, and at several other companies with which we’ve worked, either no relationship, or a dysfunctional relationship, exists between demand forecasting, business planning, and goal setting.
Stage 2 companies are characterized as having processes in place that attempt to appropriately align forecasting with business planning, while separating forecasting from goal setting. However, in spite of these processes, the business plans often end up being formulated based on the firm’s goals, rather than forecasted demand in the marketplace. In other words, it’s almost as if the company knows that it shouldn’t, but when the end of the fiscal quarter or the fiscal year looms, the company almost can’t help itself from forecasting the goal, then hoping for the best.
In contrast to these problematic cultural inclinations, Stage 3 companies have processes in place that are rigorously followed to formulate business plans following careful consideration of the demand forecast. And then, after a company reaches Stage 4, a truly iterative process is followed that is consistent with the ideal state of DSI described in Chapter 1. Both demand forecasts and financial goals serve as input to the overall planning process. If the amount of demand in the forecast is insufficient to reach the financial goal, then various “gap closing” strategies are explored, and the most financially sound, and strategically aligned, gap-closing strategy is selected during the DSI process. This strategy is then translated in specific action steps, which ultimately constitute the business plan. In addition, goals are set by combining the dispassionate assessment of future demand found in the forecast with the strategic growth objectives of the firm into a set of targets that contributes to the firm’s overall motivational efforts.
Training
Functional integration is that dimension of forecasting and DSI that relates most closely to culture. Many elements can influence culture, including organizational structure and accountability, discussed earlier. One other important way to effectively drive a culture of openness and collaboration is through extensive education and training of the individuals involved in the DSI process. I use both terms—education and training—on purpose, and don’t see them as synonymous. In simple terms, I use training to describe efforts to teach people how to do things. In contrast, I use education to describe efforts to teach people how to think about things. Both are important, but to change culture, education might be more important than training.
At Stage 1 companies, neither education nor training is effectively utilized in the forecasting and business planning processes. In these companies, forecasters are frequently only shown how to operate the forecasting system, and which sequence of steps to complete to end up with a demand forecast in advance of a certain deadline. The only semblance of training is directed at the forecasting personnel—no one else in the firm who contributes to forecasts, such as salespeople, product managers, or marketing people, receive any training or education whatsoever in these business processes. The result of this lack of training or education is frequently that people fail to understand the purpose of forecasting, how a forecast should be created, or what happens to the forecast after it is completed. Moving an organizational culture toward openness and collaboration is nearly impossible when key individuals know little about the how or why of forecasting and demand planning.
Stage 2 companies are those that strive to improve the forecasting process by focusing on training—focusing on the “how”—for their forecasting personnel. At these companies, training on the mechanics of statistical forecasting is provided, along with the steps needed to acquire and incorporate qualitative judgment into the forecasts. Because the training delivered at these Stage 2 companies tends to be quite tactical, often limited time is spent helping the forecasting personnel understand the strengths or weaknesses of various statistical forecasting techniques. Although Stage 2 companies do provide some enhanced opportunity to drive culture through training, that opportunity is limited because it is centered on the “how” rather than the “why,” and it is delivered to the forecasting personnel only. To quote an old cliché, it is to some degree “preaching to the choir.”
Stage 3 companies are more committed to extensive education and training for forecasting personnel. At these companies, much more time is spent educating forecasting personnel on the ideas behind various forecasting tools and techniques, both quantitative and qualitative, and to help these individuals know what pitfalls to expect from different approaches. At one company in our audit database, significant investment has been made for many years on providing formal certification to its very large forecasting team, located worldwide. Videotaped lectures are combined with formal exercises and reading material, and the curriculum culminates with an examination designed to demonstrate mastery of the material. Both the “how” and the “why” are emphasized in this certification process, and by the time its demand planners have concluded the program, they are recognized experts. Although this company excels at delivering education and training to its demand planners, they are not world class. In order for this, or any company, to reach Stage 4 and be truly world class on this dimension, extensive education and training must be provided to everyone who participates in the DSI process. In other words, not only forecasters need education and training. If salespeople, product managers, marketing managers, even senior executives, participate in the process, then all these individuals need to know how to do what the process requires them to do, as well as why they need to do it. When companies embrace this commitment to education and training for everyone, they take advantage of the opportunity to truly drive the type of organizational culture that needs to be in place for DSI to work well. Recall the example from earlier in this chapter of the marketing executive who demonstrated siloed thinking when he stated “If sales goals and supply chain goals are in conflict, sales goals will always take priority.” A well-designed and well-executed education effort (along with changes in the measurement and reward structure!) is needed to transition this company away from its siloed culture into one where true demand/supply integration drives the company.
Summary: How Companies Can Improve on the Functional Integration Dimension
Recall that the functional integration dimension answers the question, “How successful is a company at getting information from those who have it to those who need it, in support of the forecasting and demand/supply integration efforts of the firm?” It is the dimension that is all about organizational culture. If, while reading this section, you have identified your company as being in Stage 1 or 2 on several of these themes, here are some bullet points to focus on:
• Work on your DSI processes, and gain committed executive support. A point that I have made repeatedly in this book is that getting demand-side executives (sales and marketing in a manufacturing environment, merchandising in a retailing environment) to go “all-in” on demand/supply integration is extremely important. Identify a demand-side executive champion, and leverage that individual’s influence to execute a well-conceived change-management strategy to change the culture.
• Pay attention to the organizational structure. Try to establish a truly independent forecasting function, whose sole agenda is to create the most accurate, unbiased demand forecast possible to drive the business planning process. Identify a forecasting/DSI champion whose full-time job is to effectively drive process improvement and culture change.
• Make everyone involved in the process accountable for his or her contribution. “What gets measured gets rewarded, and what get rewarded gets done.”
• Make sure that everyone understands the difference between forecasting, business planning, and goal setting. Use organizational structure, accountability, and education and training to ensure that these processes are sequenced properly: forecasting drives the business planning and goal-setting processes, and all should be done in an iterative fashion.
• Commit resources to effectively train and educate everyone involved in DSI on the “how” and the “why” of what they’re doing.
One final word of caution, and exhortation, concerning functional integration: In our experience working with dozens of companies, it’s the most difficult dimension to influence. Culture is very hard to change. However, it’s the dimension that provides the biggest pay-off if it moves toward being world class. Getting everyone in the boat, pulling on the oars together, has more value than any other element of demand forecasting and demand/supply integration.
Approach
The second dimension of demand forecasting is approach. This dimension gets at the question of “What are the techniques and processes that are used to create demand forecasts?” As noted earlier, excellence comes from culture, process, and tools, and approach is the dimension that describes the process element of forecasting and demand/supply integration excellence. Table 7-2 summarizes the approach dimension, and the following subsections describe each of the five themes found in it.
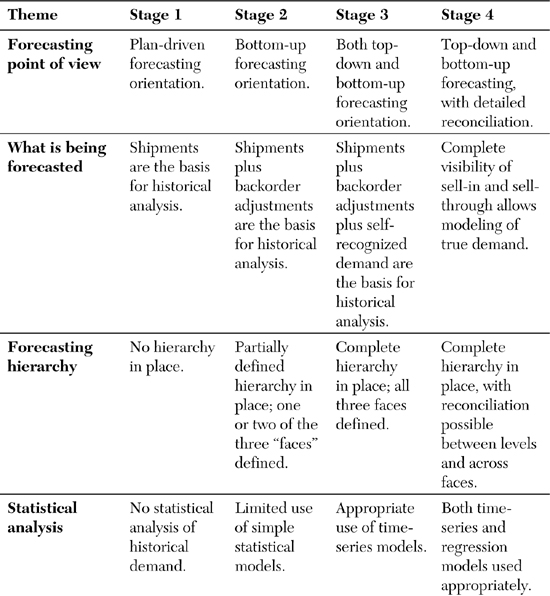

Table 7-2. Approach
Forecasting Point of View
The forecasting-point-of-view theme describes the perspective that is taken on creating a forecast. Stage 1 companies look at the forecast through the lens of the financial goals of the firm, or plan-driven forecasting. Several sections of this book cover the insidious nature of plan-driven forecasting and thus, I do not dwell further on it now. Suffice it to say that when a forecast is developed by looking through the lens of the financial goal of the firm, it is not good. It’s Stage 1, and improvement is clearly needed.
In Stage 2 companies, the lens through which the forecasting process looks is a “bottom-up” lens. This perspective entails essentially beginning with customer #1 and asking “What will their demand be?” then moving on to customer #2 and asking the same thing, then on to customer #3, and so on, through all the customers, and then adding all these individual forecasts together to reach an overall projection. A variation of this would be to individually forecast only those large, “A”-level customers, and then group smaller customers into an “all-other” category, and use a statistical modeling technique to forecast these smaller customers. The sum of the “A” level customer forecasts and the “all-other” forecast would then constitute the demand forecast for that SKU, product family, brand, or whatever forecasting level is currently being analyzed. This straightforward process provides a valuable insight. It does, however, have potential pitfalls. One pitfall is best described through two examples from companies that have participated in the audit research. The first company was a manufacturer of optical fiber, those human-hair thickness strands of glass that form the backbone for the transmission of digital signals worldwide. As described in Chapter 2, “Demand Forecasting as a Management Process,” the forecasting form for optical fiber is kilometers—in other words, the relevant question asked during the forecasting process is “How many kilometers of optical fiber will be demanded in future time periods?” The direct customers for the optical fiber company are companies who are called “cablers,” because their value-add in this supply chain is to purchase the optical fiber, then bundle some number of strands of fiber together, wrap protective material around these fragile strands of glass, and create optical fiber cable that can then be sold to telecommunications companies, who eventually bury that cable, thus providing digital transmission capability. The optical fiber company’s salespeople thus call on cablers, and their job is to forecast demand from these cablers. One of the demand planners from the optical fiber company told me a story that illustrates a pitfall associated with bottom-up forecasting. Imagine a demand planner approaching a salesperson and asking for his or her forecast of demand for the next quarter. The salesperson might respond, “Well, my customer, Cabler A, is very confident that they will win the contract for optical fiber in South Korea, so they will need 40,000 kilometers of fiber in the next quarter.” The demand planner notes that forecast, and moves on to the next salesperson. The next salesperson reports “My customer, Cabler B, is very confident that they will win that South Korea contract, so put me down for 40,000 kilometers of fiber.” Now with a puzzled look on her face, the demand planner goes to the next salesperson who declares “My customer, Cabler C, is counting on winning that contract in South Korea, so I’ll need 40,000 kilometers of fiber.” The astute reader can instantly see the problem. Only one of these three cable companies is going to win that South Korea contract, and if the demand planner follows a strict bottom-up procedure, the fiber optical company will overforecast by 80,000 kilometers.
The second example, similar to the first, was described during an audit of a candy manufacturer’s forecasting processes. Here, the candy company sells its products to retailers, who then sell the candy to consumers. In this case, the conversation between forecaster and salesperson might go something like this: “My customer, Retailer A, is really going to be pushing candy next quarter because they believe it’s a very high margin item, so they expect to grow volume by 5%.” The next salesperson says, “My customer, Retailer B, has declared candy to be a strategic focus for the next quarter, so their demand will increase by 5%.” The next salesperson might say the same thing about Retailer C. Each retailer expects its demand for candy to grow by 5% in the next quarter. However, a close examination of overall industry demand for candy might reveal flat demand for the past several quarters, leading the forecaster to believe that if Retailer A is going to grow share, it’s going to do it at the expense of Retailer B or Retailer C, and that all three will grow by 5% is unlikely. What do you do?
The solution is to do what Stage 3 companies do, which is to take both a bottom-up and a top-down perspective on the forecast. A bottom-up forecast looks customer by customer, whereas a top-down forecast requires two projections. First, the forecaster must project overall industry demand for the product or service category being forecasted. Second, the forecaster must project his or her company’s market share of that industry demand. Multiply those two numbers together, and the result is a top-down forecast of demand. In both examples just described, a top-down forecast would give a very different number than the bottom-up forecast. Stage 3 companies perform both analyses, and Stage 4 companies take the analysis one step further by conducting a detailed reconciliation of the differences between the top-down and the bottom-up perspective. Such a detailed reconciliation not only helps the forecaster arrive at a more useful result, but also gives the forecaster valuable insights about business dynamics, making him or her a much more valuable contributor to the overall DSI process.
What Is Being Forecasted?
The second theme in the approach dimension concerns the issue of forecasting true demand. As defined in Chapter 2, true demand is “what customers would buy from us if they could.” If the company has sufficient service or manufacturing capacity, no orders are ever unfilled, and all orders are supplied at the time and quantity requested by the customer, then “how much we have shipped” would be identical to “how much was demanded.” However, this ideal is seldom reached. Thus, the second theme in the approach dimension describes the source of historical data against which statistical, or quantitative analysis, takes place.
Stage 1 companies use historical shipments as the basis for statistical analysis of past demand, which is then projected into the future to forecast future demand. This procedure is certainly quite easy to implement. Pulling actual shipment records, putting those shipments into monthly buckets, and analyzing those monthly buckets to find patterns that can be projected into the future is straightforward. Revisit Chapter 2 for a refresher the pitfalls of using shipments as a surrogate for actual demand. Recall the example of the chemical company forecasting sodium benzoate. In that example, the company was unable to supply the product demanded by the customer in the quantities demanded, in the time required. As illustrated there, the shipment of 15,000 pounds of sodium benzoate in August, along with the 5,000 pounds in September, did not reflect true customer demand. True demand was 20,000 pounds in August, even though the company shipped 15,000 in August and 5,000 in September. A Stage 2 company solves this problem fairly easily by making an adjustment to the shipment record. Here, the chemical company can easily identify that the requested ship date for all 20,000 pounds was August, and then use that number as the basis for their forecast of future demand.
But if you recall the next example in Chapter 2, where the customer decides not to take the 5,000 pounds in September because they really needed all 20,000 pounds in August, no order record exists for the full 20,000 pounds demanded. In this scenario, a Stage 2 company will do an incorrect forecast, but a Stage 3 company will be more sophisticated, and have created a “lost order” record, which is referred to in Table 7-2 as “self-recognized demand.” This Stage 3 company will now have the number that recognizes true historical demand—20,000 pounds—that it can now use to run its statistical analysis, and project that pattern of demand into the future. Thus, Stage 3 companies do a better job of accessing “true historical demand” than do either Stage 1 or 2 companies.
Companies that reach Stage 4 in this theme are those companies who sell their products through channels of distribution. World-class practice in this setting is to have complete visibility of both sell-in and sell-through, which allows the modeling of potential out-of-stock situations, and allows the company to estimate true demand at the consumer level. Sell-in refers to the quantity of product that is demanded by the retailer, which might be placed in inventory at the retailer’s distribution center, in individual stores’ back rooms, or on the shelf at the retail outlet. Sell-through is the quantity that actually passes through the store’s cash register, and this data is often provided to manufacturers by their retail partners in the form of POS (Point-of-Sale) data. If this sell-through data is available, it can be analyzed alongside the sell-in data, which is simply drawn from the manufacturer’s internal demand data. When sell-in greatly exceeds sell-through, then inventory is being built up. When sell-through exceeds sell-in, then inventory is being depleted. If retailer inventory is being modeled in this way, then the manufacturer can pinpoint possible out-of-stock situations at the shelf or distribution center, and anticipate situations where retailer demand is likely to rise or fall as a part of its inventory management policy.
Forecasting Hierarchy
Chapter 2 describes the concept of the forecasting hierarchy. Recall that the hierarchy is a way of describing the levels of granularity at which a forecast can be expressed. For example, a product forecast can be conducted at the SKU level, which is the lowest level of granularity; at the brand level, which is one level up from SKU; at the product category level, which is one level up from brand; or at the overall company level. These designations are idiosyncratic to each company, and the terminology will vary as well. For example, at several companies in our audit database, the lowest level of granularity is the “part number” level, and at others, a “product family” level falls between the brand and the SKU levels. However the levels are operationalized, the concept is the same—the forecasting hierarchy describes how lower level forecasts are aggregated, or “roll up,” to higher-level forecasts. Recall also that the forecasting hierarchy consists of three separate “faces”: the product, location, and customer face. As discussed in Chapter 2, the idea is that people should be able to contribute information to the forecast at the level of granularity in which they know it, and take information out of the forecast at the level of granularity in which they need it. Typically, the hierarchy is executed in the firm’s backbone ERP system, where the “parent-child” relationships between levels of products, customers, and locations are defined in the system.
At Stage 1 companies, no defined forecasting hierarchy is in place. If one function in the company needs a forecast at the SKU level, and a different function in the company needs a forecast at the brand level, separate forecasting processes must be completed for each needed forecast. This Stage 1 characteristic is most commonly a by-product of failure to either install an Enterprise Resource Planning (ERP) system, or failure to bring the organization’s ERP system up to date. In contrast, Stage 2 companies have at least one face of the hierarchy in place. Usually, if a company has only one of the three faces defined in its system, it will be the product face that is present. However, the customer and location faces are equally necessary to adequately plan for both distribution and sales coverage. In Stage 3 companies, all three faces of the forecasting hierarchy are operational in the system, and Stage 4 consists of a fully operational three-face hierarchy, in which data easily “flows” between the levels and across the faces. In other words, a company that is at Stage 4 in this area is truly able to “put information in at the level that people know it,” as well as to “take information out at the level that people need it.”
Statistical Analysis
An entire chapter in this book, Chapter 3, “Quantitative Forecasting Techniques,” covers the topic of quantitative, or statistical, forecasting. Unfortunately, in practice some companies operate at Stage 1 by not taking advantage of the insights that are gained from examining historical demand, and using statistical tools to find patterns in that history. Of course, in some instances statistical forecasting does not provide much benefit. (Remember the example of Boeing forecasting demand for 747s?) However, a company should see itself as Stage 1 where in fact insights can be gained from this analysis, but the company does not perform it. Our team was shocked when, at one of the very first companies we audited, we discovered that even though it sold products that had clear historical trends and seasonality, the only approach that was used to forecast was to send out forms to the salespeople, which were essentially blank pieces of paper, asking the question, “How much do you expect to sell over the next quarter?” Clearly, this company was mired in Stage 1!
Stage 2 companies make an effort to use some statistical tools to forecast demand, but the tools used are fairly elementary, and often used inappropriately. For example, if a company only calculates the average number of units demanded per month over the last year, and uses that one number as its forecast for the next year, that would be consistent with a Stage 2 company (unless, of course, the historical demand pattern consists only of random noise, in which case, an average is as useful a technique as can be found). Another example would be for a company to use a 6-month moving average where seasonality repeats every four months. As described in Chapter 3, this would simply be an inappropriate choice for a statistical model to choose and would constitute Stage 2.
After a company has progressed to Stage 3, it is appropriately using the full range of time-series tools to most accurately discover patterns in historical demand, and then project those patterns into the future. Typically, when a company reaches Stage 3, it is using sophisticated forecasting software that includes an array of time-series algorithms, and allows “pick-best” functionality where the system chooses the “best” algorithm to match the historical demand. Of course, a caution always applies to the use of pick-best functionality, as illustrated in Chapter 3 in the “St. John’s Wort” example. Those companies that have reached Stage 4—world class—are using not only all the time-series techniques at their disposal, but also using regression or other causal modeling tools to uncover the relationships between independent variables and demand. In our experience, the companies that benefit most from this level of statistical analysis are those companies that are very promotion-intensive. These firms gain tremendous benefit from documenting the “lift” that occurs from different promotional strategies, and then projecting that lift into the future when similar promotional activities are scheduled. These firms also benefit from the strategic insights that can be derived from analyzing which promotional activities have historically generated the most lift under specific conditions.
Incorporation of Qualitative Input
As discussed in Chapters 2, 3, and 4, the sequence of steps that under most circumstances results in the most satisfactory demand forecasting outcomes is one where a statistical forecast is augmented by qualitative judgments from knowledgeable people. In other words, the first step should be a statistical analysis of historical demand to try and understand what patterns have existed in the past, then projecting those patterns into the future. The next step is for knowledgeable people to examine those statistical projections and make qualitative adjustments based on their judgment of how the future is likely to look different from the past.
Stage 1 companies make little to no effort to augment statistical forecasts with qualitative judgments from sales, marketing, or senior executives. We observed a good example of this situation in one company in our audit database, where soon before our engagement with the company, significant expenditures had been made on a statistical forecasting system. An unanticipated consequence of this installation was that the sales and marketing teams stopped contributing to the forecasting process. As we learned when we interviewed sales and marketing people, their perspective had become “Look, we spent all this money on the forecasting system, now I don’t need to be involved. Let the system do the forecast!” Overall forecasting performance, as measured by MAPE, plummeted, and the company blamed the new system. In fact, it was the overall process that had deteriorated.
Stage 2 companies are characterized by active participation, from sales, marketing, and senior executives, but that participation sometimes does more harm than good because of various other political agendas. As discussed in detail in Chapter 4, it is often the case that sales, marketing, product management, or senior executives—the most common contributors of qualitative forecasts—will have goals other than forecast accuracy that drive their efforts. I won’t repeat that discussion here, but instead encourage the reader to revisit that section of Chapter 4. Rigorous measurement of forecasting outcomes, and reward structures that recognize the importance of accurate forecasts, are needed to move a company beyond Stage 2, and into Stage 3. Stage 3 is characterized by both active and helpful participation from sales, marketing, product management, and senior executives in the forecasting process. In these companies, processes are established to help these individuals contribute to the forecast in a way that takes advantage of what they know well, while not making their participation onerous. Normally, this occurs through the demand review in a well-structured DSI process, as described in Chapter 1.
When companies reach Stage 4 in this area, they are effectively utilizing not only qualitative insights from internal sources, but from external sources as well. The most common external source of qualitative judgment is the customer base. As discussed in Chapter 5, “Incorporating Market Intelligence into the Forecast,” companies can gain considerable insight from collaboration with those customers who are both willing and able to provide that level of insight. Although insights about customer demand can come through the sales teams, having forecasters work directly with customers to better understand potentially changing demand patterns often provides value. This is particularly helpful in a retailing context, where a manufacturer is selling its products through retail customers. Direct collaboration between the procurement organization at the customer and the demand planners can often be an extremely effective way to get that customer insight into the demand forecast. As discussed in Chapter 5, these collaboration processes can be fairly informal, or very formal as is the case in a CPFR relationship. However they are structured, close collaboration with key customers in capturing their anticipated future demand takes a company to world-class level in the approach dimension.
Summary: How Companies Can Improve on the Approach Dimension
To review, the approach dimension answers the question “What are the techniques and processes that are used to create demand forecasts?” If functional integration is all about culture, then approach is all about process. If, while reading this section, you have identified your company as being in Stage 1 or 2 on several of these themes, here are some bullet points to focus on:
• Both top-down (industry level) and bottom-up (customer-by-customer) forecasting is useful. Your company should do both. You should also work to understand the gaps between the bottom-up and top-down views (and usually gaps exist), because this can both help you do a better job of forecasting, and help you understand the dynamics of your business better.
• Do everything possible to forecast demand, not sales. Knowing what your historical demand actually was is not always easy, but finding the best surrogate possible for true demand is worthwhile.
• Create, and use, a forecasting hierarchy. If you are using Excel or some other desktop spreadsheet tool as your main forecasting engine, then creating and using an effective forecasting hierarchy will be very difficult. You need the power of well-conceived and executed data structures to work effectively with various levels of the forecasting hierarchy. The goal is to be able to “put information in at the level you know it, and take information out at the level you need it.”
• Take advantage of the power of statistical forecasting. The past is an excellent starting point for your forecast of what you think will happen in the future. Companies can gain much from the appropriate use of both time-series and regression or other causal modeling tools.
• Combine the power of statistical forecasting with the wisdom that comes from the judgment of individuals. Create incentives for people to contribute useful judgments that will help make the overall forecast more accurate, and less biased.
Although the approach dimension might not be as difficult to improve as functional integration, because it is less dependent on culture, it is difficult enough. Frequently, effectively changing the approach dimension is hampered by the “That’s the way we’ve always done it” syndrome. Inertia can be a powerful enemy, and getting people to change the way they do things can be tough. At the same time, when combined with the culture changes that come about from improving functional integration, the process improvements companies gain from moving to world-class level in the approach dimension can greatly enhance demand forecasting, DSI, and overall business performance.
Systems
The third dimension of demand forecasting is systems. This dimension gets at the question of “What is the state of information technology support for the demand planning process?” Recall that excellence comes from culture, process, and tools, and systems is the dimension that describes the tools element of forecasting and demand/supply integration excellence. Table 7-3 summarizes the systems dimension, and the following sections describe each of its four themes in detail.
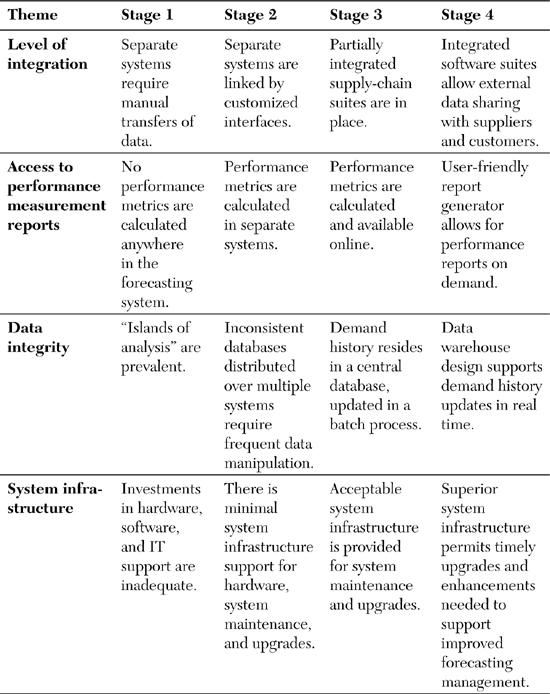
Table 7-3. Systems
In Chapter 2, I rather vehemently stated, “Systems are not silver bullets.” My point in making that statement was that a company cannot “buy its way” into forecasting excellence by installing a forecasting system. Elsewhere, I’ve stated that culture represents 60% of the challenge in creating excellence in forecasting and demand planning, process represents 30%, and tools only 10%. Although tools—systems—only represent 10%, they are important and I don’t want to suggest otherwise.
To explicate some of the issues in the systems dimension, see Figure 7-1, which is a figure that was previously discussed in Chapter 2.

Figure 7-1. Forecasting system overview
Level of Integration
Figure 7-1 shows a simple overview of an organizational system structure in which demand forecasting systems are tied directly to the firm’s ERP backbone system, which is then tied directly to the firm’s data warehouse. In Stage 1 companies, the level of integration that is implied by Figure 7-1 is not present. Rather, historical demand data that is needed by the forecasting system is not easily accessible from a data warehouse. Instead, data must be transferred manually from the central data repository to the forecasting system. Similarly, at Stage 1 companies, after the forecast is complete, the results must be transferred manually into the systems that use the forecast for planning purposes, such as Materials Resource Planning (MRP) systems, production planning systems, or inventory management systems. Sometimes, data is transferred manually, with numbers literally being keyed in by data entry personnel. As someone who at one time worked in the data processing industry, visiting a company and seeing a computer printout sitting next to someone’s workstation, with that individual keying numbers that were extracted from one system into another system, is painful. More commonly, however, is a situation where an analyst will “cut” data from one spreadsheet and “paste” that data into another spreadsheet. For example, a SKU-level forecast might be completed, sometimes in a spreadsheet program, and the results are cut-and-pasted into the production planning application, which might be a different spreadsheet. Although certainly faster than data rekeying, a cut-and-paste procedure can potentially lead to big mistakes. Cutting a 100 by 100 block of data in one spreadsheet and pasting it into the wrong place on another spreadsheet results in 10,000 mistakes from one bad keystroke! The results of being Stage 1 in this dimension should be quite clear. Manual transfers of data, either through cut-and-paste or rekeying, is highly error prone and a huge waste of time.
In Stage 2 companies, the manual transfer of data is replaced by customized interfaces that link separate systems together. In these situations, there might be a variety of downstream supply chain systems that use the output of the forecasting system, but the data transfer between these systems takes place through custom code. Several problems are associated with this approach. One is that completing these custom interfaces takes considerable time and resources. Also, after those custom interfaces are completed, companies become reluctant to upgrade the systems on either end of the interface, because an upgrade might also require rewriting the customized interface code. Finally, over time, these interfaces often become quite complex. “Cludgey” is the word that was used to describe such interfaces back in my days in the computer industry (the opposite of cludgey is “elegant”). Such complex interfaces are often quite slow, reducing the computing power of the forecasting system. I have even observed instances where the interfaces are so complex that only one person really understands how they work. If that one person decides to retire, gets hit by a bus, or gets hired away by a competitor, then the company is in deep trouble, because no one else really understands how the data move into, or out of, the forecasting system.
Stage 3 companies are characterized by elegant, rather than “cludgey” interfaces between the various forecasting and supply chain systems. Often, a single software vendor provides the functionality contained in these systems, and the elegant interfaces are engineered into the integrated system. Also, some forecasting system vendors engineer elegant interfaces both into, and out of, the backbone ERP systems, knowing that customers are unlikely to choose their products unless those interfaces are solid. This level of integration is taken to an even higher level at Stage 4 companies, where not only does tight integration exist between the internal forecasting and supply chain systems, but also integration between internal system and external customer and supplier systems. Our discussion of external DSI in Chapter 1 showed information flows between various members of the firm’s supply chain. An OEM customer’s demand plan becomes input to a component manufacturer’s demand forecast. A component manufacturer’s operational plan becomes input to the OEM customer’s capacity forecast. At Stage 4 companies, this information flow is seamless.
Access to Performance Measurement Reports
Chapter 6 discussed why measuring forecasting performance is so important. Forecast accuracy is a common surrogate measure for demand volatility, which is an important variable in the calculation of safety stock inventory. Accuracy metrics help to validate the usefulness of the forecasting processes and techniques that have been chosen by the demand planners. Measuring accuracy, and tracking it over time, provides critical information for managers to assess overall process improvement efforts. Plus, without good accuracy metrics, providing appropriate rewards for forecasting excellence, or consequences for forecasting incompetence becomes difficult for managers. However, none of these benefits are available unless access to performance metrics exists somewhere in the forecasting system. In this theme, the difference between “best in class” and “worst in class” is tied to the accessibility of forecasting performance data by people who need those metrics to drive excellence.
Stage 1 companies—worst in class—do not have performance metrics calculated anywhere in the forecasting system. That is not to say that these metrics are not calculated anywhere in the company. At some companies that we have classified as Stage 1, individual users calculate their own metrics for their own personal use. However, no effort exists to centrally calculate and distribute these performance metrics to people who need them. Without this central control over performance metric calculation, comparing performance across products, or customers, or regions is impossible. Stage 2 companies, in contrast, do make performance metrics available to those who need them, but they do so in such a way that makes the distribution of these reports cumbersome. Typically, Stage 2 companies use tools such as Access and Excel to extract data from the forecasting and ERP systems, dump those data into a spreadsheet, and then calculate performance metrics. These procedures are normally performed offline, and the resulting performance metrics are only available in printed reports or on spreadsheets that are not very customizable, and thus, not very user friendly.
More sophisticated companies that we would classify as Stage 3 use the forecasting systems themselves to calculate performance metrics. Most respectable forecasting systems contain the ability to calculate these metrics directly in the system, and then, when appropriate access privileges are given to designated users, those users can access those metrics directly from the forecasting system. World-class companies—Stage 4—make use of highly user-friendly report generators that allow designated users to craft their own performance metrics to suit their own needs. For example, at Stage 4 companies, sales managers can query the system to calculate an individual salesperson’s forecast accuracy for a particular product family at a particular customer, and compare that accuracy to the average of all salespeople in the company. An inventory manager could query the system to receive a 12-month rolling MAPE for a particular SKU at a particular location, which he or she could then use to calculate the appropriate safety stock levels for that SKU at a distribution center. In other words, Stage 4 companies give access to performance metrics to people in the format they need it, when they need it.
Data Integrity
Mentzer and Kahn, in their 1995 Journal of Forecasting article,8 reported that the most important outcome of a forecasting process for forecast users was accuracy. Not far behind, however, was credibility. In other words, forecast users want the forecasts given to them to be accurate, but they also want to believe in the integrity of those forecasts. One of the biggest threats to credibility is a lack of data integrity. Stage 1 companies struggle with data integrity because they find themselves in an “islands of analysis” situation. “Islands of analysis” is a term coined by Mentzer and Moon9 to describe a situation where multiple people are using different, unconnected, and uncoordinated tools to forecast demand for different products or customers. “Islands of analysis” is often a problem when a company uses Excel or some other spreadsheet tool that resides on individual analysts’ desktops to forecast demand. At one company with which we worked, the islands of analysis problem was so prevalent that one observer described his company as suffering from “spreadsheet mania.” Several reasons exist for why having islands of analysis is suboptimal. For one thing, over-reliance on spreadsheets makes centrally managing a forecasting hierarchy difficult. For another, little central control exists over the techniques used to model historical demand. Perhaps the most daunting problem posed by islands of analysis, or spreadsheet mania, is a lack of data integrity. As discussed in Chapter 2, and illustrated in Figure 7-1, a well-conceived system architecture is one that utilizes a professionally managed data warehouse to control access to, and integrity of, the company’s data. After that data is placed on individual analysts’ desktops and manipulated by individual analysts’ spreadsheets, data integrity can become compromised, which leads to a lack of credibility in the forecasts.
8 Mentzer, John T. and Kenneth B. Kahn (1995), “Forecasting Technique Familiarity, Satisfaction, Usage, and Application,” Journal of Forecasting, 14 (No. 5), 465–476.
9 Mentzer, John T. and Mark A. Moon (2004), Sales Forecasting Management: A Demand Management Approach, Thousand Oaks, CA: Sage Publications.
At Stage 2 companies, “islands of analysis” might not be a problem, but data integrity can be problematic if a variety of databases exist where historical demand data resides, and where data manipulation is required to access this historical data on multiple systems. One instance where our research team has seen considerable problems in this area is at a company that has aggressively grown through acquisitions of other companies. At this company, multiple ERP systems are in place supporting multiple data warehouses. Significant translation of data must take place on a regular basis, primarily so that part numbers in one system match up with part numbers in another system. This type of repeated data manipulation leads to delays, errors, and ultimately loss of confidence in the integrity of the forecasts.
In Stage 3 companies, the type of architecture illustrated in Figure 7-1, which shows a central, professionally managed data warehouse, is in place. A common practice at these companies is for this data warehouse to be updated in a batch process, often once per day, with new forecast or actual demand information. In other words, orders are placed and processed throughout the day, but once a day, the central data warehouse is updated with the new information. In most situations, this type of updating is adequate. However, in some settings, the nature of demand and supply is so dynamic that real-time updating of the central data-warehouse is required, and this is a Stage 4 characteristic. The most typical type of business environment where this dynamic real-time need is in place is an environment where promotional activity is highly prevalent. In these settings, demand-supply balancing happens in real time, and this requires a data warehouse to be updated in real-time to facilitate this balancing.
System Infrastructure
The final theme in the systems dimension is what we refer to as system infrastructure, and the difference between Stage 1 and Stage 4 is something of a matter of judgment—is the company doing enough to provide the hardware, software, and IT support to allow the demand forecasting function to operate effectively? For example, at one company we audited, the forecasting process required its sales teams, located across the world, to interact directly with the forecasting system on a monthly basis to adjust their baseline statistical forecasts. However, the sales teams found that they were waiting literally hours for their screens to load on their computers, and as a result, were not submitting forecasts. This company had “inadequate” infrastructure, and was at Stage 1. At a different company, the forecasting software was three upgrade levels behind at the time of our audit, and many capabilities were not being utilized because the upgrade was far down on the priority queue for IT support. This company was also at Stage 1. At still another company, the demand planning team had a dedicated IT support person, whose full-time job was to keep the system up-to-date with upgrades, and turnaround for requested enhancements was literally days, rather than weeks or months. This company had considerable hardware capacity for a very compute-intensive forecasting environment (hundreds of thousands of monthly forecasts at the SKU by location level of detail). This company had “superior” infrastructure, and was at Stage 4. Other companies have been somewhere in-between, with some having “minimal” infrastructure (Stage 2) and others having “acceptable” infrastructure (Stage 3).
Summary: How Companies Can Improve on the Systems Dimension
To review, the systems dimension answers the question, “What is the state of information technology support for the demand planning process?” Functional integration is about culture; approach is about process; systems is about tools. If you have highlighted too many Stage 1 or Stage 2 characteristics in the systems dimension, here are some steps that you can take to move your demand forecasting systems in the direction of being world class:
• Invest in integration. This is not to say that the only demand forecasting systems that companies should buy are those that are part of integrated supply chain suites. Some fine demand forecasting systems are “best-in-breed,” and they can integrate well into the firm’s overall IT architecture. However, when making forecasting system decisions, companies should pay considerable attention to the extent to which the forecasting system integrates into the company’s IT backbone, how it accesses the company’s data warehouse, and how it exchanges information with other corporate systems.
• Provide users with performance metrics. Because forecasting is a management process, performance metrics are critical, and without access to these performance metrics by people who need them, the process cannot be managed adequately.
• Make sure the forecasts are credible by ensuring data integrity. Few things can undermine the integrity of a forecast any faster than to have a user say, “Your data is not correct!” Integrating the forecasting process into the firm’s data warehouse strategy is critical.
• Invest in infrastructure. Companies find that investing in forecasting processes, and then skimping on services such as IT support and version upgrades, is “penny-wise and pound-foolish.”
One final word of caution concerning systems: I’ve stated quite strongly that “systems are not silver bullets.” In my experience, it is very common for a company to be unsatisfied with its forecasting efforts, and immediately try to solve the problems by buying and installing a forecasting system. Although not a scientifically proven hypothesis, my guess as to why this happens is that it is the easiest path to follow. When I say “easy,” I don’t mean that no work is involved in installing a system. Far from it. But in many companies, it’s a kind of work that people are familiar with. It lends itself to project management, to Pert charts and Gantt charts, and assignment of responsibility and deadlines and status reports. Changing culture is much more nebulous, and doesn’t lend itself nearly as well to familiar project management frameworks. Companies are often good at project management, but not good at change management. Installing a new culture is more challenging than installing a new system. Unfortunately, the culture change is usually much more impactful than the system change.
Performance Measurement
The final dimension to be examined in our discussion of world-class demand forecasting is performance measurement. This dimension answers the question, “How appropriately is demand forecasting performance measured and rewarded?” Functional integration is all about culture; approach is all about process, and systems is all about tools. Performance measurement ties these dimensions together. This final dimension is all about utilizing tools to measure processes, which influences culture. The performance measurement dimension has only two themes, as shown in Table 7-4: how performance is measured, and how performance is rewarded.

Table 7-4. Performance Measurement
How Is Performance Measured?
At Stage 1 companies, forecasting performance is not measured. When we work with a company, it is quite evident when the company is at Stage 1 on this first theme. Questions about forecasting accuracy are met with blank stares, or with answers like “Well, we certainly could do better,” or “Well, I think our accuracy is somewhere around 75%” (unless the person being interviewed is a “victim” of bad forecasts, in which case the answer is more like “Our accuracy is somewhere around 25%”!) Any reader who has made it this far in this book should recognize that not measuring forecasting performance is a problem!
At Stage 2 companies, accuracy is the focus of all performance measurement efforts, and the most common metric is Mean Absolute Percent Error (MAPE), or Mean Absolute Percent Accuracy, which is 1-MAPE. As discussed in length in Chapter 6, MAPE is the most common accuracy metric used, and it is completely appropriate, if measured correctly, as a “scorecard metric.” It is useful for tracking individual or group forecasting performance over time, and it is an appropriate surrogate for demand volatility, and thus useful for calculating safety stock levels. However, the main problem with a company being at Stage 2 is that bias is not measured. MAPE is an excellence scorecard metric, but not a very good diagnostic metric, and without the effort being put into examining bias, diagnosing systematic forecasting problems is often difficult.
Stage 3 companies add examination of bias into their routine performance measurement processes. Bias, which is most commonly measured using Percent Error (PE), and which is most effectively depicted graphically, is an excellent way to detect systematic forecasting problems. As discussed in Chapter 6, PE graphs can quickly point out individuals who have “other agendas” in regard to their forecasting responsibilities, such as salespeople who underforecast to influence sales targets, or brand managers who overforecast to increase their advertising budgets. Stage 3 companies, then, utilize both the scorecard capabilities of MAPE, and the diagnostic capabilities of PE graphs.
Finally, Stage 4 companies move beyond the “process metrics” such as MAPE and PE, and also consider the “outcome metrics” such as inventory turns, customer fill rates, and expediting costs, to help guide strategic decision making. As discussed in Chapter 6, no one buys or sells stock in a company because they’re good at forecasting. Rather, overall corporate performance is judged by outcome metrics. World-class companies use process metrics such as forecast accuracy to make good decisions about which products need to be carried in inventory in which locations, so as to balance cost and customer service needs.
How Is Performance Rewarded?
Stage 1 companies fail to follow the management maxim of “What gets measured gets rewarded, and what gets rewarded gets done.” At these companies, no effort is made to reward individuals for creating, or contributing to, accurate, unbiased forecasts. At one company we worked with, management was at least beginning to take the journey toward accountability for those who contribute to the forecasting process. At this company, salespeople were paid a bonus if they submitted their forecasts on time. Although this is arguably a “crawl before you walk” strategy, our team still judged this company to be Stage 1 on this theme.
Stage 2 in this theme is the most common place for a company in our database to be. Here, companies do in fact reward excellence in forecasting, but limit those rewarded to the individuals who work in the forecasting function. As discussed in Chapter 6, these rewards can come from either achieving a pre-determined accuracy target for their assigned product or customer forecasts, or they can come from period-over-period improvements. Although Stage 2 here is clearly superior to Stage 1, problems still remain. Forecasters often rely heavily on the insights contributed by sales, marketing, brand management, and senior executives, and if those individuals are not incentivized to provide accurate, unbiased forecasts, then the forecasters don’t have the tools necessary to achieve the best results possible. Stage 3 companies overcome this problem by providing incentives for everyone in the company who participates in the forecasting process. Individuals at Stage 3 companies, who work in sales, marketing, brand management, and even senior management, find that some element of their performance plan contains achievement of forecast accuracy goals.
Movement to Stage 4 in this theme requires that companies move beyond the process metrics, and work to influence the outcome metrics. Stage 4 companies have cross-functional metrics, and rewards, shared across the enterprise. For example, at one company in our database, individuals in the sales organization became accountable not only for forecast accuracy, but for finished goods inventory levels. This level of accountability helped the sales teams see that forecast accuracy in and of itself was not nearly as important as was the effect of that accuracy on important corporate goals. Implementation of this reward strategy reduced the amount of upward bias in the forecasts coming out of sales. In this case, “what got rewarded got done!”
Summary: How Companies Can Improve on the Performance Measurement Dimension
The final dimension of demand forecasting excellence is very straightforward but very important. I offer two simple statements to guide process improvement in this area:
• Measure performance
• Reward performance
Seems simple, right? Of course, if it were simple, companies would do it, and many don’t. In our experience of working with dozens of companies, measuring and rewarding the forecasting personnel is fairly easy. It is, however, quite rare for companies to reach Stage 3 in this dimension, and begin to include other functions such as sales, marketing, brand management, and senior leaders into the “measure and reward” process. Performance measurement describes how well companies utilize tools to measure processes that ultimately influence culture. Recall that culture represents 60% of the challenge to forecasting and DSI excellence, and measuring and rewarding performance is perhaps the most compelling tool available to change that culture.
Summary of World Class Forecasting
This chapter is far too long to neatly summarize in one short section. Rather than simply re-stating the main points from each of the dimensions of forecasting excellence that have been described, I summarize this discussion of world-class forecasting by summarizing the points made in an article published several years ago by our research team called, “The Seven Keys to Better Forecasting.”10 Although much has been added to our understanding of what constitutes world-class forecasting since this article was written, it does provide many useful insights about forecasting excellence, and as such, it constitutes a good way to summarize the discussion in this chapter. “The Seven Keys to Better Forecasting” (not to be confused with the Seven Deadly Sins!), are
10 Moon, Mark A., John T. Mentzer, Carlo D. Smith and Michael S. Garver (1998), “Seven Keys to Better Forecasting,” Business Horizons, (September–October), 44–52.
1. Understand what forecasting is, and what it is not. Forecasting is a management process; it is not a software program. Forecasting is a best guess about what future demand is likely to be; it is not a plan or a goal.
2. Forecast demand and plan supply. The focus of the demand forecasting process should be to try and anticipate future demand, or what customers would buy from us if they could. Too many companies limit their forecasting efforts to an estimate of what future sales will be. A strategic view that drives the supply chain, as well as the business as a whole, should be one that attempts to forecast actual demand.
3. Communicate, coordinate, collaborate. Important insights about future demand are available from a variety of sources: history, the judgment of experienced people, even customers. Creating a culture, and a process, where insights and information are freely shared, is critical to world-class forecasting.
4. Eliminate “islands of analysis.” Excel continues to the be the most popular software tool for demand forecasting, and with no disrespect toward the Microsoft Corporation, it is the wrong tool for this job. The “spreadsheet mania” seen at many companies inhibits effective cross-functional, multi-divisional, and global demand/supply integration. Although “tools” only drive 10% of DSI excellence, it’s a critical 10%, and getting the tools aligned is critical.
5. Use techniques wisely. Demand forecasters have a variety of forecasting techniques at their fingertips, and Chapters 3 and 4 are dedicated to these techniques. There are both quantitative technique (time-series, regression, causal modeling) and qualitative techniques (jury of executive opinion, Delphi methods, salesforce composite, customer forecasts). Using these techniques “wisely” means applying them in the circumstances and sequences that makes the most sense.
6. Make it important. For forecasting and demand planning to be effective, individuals must take it seriously. Resources must be made available, both human and financial. A company doesn’t see forecasting as important when it has 40,000 SKUs to forecast each month, and only three demand planners, or when a company won’t invest in the system infrastructure needed to do the job well, or when a company will not create reward structures for everyone who participates in the process. To make it important, the company has to. . .
7. Measure, measure, measure. “What gets measured gets rewarded, and what gets rewarded gets done.” Many of the problems in forecasting processes are fixed only when forecasting performance is measured. Forecasting is a management process, and like any management process, it cannot be managed well if it is not measured.
This concludes our discussion of what constitutes world-class forecasting. To bring this book full circle, we return to the topic first introduced in the book’s title and explained in great detail in Chapter 1, “Demand/Supply Integration.” Chapter 8 returns to the DSI topic by discussing how to best incorporate the excellent demand forecasts that have been created by following the ideas in Chapters 2 –7, by effectively managing the demand review.