
Case 10. Global Pharma: Managing Uncertainty
† Institute of Management Technology (IMT), Hyderabad, India; [email protected], [email protected]
‡ Institute of Management Technology (IMT), Hyderabad, India; [email protected]
Introduction
It was a sunny day in June, and Mr. Anil Roy had just joined one month back as Director (Operations) of Global Pharma, a Hyderabad-based pharmaceutical company. He was going through a file that Mr. Ajay Kumar, the Chief Executive Officer (CEO), had sent earlier. He noted that in the most recent year, Global Pharma’s bottom line had significantly deteriorated. This was due to high demand variability for one of the critical active pharmaceutical ingredients (APIs). It reminded him of a similar situation that he had dealt with in his earlier organization. However, he was apprehensive that a similar strategy might not work here. The scale and operational complexity of Global Pharma was quite large compared to his earlier organization. The downside of his decision could be disastrous for him as well as the organization.
Company Background
Global Pharma is a $2 million company headquartered in Hyderabad, India. It has three segments of business: generics, APIs, and pharmaceutical services. Its operations span across the entire pharmaceutical supply chain that includes development and manufacture of APIs, drug formulation, and packaging. The company has 20 manufacturing plants in India and exports to more than 40 countries worldwide. The majority of its revenue comes from the U.S., European and Middle Eastern markets.
The Indian Pharmaceutical Industry
The Indian pharmaceutical market size was estimated to be $11 billion in 2011–12. The market is expected to reach $74 billion by the year 2020, with a compounded annual growth rate of 15.3%. The top ten companies constitute about one-third of the market. The domestic market has been growing 15% per year, while the revenue of pharmaceutical multinational companies has been growing annually by 18.7%.
The Indian Pharmaceutical Supply Chain
The pharmaceutical supply chain in India consists of three distinct phases. The first phase involves production of APIs, which are the primary constituents of the drug. The second phase involves formulation of the drug. The third phase consists of the packaging process, which involves two types of packaging: primary and secondary. Primary packaging ensures that the drug is protected against direct external influences. This type of packaging primarily consists of blisters, bottles, vials, or syringes.
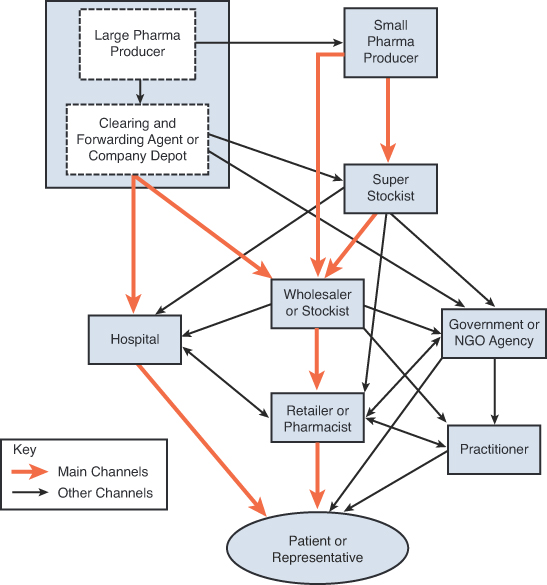
The distribution system is highly fragmented and complex, with more than 1,500 clearing and forwarding agents (CFAs), around 60,000 stockists (wholesalers), and approximately 550,000 retail pharmacies in the country. Most of the larger pharmaceutical companies have their own distribution centers or work with CFAs. The smaller companies distribute their products through a super stockist. A large pharmaceutical company generally has ties with about 25 CFAs in order to have a nationwide distribution network. Each CFA has an exclusive agreement with the company to maintain storage and distribution of its stock only. The CFAs are paid on an annual basis based on the total sales of their products. The CFAs distribute their stocks to the stockists. Stockists have the option of maintaining storage and distribution of products from multiple companies, typically five to six. Payment is made directly to the company, usually after one month. The retail pharmacies obtain stocks from a stockist or substockist and resell them to final customers (patients). (See Exhibit 10-1.)
The Problem
Roy was happy to be associated with Global Pharma as one of its directors. He was visibly excited by the fact that the Indian pharmaceutical industry was going through an unprecedented growth phase. However, that meant coping up with intense regulatory and inflationary pressures in addition to managing uncertainty in the supply chain. Though proper ERP systems were in place, Mr. Roy felt that the supply chain of Global Pharma was not equipped to handle uncertainties. Such uncertainties may take the form of demand fluctuations, delayed material availability, rejection in quality, or changes in regulatory norms.
In the previous year, Global Pharma had incurred significant losses because of its inability to forecast demand for one of its critical APIs. This had resulted in a stockout situation and had significantly affected sales of the drug. The resulting cost implications were too high. Roy had to make sure that stockouts do not occur this year. The company had only one supplier for the API, and the supplier took an average of 30 days to supply it. Roy thought of postponing his order placement decision to his supplier in anticipation of more accurate demand information. He swiftly accessed some important information from the ERP solution Global Pharma had been using for the last few years. He also made a call to his supplier of the critical API to discuss his intentions of postponing the order placement decision. The supplier responded that the postponement decision would reduce the available lead time to him, which would force his production and distribution costs to escalate in order to maintain the service-level requirements. In addition, he would still take a minimum of seven days to supply the critical API.
This escalation in the cost of production and distribution would lead to an increase in the purchasing cost of the critical API for Global Pharma. As the discussion continued, the supplier also provided an estimate about the expected escalations in the price of the critical API. He stated that the escalation in the price was a function of the number of days by which he had to shorten his lead time.
Based on the information gathered from the ERP and the discussion with the supplier, Mr. Roy wondered what the optimal level of postponement should be to minimize the total annual cost of inventory management. The summary of the information collected by Mr. Roy is provided in Table 10-1.

Table 10-1. Summary of Data Collected by Mr. Roy
Note: Demand and lead time are assumed to be approximately normally distributed.