
Chapter 4. Figures
Draw2D canvases contain figures, which in turn can contain “nested” figures (see Section 4.3.2 on page 35). Both the z-order and the nesting of each figure determine what portion of that figure is visible to the user and thus what portion must be rendered or painted (see Section 4.4.4 on page 40). For each figure, the painting process is broken into a few steps, including painting the client area, the children, and the border (see Section 4.4.2 on page 38). The Draw2D framework includes a number of common figures such as line, rectangle, polygon, and ellipse (see Section 4.2 on page 29). Complex figures can be created by nesting simpler figures and implementing figures with custom painting behavior. This chapter discusses the fundamentals of figures, and continues to develop our genealogy graph example.
4.1 IFigure
For an object to be rendered with a Draw2D canvas, it must implement the IFigure interface. This interface contains a number of different methods for things such as hit testing, positioning, nesting figures, and attaching listeners. When users interact with figures, there are a number of listeners and methods available to provide the appropriate behavior:
addFocusListener(FocusListener)
addKeyListener(KeyListener)
addMouseListener(MouseListener)
addMouseMotionListener(MouseMotionListener)
containsPoint(Point)
findFigureAt(Point)
hasFocus()
Figures can contain other “child” figures, and there are several listeners and methods for manipulating and interrogating this hierarchical relationship:
addAncestorListener(AncestorListener)
addCoordinateListener(CoordinateListener)
addFigureListener(FigureListener)
addLayoutListener(LayoutListener)
add(IFigure)
getChildren()
getParent()
isCoordinateSystem()
useLocalCoordinates()
And, finally, there are a number of basic attributes to which the IFigure interface provides access:
getBackgroundColor()
getBorder()
getBounds()
getClientArea()
getFont()
getForegroundColor()
getToolTip()
isOpaque()
isVisible()
setBackgroundColor(Color)
setBorder(Border)
setBounds(Rectangle)
setFont(Font)
setForegroundColor(Color)
setOpaque(boolean)
4.2 Common Figures
Draw2D provides dozens of figures (classes implementing IFigure) that can be composed or extended to build a wide range of two-dimensional drawings. Generally figures can be categorized into six major types:
• Shapes—drawings such as rectangles, triangles, and ellipses that share a common abstract superclass called Shape
• Clickables—figures that can be clicked, such as buttons and checkboxes, that share the common abstract superclass Clickable
• Containers—figures designed to group and position other figures, such as Panel and ScrollPane (see Chapter 5 on page 55 for more on layouts)
• Connections—figures that draw a line from one figure to another figure, such as PolylineConnection (see Chapter 6 on page 69 for more on connections and routing algorithms)
• Layered—transparent figures that are stacked to compose, such as Layer and LayeredPane (see Section 7.1 on page 91 for more information)
• Other—commonly used figures, such as ImageFigure and Label, that do not fit into these five categories
Some of the more commonly used shape and clickable classes are listed and shown in Figure 4–1. The Polyline shape is a line connecting a series of points, while the Polygon shape is closed and can be filled as a solid shape. Text can be displayed using a Label and rotated text using ImageFigure and the ImageUtilities.createRotatedImageOfString(...) method.
Figure 4–1. Basic Draw2D figures.
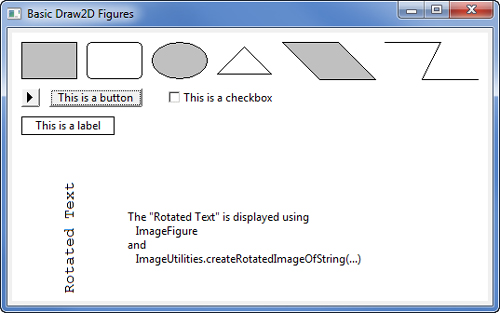
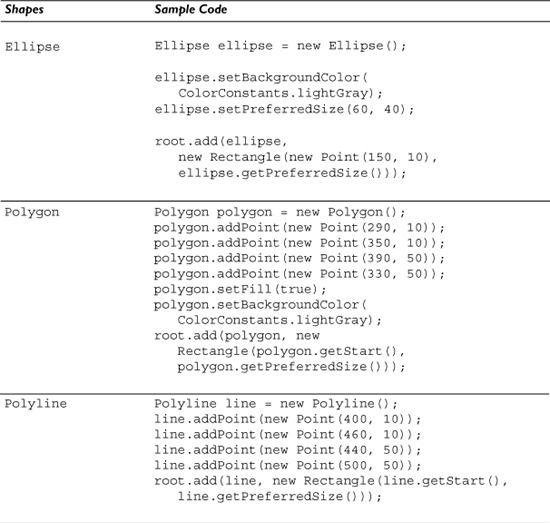
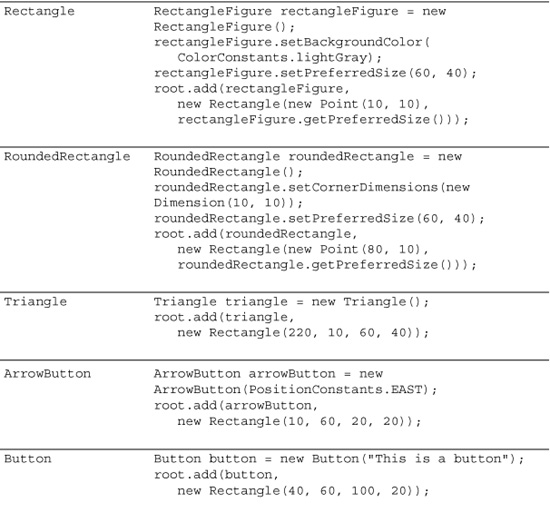
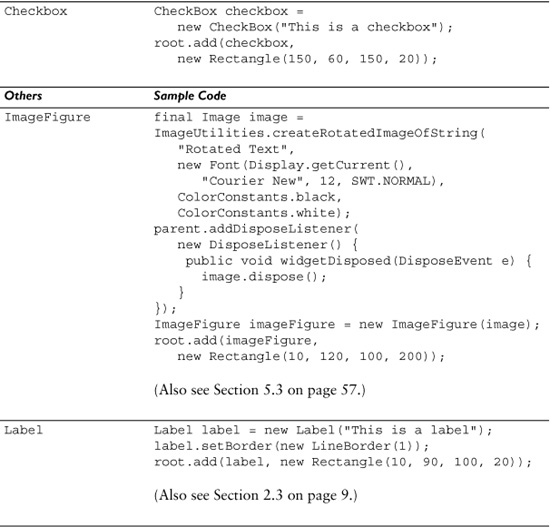
The code in Table 4–1 is extracted from the BasicFigures class which is used to display the figures in Figure 4–1.
4.3 Custom Figures
Complex figures can be built by combining simple figures and by creating your own figures to add custom painting and user interaction. When you can, it is considered best to compose provided figures instead of developing your own figures from scratch. When you do need to create your own figures, you could implement the IFigure interface directly, but it is recommended and easier to extend the Figure class and its subclasses as they provide much of the necessary infrastructure.
4.3.1 Extending Existing Figures
In Section 2.3 on page 9 we display a person by combining a rectangle figure with a label figure. In this section, we extract code out of the GenealogyView into new PersonFigure and MarriageFigure classes to make the code more manageable and allow us to enhance the information displayed for each person. Start by creating a new PersonFigure class and moving the createPersonFigure(String) method functionality into that new class. This new figure inherits its behavior from the existing RectangleFigure class.
package com.qualityeclipse.genealogy.figures;
import org.eclipse.draw2d.*;
import org.eclipse.draw2d.geometry.*;
import com.qualityeclipse.genealogy.listener.FigureMover;
public class PersonFigure extends RectangleFigure {
public PersonFigure(String name) {
setBackgroundColor(ColorConstants.lightGray);
setLayoutManager(new ToolbarLayout());
setPreferredSize(100, 100);
add(new Label(name));
new FigureMover(this);
}
}
Replace the call to createPersonFigure(String) with the new PersonFigure, and remove createPersonFigure(String) from the GenealogyView.
private Canvas createDiagram(Composite parent) {
... existing code ...
IFigure andy = new PersonFigure("Andy");
... existing code ...
IFigure betty = new PersonFigure("Betty");
... existing code ...
IFigure carl = new PersonFigure("Carl");
... existing code ...
}
To further reduce the complexity of the GenealogyView class, we create a new MarriageFigure similar to the PersonFigure and move the createMarriageFigure() method functionality into that new class. This new class inherits from PolygonShape where PersonFigure inherits from RectangleFigure.
package com.qualityeclipse.genealogy.figures;
import org.eclipse.draw2d.*;
import org.eclipse.draw2d.geometry.Rectangle;
import com.qualityeclipse.genealogy.listener.FigureMover;
public class MarriageFigure extends PolygonShape {
public MarriageFigure() {
Rectangle r = new Rectangle(0, 0, 50, 50);
setStart(r.getTop());
addPoint(r.getTop());
addPoint(r.getLeft());
addPoint(r.getBottom());
addPoint(r.getRight());
addPoint(r.getTop());
setEnd(r.getTop());
setFill(true);
setBackgroundColor(ColorConstants.lightGray);
// Add 1 to include width of the border otherwise
// the diamond's right and bottom tips are missing 1 pixel
setPreferredSize(r.getSize().expand(1, 1));
new FigureMover(this);
}
}
And as before, replace the existing calls to createMarriageFigure() with the new MarriageFigure.
private Canvas createDiagram(Composite parent) {
... existing code ...
IFigure marriage = new MarriageFigure();
... existing code ...
}
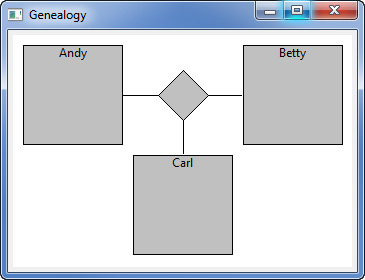
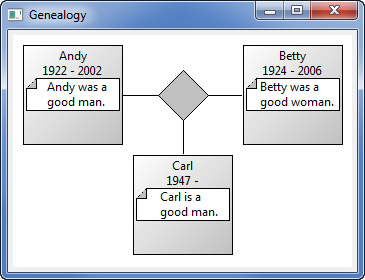
All the changes up to this point are internal, and the application displays and behaves in the same manner as at the end of Chapter 2 (see Figure 4–2).
Figure 4–2. The Genealogy view.
4.3.2 Adding Nested Figures
Each figure can contain child figures, also known as nested figures. Composing or “nested” figures is the most common way to build complex shapes and drawings using the common figures provided by Draw2D (see Section 4.2 on page 29). Each child figure is rendered within its parent’s client area (see Section 4.4.1 on page 37). Any portion of the child figure extending beyond the parent’s client area is clipped (see Section 4.4.5 on page 40).
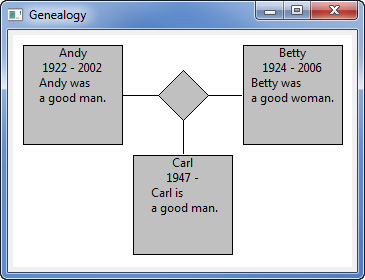
In our GenealogyView, we want to display more information about each person. To accomplish this, we add nested labels to show additional information such as the birth and death dates along with a comment about the person. The nested datesLabel figure displays the years of birth and death, and the noteLabel displays a comment. This change requires additional arguments in the PersonFigure constructor.
public PersonFigure(String name, int birthYear, int deathYear,
String note) {
... existing code ...
String datesText = birthYear + " -";
if (deathYear != -1)
datesText += " " + deathYear;
add(new Label(datesText));
Label noteLabel = new Label(note);
add(noteLabel);
new FigureMover(this);
}
This change requires that additional information be passed by the GenealogyView when creating these figures. Modify the createDiagram(Composite) method as follows:
private Canvas createDiagram(Composite parent) {
... existing code ...
IFigure andy = new PersonFigure("Andy",
1922, 2002, "Andy was a
good man.");
... existing code ...
IFigure betty = new PersonFigure("Betty",
1924, 2006, "Betty was a
good woman.");
... existing code ...
IFigure carl = new PersonFigure("Carl",
1947, -1, "Carl is a
good man.");
... existing code ...
}
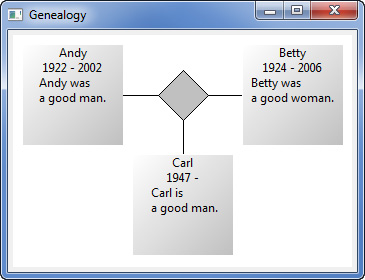
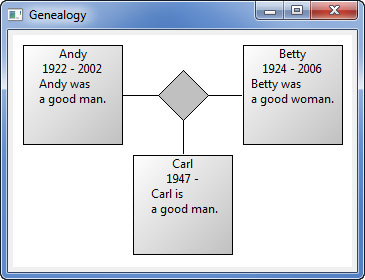
Now, additional information is displayed for each person in the application (see Figure 4–3).
Figure 4–3. Genealogy view showing extra details.
4.4 Painting
In Draw2D, each figure is rendered by calling its paint(...) method. The rendering is done in a pre-order depth-first manner: the figure is drawn, then its children are drawn, and finally the figure’s border (see Section 4.5 on page 42). Borders are drawn post-order, after the figure’s children, in the space between the bounds and the client area of the figure.
4.4.1 Bounds and Client Area
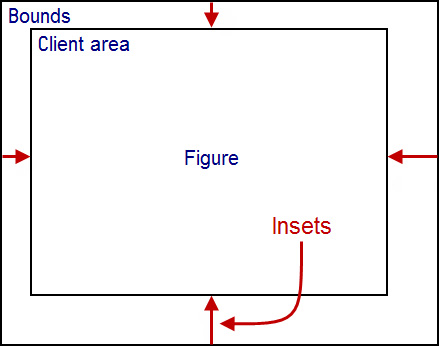
The figure’s client area is inset by zero or more pixels from the figure’s bounds (see Figure 4–4). The figure itself is rendered within its bounds, while the figure’s children, if any, are rendered within the figure’s client area. The border (see Section 4.5 on page 42), if there is one, is rendered after the figure and its children have been rendered, in the area between the bounds and the client area. If there is no border, then the client area equals the bounds.
Figure 4–4. Bounds and client area.
4.4.2 Paint Methods
In the Figure class, the paint(...) method renders the figure by calling the following methods in the following order. Other implementers of IFigure may not follow the same method-naming convention.
paintFigure(...)—renders the figure within the bounds of the figure
paintClientArea(...)—calls paintChildren(...) to render the child figures in the client area of the figure, adjusting the local coordinate system as necessary (see Section 7.3 on page 101)
paintChildren(...)—calls the paint(...) method on each child figure, saving and restoring the Graphics state (see Section 4.4.3 on page 39) to prevent unintentional graphics setting changes
paintBorder(...)—renders the figure’s border (see Section 4.5 on page 42)
4.4.3 Graphics
Figures render themselves by making calls to Draw2Ds’ Graphics object, which is a wrapper of the SWT GC class. Graphics provides support for drawing and filling in shapes, writing text, painting lines, images, and patterns. Graphics also supports saving its state on a stack and restoring its state from that stack, where its state includes information such as the foreground and background colors, line-drawing setting, the current origin, and font settings. Some of the more commonly used Graphics methods are
• Drawing
drawImage(...)
drawLine(...)
drawPolygon(...)
drawRectangle(...)
drawRoundRectangle(...)
drawText(...)
fillPolygon(...)
fillRectangle(...)
fillRoundRectangle(...)
fillText(...)
• Property access
getBackgroundColor(...)
getForegoundColor(...)
getLineStyle(...)
getLineWidth(...)
• Saving state
popState(...)
pushState(...)
restoreState(...)
4.4.4 Z-Order
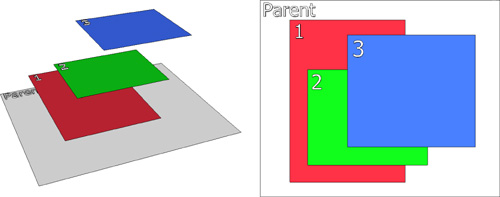
Child figures are rendered after their parent and before their parent’s border. Visualize the screen as having three axes, the x-axis, y-axis, and z-axis, with the z-axis extending out of the screen perpendicular to the other axes. Now visualize the figures arranged along the z-axis in the order in which they are rendered. The order in which the figures are rendered, also known as the z-order, creates the illusion that some figures are on top of other figures. Those children earlier in the list are lower in the z-order and appear to be behind those children that are later in the parent’s list of children.
For example, in Figure 4–5 a parent figure contains three child figures. The first child is rendered first, thus appearing below the second child. On the left of the figure is displayed a 3D visualization of z-order as it would appear from the side, and on the right appear the parent and its three children as they would be rendered on the screen.
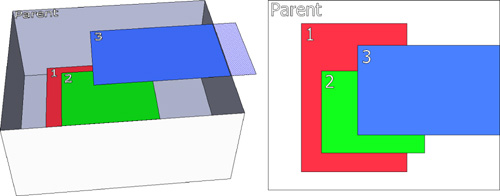
4.4.5 Clipping
Figures are rendered within their parent’s client area. Any portion of the child figure that lies outside its parent’s client is clipped or cropped and not rendered on the screen. For example, in Figure 4–6 the third child extends beyond the parent’s client area and only the portion within the parent’s client area would be rendered on the screen. On the left is displayed a 3D visualization of the parent and its children as they would appear from the side with a portion of the third child’s area extending beyond the parent’s client area; on the right appear the parent and its three children as they would be rendered on the screen.
4.4.6 Custom Painting
In our GenealogyView example, we want the PersonFigure to have a gray gradient background rather than solid gray. Unfortunately, our PersonFigure does not have an applicable API for this, so we need to implement the paintFigure method (see Section 4.4.2 on page 38) as shown below. This gradient paints a gradient from the top left corner with the color white, down to the bottom right corner with the color lightGray. For this to compile properly, we also need to add some imports.
import org.eclipse.swt.graphics.Pattern;
import org.eclipse.swt.widgets.Display;
public void paintFigure(Graphics graphics) {
Rectangle r = getBounds();
graphics.setBackgroundPattern(new Pattern(Display.getCurrent(),
r.x, r.y, r.x + r.width, r.y + r.height,
ColorConstants.white, ColorConstants.lightGray));
graphics.fillRectangle(r);
}
With these changes, the gradient appears, but the borders are missing (see Figure 4–7).
Figure 4–7. Genealogy view showing gradients.
At this point, none of the additional behavior provided by the RectangleFigure class is useful, so we extend the more abstract Figure class instead. The setBackgroundColor(...) call is unnecessary and can be removed since we are rendering the background ourselves and not using the background color property.
public class PersonFigure extends Figure {
public PersonFigure(String name, int birthYear, int deathYear,
String note) {
setBackgroundColor(ColorConstants.lightGray);
... existing code ...
}
4.5 Borders
Borders are rendered after the figure and its children have been rendered. Some figures, such as RectangleFigure, draw a line to denote their outline that appears to be a border but is not implemented as a border. That is why, when we overrode the paintFigure(...) method (see Section 4.4.2 on page 38), the PersonFigure acquired a gradient background but lost the line outlining the shape.
4.5.1 Common Borders
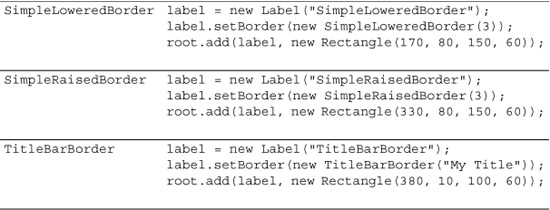
Some of the more commonly used border types are listed and shown in Figure 4–8. The CompoundBorder can be used to compose multiple borders. It is typically used to combine a visual border such as GroupBoxBorder with MarginBorder to inset a figure’s child elements by a fixed number of pixels.
Figure 4–8. Basic Draw2D borders.
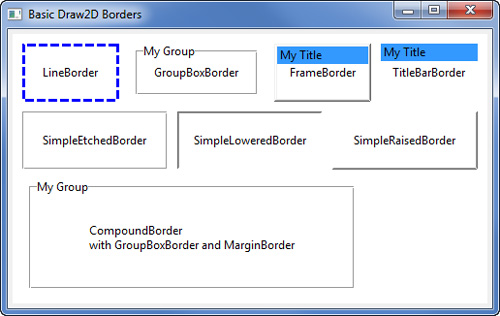
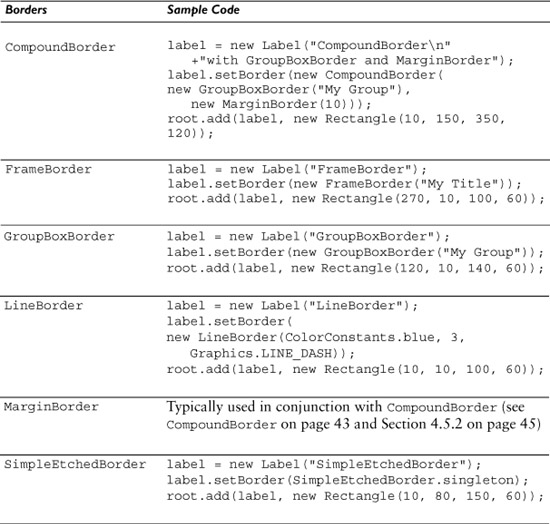
The code in Table 4–2 is extracted from the BasicBorders class, which is used to display the borders in Figure 4–8.
We want a simple line around our PersonFigure. To accomplish this, add a call to setBorder(...) passing an instance of LineBorder.
public PersonFigure(String name, int birthYear, int deathYear,
String note) {
setLayoutManager(new ToolbarLayout());
setPreferredSize(100, 100);
setBorder(new LineBorder(1));
This restores the line around the outside of the PersonFigure (see Figure 4–9).
Figure 4–9. Genealogy view showing borders.
4.5.2 Custom Borders
With so many Labels stacked on top of each other, the PersonFigure has become a bit cluttered. To separate the comment from the rest of the personal information, we could use a LineBorder, but that would draw a line around the entire comment, which is not quite what we want. Instead, modify the noteLabel as follows to draw a custom border and align the text to the left:
public PersonFigure(String name, int birthYear, int deathYear,
String note) {
... existing code ...
Label noteLabel = new Label(note) {
protected void paintBorder(Graphics graphics) {
Rectangle r = getBounds();
graphics.drawLine(r.x, r.y, r.x + r.width, r.y);
}
public Insets getInsets() {
// top, left, bottom, right
return new Insets(2, 0, 0, 0);
}
};
add(noteLabel);
... existing code ...
}
Now the PersonFigure is a bit more readable (see Figure 4–10).
Figure 4–10. Notes showing borders.
It would be better if this border functionality was not part of the PersonFigure, so start by extracting it into a new NoteBorder class. After we enhance NoteBorder to look a bit like a note with a folded corner, the new class should look like the following:
package com.qualityeclipse.genealogy.borders;
import org.eclipse.draw2d.*;
import org.eclipse.draw2d.geometry.*;
import org.eclipse.swt.SWT;
public class NoteBorder extends AbstractBorder {
public static final int FOLD = 10;
public Insets getInsets(IFigure figure) {
return new Insets(1, 2 + FOLD, 2, 2); // top,left,bottom,right
}
public void paint(IFigure figure, Graphics graphics,
Insets insets) {
Rectangle r = figure.getBounds().getCopy();
r.crop(insets);
graphics.setLineWidth(1);
// solid long edges around border
graphics.drawLine(r.x + FOLD, r.y, r.x + r.width - 1, r.y);
graphics.drawLine(r.x, r.y + FOLD, r.x, r.y + r.height - 1);
graphics.drawLine(r.x + r.width - 1, r.y, r.x + r.width - 1,
r.y + r.height - 1);
graphics.drawLine(r.x, r.y + r.height - 1, r.x + r.width - 1,
r.y + r.height - 1); // solid short edges
graphics.drawLine(r.x + FOLD, r.y, r.x + FOLD, r.y + FOLD);
graphics.drawLine(r.x, r.y + FOLD, r.x + FOLD, r.y + FOLD);
// gray small triangle
graphics.setBackgroundColor(ColorConstants.lightGray);
graphics.fillPolygon(new int[] { r.x, r.y + FOLD, r.x + FOLD,
r.y, r.x + FOLD, r.y + FOLD });
// dotted short diagonal line
graphics.setLineStyle(SWT.LINE_DOT);
graphics.drawLine(r.x, r.y + FOLD, r.x + FOLD, r.y);
}
}
Next, modify the PersonFigure to use this new border class rather than having the border functionality in an anonymous inner class. In addition, we use a CompoundBorder and MarginBorder to inset the PersonFigure’s content appropriately.
import com.qualityeclipse.genealogy.borders.NoteBorder;
... existing code ...
public PersonFigure(String name, int birthYear, int deathYear,
String note) {
... existing code ...
setBorder(new CompoundBorder(
new LineBorder(1),
new MarginBorder(2, 2, 2, 2)));
... existing code ...
Label noteLabel = new Label(note);
noteLabel.setBorder(new NoteBorder());
add(noteLabel);
... existing code ...
}
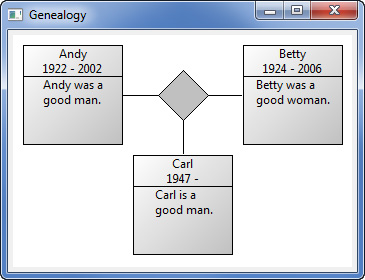
Now each note appears in its own border (see Figure 4–11).
Figure 4–11. Notes showing improved borders.
Now that each note has its own border, we can extract the note functionality into its own figure class. This allows us to add multiple notes per person and add notes to the GenealogyView itself. Start by extracting the functionality into a separate NoteFigure class and add a white background color.
package com.qualityeclipse.genealogy.figures;
import org.eclipse.draw2d.*;
import org.eclipse.draw2d.geometry.*;
import com.qualityeclipse.genealogy.borders.NoteBorder;
public class NoteFigure extends Label {
public NoteFigure(String note) {
super(note);
setOpaque(true);
setBackgroundColor(ColorConstants.white);
setBorder(new NoteBorder());
}
}
Next, modify PersonFigure to use this new NoteFigure class.
public PersonFigure(String name, int birthYear, int deathYear,
String note) {
... existing code ...
Label noteLabel = new Label(note);
noteLabel.setBorder(new NoteBorder());
add(noteLabel);
add(new NoteFigure(note));
... existing code ...
}
Now each note appears in its own border with a white background (see Figure 4–12).
Figure 4–12. Notes showing different background.
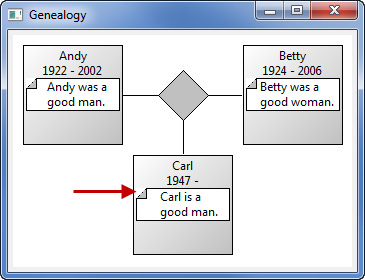
This looks good except for the fact that part of the white note background is drawn outside of the note border (see arrow in Figure 4–12). If you change the NoteFigure’s background color to green, then the flaw becomes very apparent. To fix this, remove the calls to setOpaque(...) and setBackgroundColor(...) in NoteFigure and override paintFigure(...) to paint the background within the border.
public NoteFigure(String note) {
super(note);
setOpaque(true);
setBackgroundColor(ColorConstants.white);
setBorder(new NoteBorder());
}
protected void paintFigure(Graphics graphics) {
graphics.setBackgroundColor(ColorConstants.white);
Rectangle b = getBounds();
final int fold = NoteBorder.FOLD;
graphics.fillRectangle(b.x + fold, b.y, b.width - fold, fold);
graphics.fillRectangle(b.x, b.y + fold, b.width, b.height - fold);
super.paintFigure(graphics);
}
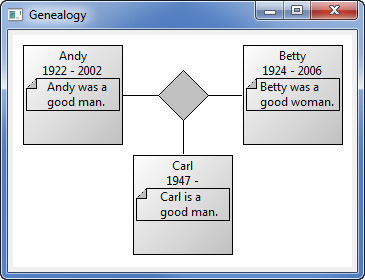
The note’s background is now drawn correctly (see Figure 4–13).
Figure 4–13. Notes showing improved background.
Now that notes are extracted from PersonFigure, we can refactor the example to allow multiple notes per person and notes in the GenealogyView itself. Start by removing the note argument and references to NoteFigure from the PersonFigure constructor. In addition, modify the PersonFigure layout so that multiple notes are spaced one pixel apart.
public PersonFigure(String name, int birthYear, int deathYear,
String note) {
final ToolbarLayout layout = new ToolbarLayout();
layout.setSpacing(1);
setLayoutManager(layout);
setPreferredSize(100, 100);
setBorder(new CompoundBorder(
new LineBorder(1),
new MarginBorder(2, 2, 2, 2)));
// Display the name as a nested figure
add(new Label(name));
// Display the year of birth and death
String datesText = birthYear + " -";
if (deathYear != -1)
datesText += " " + deathYear;
add(new Label(datesText));
// Display the note
add(new NoteFigure(note));
new FigureMover(this);
}
Next, modify the GenealogyView createDiagram(...) method to remove the note argument from the PersonFigure constructor and replace it with a new NoteFigure instance. We also add a second note to Carl and a “loose” note to the GenealogyView itself.
private Canvas createDiagram(Composite parent) {
... existing code ...
IFigure andy = new PersonFigure("Andy", 1922, 2002);
andy.add(new NoteFigure("Andy was a
good man."));
... existing code ...
IFigure betty = new PersonFigure("Betty", 1924, 2006);
betty.add(new NoteFigure("Betty was a
good woman."));
... existing code ...
IFigure carl = new PersonFigure("Carl", 1947, -1);
carl.add(new NoteFigure("Carl is a
good man."));
carl.add(new NoteFigure("He lives in
Boston, MA."));
... existing code ...
// Add a "loose" note
NoteFigure note = new NoteFigure("Smith Family");
note.setFont(parent.getFont());
final Dimension noteSize = note.getPreferredSize();
root.add(note, new Rectangle(
new Point(10, 220 - noteSize.height), noteSize));
... existing code ...
}
Tip
Whenever you call the getPreferredSize() method on a figure that is or contains a label before that label is added to the diagram, be sure to call setFont(...) prior to calling getPreferredSize(). In the example code above, if we removed the setFont(...) method, the code would continue to work, but if we added a second note in the same manner without calling setFont(...), then the example would throw an exception. More specifically, changing the above to
// Add a "loose" noteNoteFigure note = new NoteFigure("Smith Family");// note.setFont(parent.getFont());Dimension noteSize = note.getPreferredSize();root.add(note, new Rectangle(new Point(10, 220 -noteSize.height), noteSize));// Second "loose" notenote = new NoteFigure("Another note");//note.setFont(parent.getFont());noteSize = note.getPreferredSize();root.add(note, new Rectangle(new Point(10, 170),noteSize));
will throw the following exception:
Exception in thread "main" java.lang.NullPointerException at o.e.d.FigureUtilities.setFont(FigureUtilities.java:327) ato.e.d.FigureUtilities.getTextDimension(FigureUtilities.java:87) at o.e.d.FigureUtilities.getTextExtents(FigureUtilities.java:125) at o.e.d.TextUtilities.getTextExtents(TextUtilities.java:57) at o.e.d.Label.calculateTextSize(Label.java:244) at o.e.d.Label.getTextSize(Label.java:457) at o.e.d.Label.getPreferredSize(Label.java:329) at o.e.d.Figure.getPreferredSize(Figure.java:725) at c.q.g.view.GenealogyView.createDiagram(GenealogyView.java:78) at c.q.g.view.GenealogyView.main(GenealogyView.java:112)
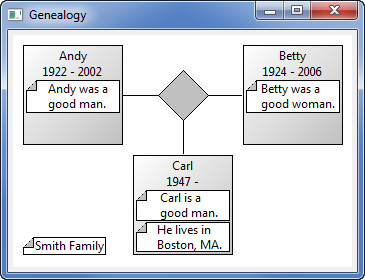
With these changes, the GenealogyView looks like Figure 4–14.
Figure 4–14. Genealogy view showing multiple notes.
4.6 Summary
Figures are the base elements for everything displayed in Draw2D. Figures can contain nested figures; the parts of the figure are drawn in a very particular order by Draw2D; figures have a z-order relationship with their siblings; they may have borders; many common figures and borders are provided; custom figures can be painted by using Graphics painting utilities.
References
Chapter source (see Section 2.6 on page 20).
Clayberg, Eric, and Dan Rubel, Eclipse Plug-ins, Third Edition. Addison-Wesley, Boston, 2009.
GEF and Draw2D Plug-in Developer Guide, Eclipse Documentation (see http://help.eclipse.org/).
Moore, Bill, David Dean, Anna Gerber, Gunnar Wagenknecht, and Philippe Vanderheyden, Eclipse Development Using the Graphical Editing Framework and the Eclipse Modeling Framework. IBM Redbooks, February 2004.