
Chapter 7. Layers and Viewports
Our canvas presents a rather limited space. How should we nicely display our genealogy once we have 10, 100, 1000 more people represented? How should we see the “big picture” when we display a large number of people? How do we prevent connections from creating a mess of overlapping lines? In this chapter we explore layering, coordinates, and scaling to solve these issues.
7.1 Layers
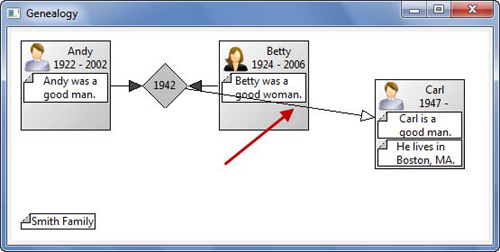
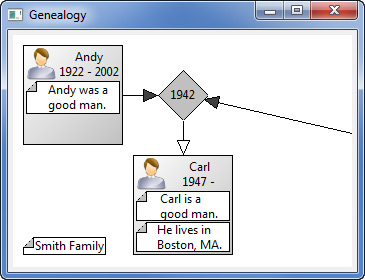
Up to this point, all our figures, including connections, have resided in a single root figure. This keeps things simple but unfortunately means that we cannot use the ShortestPathConnectionRouter (see Section 6.4.5 on page 85) to properly route all connections around person and note figures. Currently, when one PersonFigure is positioned between a MarriageFigure and a different connected PersonFigure, the connection overlaps the PersonFigure (see Figure 7–1). To solve this, we follow the traditional Draw2D approach and move connections and content into separate layers (see Section 7.1.1 on page 92), then use ShortestPathConnectionRouter to route connections.
Figure 7–1. Genealogy view showing direct connection.
7.1.1 LayeredPane
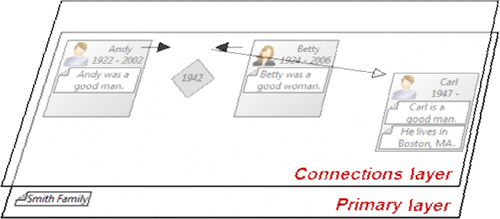
In a typical Draw2D application, the root figure is a LayeredPane that contains two or more child figures that must be instances of Layer or one of its subclasses (see Figure 7–2). These layers are stacked one atop another so that figures in higher layers appear in the same space as figures in the layers below (see Section 5.3.5 on page 61). Usually a ConnectionLayer contains all of the connections (see Section 7.1.2 on page 93), and a Layer below contains all of the “content.” This separation allows specialized connection routers such as ShortestPathConnectionRouter (see Section 6.4.5 on page 85) to properly route all connections so that no connections intersect figures in the content layer.
Figure 7–2. Diagram showing primary layer and connections layer.
To modify our GenealogyView example so that it uses layers, start by renaming the local variable “root” to “primary” in the createDiagram(...) method and changing it from a local variable to a field. Then create a new “root” LayeredPane field to which the primary layer is added. Change the primary layer type from Figure to Layer and set the font on the “root” rather than the “primary.”
LayeredPane root;
Layer primary;
private Canvas createDiagram(Composite parent) {
root = new LayeredPane();
root.setFont(parent.getFont());
primary = new Layer();
primary.setLayoutManager(new XYLayout());
root.add(primary, "Primary");
... existing code except adding figures to "primary"
rather than "root" ...
lws.setContents(root);
return canvas;
}
7.1.2 ConnectionLayer
ConnectionLayer is a specialized layer that contains connections. When a connection is added to this layer, the connection router (see Section 6.4 on page 80) for that connection is automatically set to the connection router for the layer. In this way, all of the connections in this layer share the same connection router.
In our GenealogyView example, the next modification is to instantiate a new connection layer and add it to the “root” LayeredPane. Any connections that were added to the primary layer should be added to the connection layer instead. In addition, set the connection router for this layer to be an instance of ShortestPathConnectionRouter.
ConnectionLayer connections;
private Canvas createDiagram(Composite parent) {
... instantiate "root" and "primary" ...
connections = new ConnectionLayer();
connections.setConnectionRouter(
new ShortestPathConnectionRouter(primary));
root.add(connections, "Connections");
... existing code ...
connections.add(marriage.addParent(andy));
connections.add(marriage.addParent(betty));
connections.add(marriage.addChild(carl));
... existing code ...
}
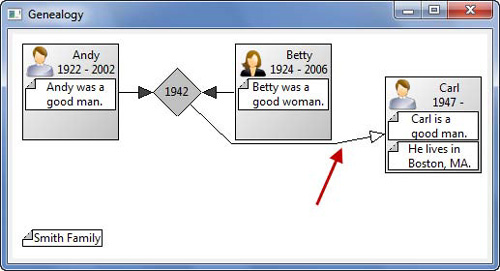
Now, when the various PersonFigures are dragged around the diagram, the connections are automatically rerouted so that they do not intersect any PersonFigure (see Figure 7–3).
Figure 7–3. Genealogy view showing automatically routed connection.
7.1.3 Hit Testing
When the user clicks the mouse, the Draw2D infrastructure calls the containsPoint(...) and findFigureAt(...) methods to determine which figure should receive the click. By default, each figure’s containsPoint(...) method returns true to indicate that the figure should receive the click if the click occurred within that figure’s bounding box. So, if the connection layer is on top of the primary layer (see Figure 7–2), then how do any of the figures in the primary layer receive a mouse click and trigger the FigureMover (see Section 2.5 on page 17)?
Layers are semitransparent, allowing mouse clicks to pass through if they do not intersect one of that layer’s children. The Layer class extends Figure and overrides both the containsPoint(...) and findFigureAt(...) methods, so that if a mouse click does not intersect a child, then the method returns false or null respectively, indicating that the Draw2D system should look to the next layer to find a figure. If you would like all the figures in a layer to be transparent so that a mouse click passes through, then override that layer’s containsPoint(...) method to always return false.
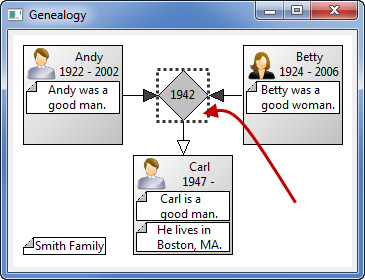
In our GenealogyView example, the MarriageFigure has a hit test problem. If you click outside the MarriageFigure’s diamond but inside its bounding box, you can still drag the figure around (see Figure 7–4).
Figure 7–4. Genealogy view showing hit test problem.
The underlying issue is that our MarriageFigure’s hit testing is returning true when it should not. This is because a Figure’s hit testing delegates to its children and the MarriageFigure’s one child, an instance of Label, is returning true, indicating that the click is contained within the Label and thus the MarriageFigure. To solve this, we override the Label’s containsPoint(...) method when we construct the MarriageFigure.
public MarriageFigure(int year) {
... existing code ...
add(new Label(Integer.toString(year)) {
public boolean containsPoint(int x, int y) {
return false;
}
});
new FigureMover(this);
}
7.2 Scrolling
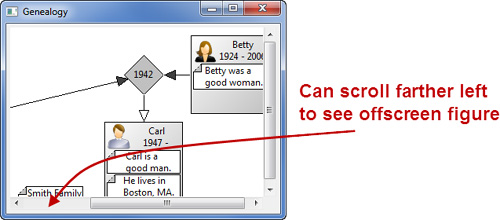
Currently, our Genealogy example has a limited area in which figures can be placed. We can expand the window but are limited by the current screen size. There are no scrollbars. If we drag a figure outside the window, we cannot scroll to see and reselect that figure (see Figure 7–5).
Figure 7–5. Genealogy view showing limited area for figures.
7.2.1 FigureCanvas
The FigureCanvas class extends Canvas and dynamically displays scrollbars if the underlying figure is larger than the display area. Make the following modifications to the GenealogyView’s createDiagram(...) method, replacing Canvas with FigureCanvas.
private FigureCanvas createDiagram(Composite parent) {
... existing code ...
FigureCanvas canvas = new FigureCanvas(parent,
SWT.DOUBLE_BUFFERED);
canvas.setBackground(ColorConstants.white);
canvas.setContents(root);
return canvas;
}
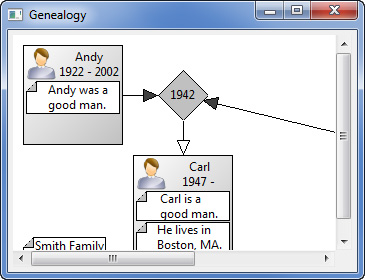
Now, when a figure is dragged to the right outside the displayable area, scrollbars appear so that you can scroll to see the figure in its new location (see Figure 7–6).
Figure 7–6. Genealogy view with scrollbars.
7.2.2 Viewport
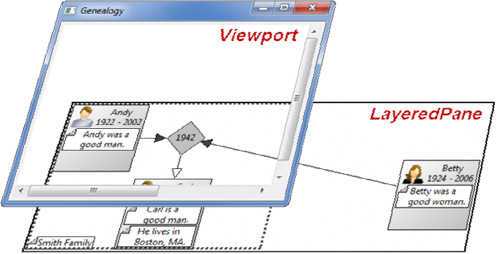
Behind the scenes, FigureCanvas automatically creates a Viewport for showing a portion of the underlying figure, which in our case is an instance of LayeredPane (see Figure 7–7). As the dimensions of the underlying figure change, the FigureCanvas adjusts the scrollbars. As the user drags the scrollbars, the FigureCanvas adjusts the portion of the underlying figure being displayed in the Viewport.
Figure 7–7. Diagram showing viewport into larger canvas.
7.2.3 FreeformFigure
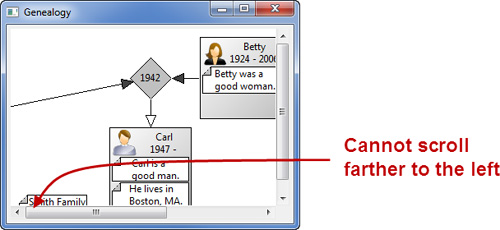
Once the FigureCanvas modifications are in place as specified in the prior sections, the scrollbars appear as a figure is dragged to the right but do not disappear when the figure is dragged back to the left. In fact, the virtual size of the canvas expands as figures are moved around but never shrinks to fit the current space occupied by the figures. In addition, if a figure is dragged off the left or top edge of the diagram, the Viewport cannot be scrolled in that direction and the figure is now inaccessible (see Figure 7–8).
Figure 7–8. Genealogy view showing scrolling problem.
The underlying problem is that our current figure containers do not adjust their bounds or display child figures that are positioned at negative coordinates. Figures that implement the FreeformFigure interface display figures in negative coordinate space and dynamically update their bounds as their child figures are repositioned and resized. In the next several sections, we modify our Genealogy example to use concrete classes implementing FreeformFigure to solve this problem.
7.2.4 FreeformLayer
Step one is to replace our primary Layer with a primary FreeformLayer that implements the FreeformFigure interface (see Section 7.2.3 on page 98). As the figures are repositioned and resized, the FreeformLayer adjusts its bounds to be the smallest rectangle that encloses all of its children. In addition, the layout manager for this primary layer must be changed to FreeformLayout. Make the following modifications in the createDiagram(...) method:
FreeformLayer primary;
private FigureCanvas createDiagram(Composite parent) {
... existing code ...
primary = new FreeformLayer();
primary.setLayoutManager(new FreeformLayout());
root.add(primary, "Primary");
... existing code ...
}
7.2.5 FreeformLayeredPane
Now that our primary layer is a FreeformLayer, the next step is to replace the LayeredPane with a FreeformLayeredPane so that it too will adjust its bounds as its children’s bounds change. A FreeformLayeredPane can only contain figures that implement the FreeformFigure interface, but since we modified the primary layer in the prior section and the ConnectionLayer (see Section 7.1.2 on page 93) already implements FreeformFigure, we are ready to proceed. Make the following modifications in the createDiagram(...) method:
FreeformLayeredPane root;
private FigureCanvas createDiagram(Composite parent) {
root = new FreeformLayeredPane();
root.setFont(parent.getFont());
... existing code ...
}
7.2.6 FreeformViewport
FreeformViewport extends Viewport with the ability to observe the freeform extent of its FreeformFigure content and adjust the scrollbars based on this information. Add a call to setViewport(...) to the createDiagram(...) method.
private FigureCanvas createDiagram(Composite parent) {
... existing code ...
FigureCanvas canvas = new FigureCanvas(parent,
SWT.DOUBLE_BUFFERED);
canvas.setViewport(new FreeformViewport());
canvas.setBackground(ColorConstants.white);
canvas.setContents(root);
return canvas;
}
Once the changes from the prior several sections are in place, the GenealogyView will properly adjust the scrollbars so that the entire area occupied by its figures is viewable (see Figure 7–9).
Figure 7–9. Genealogy view showing automatically adjusting scrollbars.
7.3 Coordinates
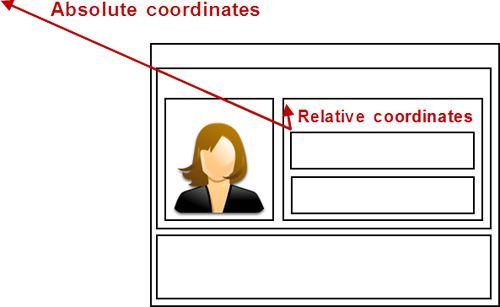
Relative (or local) coordinates are measured in terms of the top left corner of a figure’s parent. In contrast, absolute coordinates are measured in terms of the top left corner of the root figure (see Figure 7–10). The IFigure interface provides several methods for translating coordinates:
• translateToParent(...)—translates coordinates that are relative to this figure into coordinates relative to its parent
• translateFromParent(...)—translates coordinates that are relative to this figure’s parent into coordinates that are relative to this figure
• translateToAbsolute(...)—translates coordinates that are relative to this figure into coordinates that are relative to the root figure
• translateToRelative(...)—translates coordinates that are relative to the root figure into coordinates that are relative to this figure
Figure 7–10. Diagram showing coordinate systems.
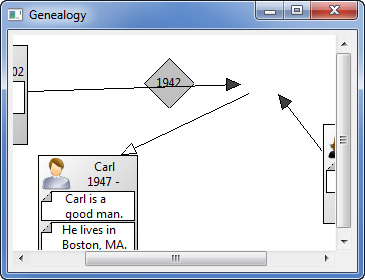
Now let’s investigate a bit of curious behavior. If we launch the GenealogyView and drag the MarriageFigure around without scrolling, then all is well. If we move a PersonFigure off to the right, scroll the viewport to the right, and then drag the MarriageFigure, the connections no longer line up with the edges of the MarriageFigure (see Figure 7–11). Why?
Figure 7–11. Genealogy view showing scrolling problem.
We start by investigating MarriageAnchor, or more specifically the ConnectionAnchor interface indirectly implemented by MarriageAnchor. The ConnectionAnchor getLocation(...) method has the following Javadoc:
/**
* Returns the location where the Connection should be
* anchored in absolute coordinates. The anchor may use
* the given reference Point to calculate this location.
* @param reference The reference Point in absolute
* coordinates
* @return The anchor's location
*/
Point getLocation(Point reference);
The Javadoc indicates that the point returned by our MarriageAnchor should be in absolute coordinates. If the viewport is not scrolled, then the relative location of the MarriageFigure happens to match its absolute location. When the viewport is scrolled to the right, then the relative location and the absolute location are different; thus we see the curious behavior (shown in Figure 7–11). In our MarriageAnchor getLocation(...) method, we get the center of our MarriageFigure but we forgot to translate that point into absolute coordinates. Make the following change to the MarriageAnchor getLocation(...) method:
public Point getLocation(Point reference) {
Point origin = getOwner().getBounds().getCenter();
getOwner().translateToAbsolute(origin);
... existing code ...
}
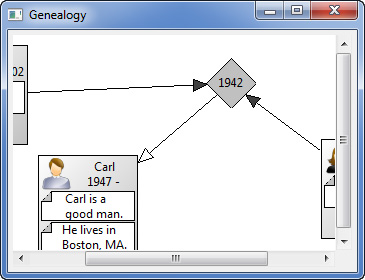
Once these changes are complete, the connections to the MarriageFigure again appear in the correct locations (see Figure 7–12).
Figure 7–12. Genealogy view showing correct connections after scrolling.
7.4 Scaling
Our Genealogy example can scroll, but if we add lots of figures to the diagram we will not be able to see the entire diagram at one time. Scaling (or zooming) solves this problem by shrinking (zooming out) the diagram so that more of it can be displayed in the window but with lower fidelity. In addition, you can expand (zoom into) the diagram to see more detail but less of the overall diagram.
7.4.1 ScalableFigure
ScalableFigure extends the IFigure interface to add methods for getting and setting the scale for that figure. A scale of 1 is “normal” or 1 : 1. Set the scale to a fraction between 0 and 1 to zoom out and see more of the figure’s content with less fidelity. To zoom in and see more detail but less of the overall diagram, set the scale to a number greater than 1.
7.4.2 ScalableFreeformLayeredPane
ScalableFreeformLayeredPane replaces the FreeformLayeredPane we are currently using with a LayeredPane that scales and dynamically adjusts its bounds to the smallest rectangle enclosing all of its children. Make the following change to the GenealogyView createView(...) method:
ScalableFreeformLayeredPane root;
private FigureCanvas createDiagram(Composite parent) {
// Create a layered pane along with primary and connection layers
root = new ScalableFreeformLayeredPane();
root.setFont(parent.getFont());
... existing code ...
}
7.4.3 Zoom Menu
Now we need a way to modify the scale factor. Modify the run() method to call a new createMenuBar(...) method.
private void run() {
... existing code ...
FigureCanvas canvas = createDiagram(shell);
canvas.setLayoutData(new GridData(GridData.FILL_BOTH));
createMenuBar(shell);
... existing code ...
}
The new createMenuBar(...) method adds a menu bar, a Zoom menu, and menu items for zooming the diagram in and out. Add the following method to the GenealogyView:
private void createMenuBar(Shell shell) {
final Menu menuBar = new Menu(shell, SWT.BAR);
shell.setMenuBar(menuBar);
MenuItem zoomMenuItem = new MenuItem(menuBar, SWT.CASCADE);
zoomMenuItem.setText("Zoom");
Menu zoomMenu = new Menu(shell, SWT.DROP_DOWN);
zoomMenuItem.setMenu(zoomMenu);
createFixedZoomMenuItem(zoomMenu, "50%", 0.5);
createFixedZoomMenuItem(zoomMenu, "100%", 1);
createFixedZoomMenuItem(zoomMenu, "200%", 2);
createScaleToFitMenuItem(zoomMenu);
}
The method above calls two other methods to create the various Zoom menu items. The createFixedZoomMenuItem(...) is called three times to add menu items that, when selected, set the root figure’s scale to the following fixed values:
• 100%—root.setScale(1)
• 200%—root.setScale(2)
private void createFixedZoomMenuItem(Menu menu, String text,
final double scale) {
MenuItem menuItem;
menuItem = new MenuItem(menu, SWT.NULL);
menuItem.setText(text);
menuItem.addSelectionListener(new SelectionListener() {
public void widgetSelected(SelectionEvent e) {
root.setScale(scale);
}
public void widgetDefaultSelected(SelectionEvent e) {
widgetSelected(e);
}
});
}
The createScaleToFitMenuItem(...) method is called once to create a new Scale to fit menu item.
private void createScaleToFitMenuItem(Menu menu) {
MenuItem menuItem = new MenuItem(menu, SWT.NULL);
menuItem.setText("Scale to fit");
menuItem.addSelectionListener(new SelectionListener() {
public void widgetSelected(SelectionEvent e) {
scaleToFit();
}
public void widgetDefaultSelected(SelectionEvent e) {
widgetSelected(e);
}
});
}
The createScaleToFitMenuItem(...) method adds a menu item that, when selected, calls a new scaleToFit(...) method to dynamically scale the diagram. To accomplish this, this method obtains the current size of the viewport and the current dimensions of the diagram. Because the viewport always considers the origin (the point 0, 0) to be part of the underlying diagram, we must ensure that the diagram’s area includes this point. With the viewport extent and the underlying diagram’s extent, we can calculate the scale necessary to display the entire diagram in the viewport.
private void scaleToFit() {
FreeformViewport viewport = (FreeformViewport) root.getParent();
Rectangle viewArea = viewport.getClientArea();
root.setScale(1);
Rectangle extent = root.getFreeformExtent().union(0, 0);
double wScale = ((double) viewArea.width) / extent.width;
double hScale = ((double) viewArea.height) / extent.height;
double newScale = Math.min(wScale, hScale);
root.setScale(newScale);
}
The menu bar takes up a bit of vertical space in the window, causing the scrollbars to appear when the GenealogyView is first opened. To alleviate this problem, adjust the initial shell size in the run(...) method as follows:
private void run() {
... existing code ...
shell.setSize(365, 290);
... existing code ...
}
7.4.4 Scaling Dimensions
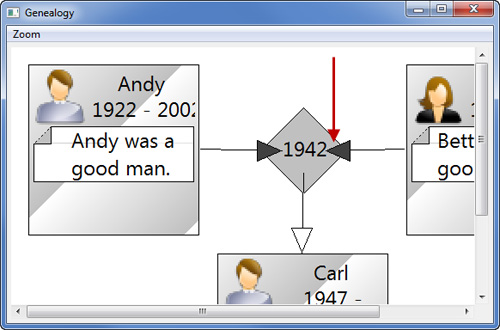
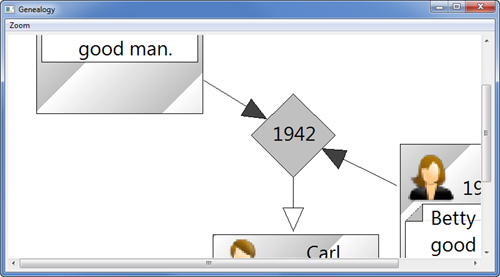
Now our GenealogyView can both scroll and scale, but when we zoom our diagram to 300% and higher, a curious behavior emerges (see Figure 7–13). The connections to the MarriageFigure no longer align with the edges of the MarriageFigure’s diamond. Apparently we need to investigate our MarriageAnchor calculations again.
Figure 7–13. Genealogy view showing misaligned connections.
In our MarriageAnchor getLocation(...) method, we are correctly translating the MarriageFigure’s origin from relative to absolute coordinates, and in the process it gets scaled properly, but what about the radius? Does the radius we are using have relative or local coordinates? When the scale factor is 1, then the relative extent (not x, y but width, height) is the same as the absolute extent, but now that we have scaled our diagram, our radius must be scaled as well. Modify the MarriageAnchor getLocation(...) method as shown below to remedy this problem.
public Point getLocation(Point reference) {
... existing code ...
Dimension radius = new Dimension(RADIUS, RADIUS);
getOwner().translateToAbsolute(radius);
int x = (radius.width * Ax) / divisor;
int y = (radius.height * Ay) / divisor;
... existing code ...
}
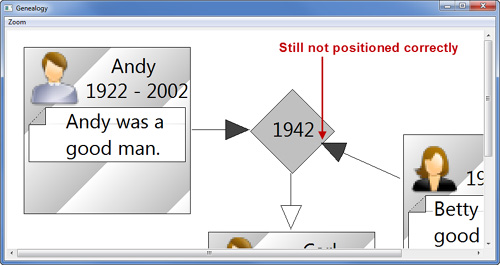
Now when we scale our diagram to 300% or higher, the results are better, but still the anchors along the MarriageFigure are not quite right (see Figure 7–14). It seems that because we are performing integer-based math, we are losing some level of precision in our calculations.
Figure 7–14. Genealogy view showing scaling problem.
7.4.5 PrecisionPoint and PrecisionDimension
When the scale is 1, integer-based math is sufficiently accurate for the purposes of rendering, but once you introduce a scale factor other than 1, more precision is necessary. Draw2D provides the PrecisionPoint and PrecisionDimension classes for calculating location and dimension more precisely. PrecisionPoint extends Point and PrecisionDimension extends Dimension so they can be used wherever Point and Dimension respectively are used. Modify the MarriageAnchor getLocation(...) method as shown below to use these classes.
public Point getLocation(Point originalReference) {
PrecisionPoint reference = new PrecisionPoint(originalReference);
PrecisionPoint origin = new PrecisionPoint(
getOwner().getBounds().getCenter());
getOwner().translateToAbsolute(origin);
double Ax = Math.abs(reference.preciseX - origin.preciseX);
double Ay = Math.abs(reference.preciseY - origin.preciseY);
double divisor = Ax + Ay;
if (divisor == 0.0D)
return origin;
PrecisionDimension radius =
new PrecisionDimension(RADIUS, RADIUS);
getOwner().translateToAbsolute(radius);
double x = (radius.preciseWidth * Ax) / divisor;
double y = (radius.preciseHeight * Ay) / divisor;
if (reference.preciseX < origin.preciseX)
x = -x;
if (reference.preciseY < origin.preciseY)
y = -y;
return new PrecisionPoint(origin.preciseX+x, origin.preciseY+y);
}
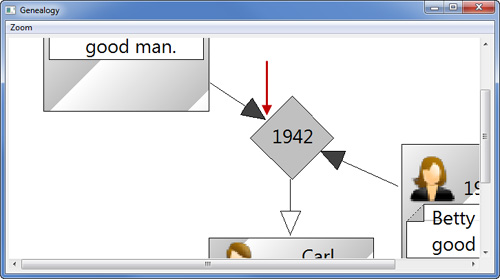
Now the connection along the bottom right of the MarriageFigure looks better, but we still have a noticeable gap between the anchor and the top left edge of the MarriageFigure (see Figure 7–15).
Figure 7–15. Genealogy view showing connection gap.
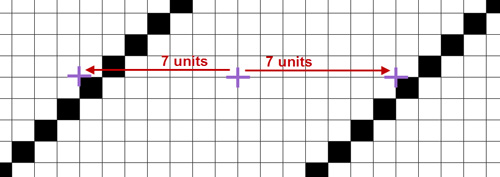
Fixing this problem requires us to reexamine how the coordinates of a geometric figure relate to pixels on a screen. When rendering a point on the screen, the pixel is drawn below and to the right of the coordinate (see Figure 7–16). This means that when our diamond is rendered, the outside of the upper left edge is one pixel closer to the center than the outside of the lower right edge. At a scale of 1, this small difference is not that apparent, but when you scale up to 3 or 4, the difference becomes more pronounced.
Figure 7–16. Diagram showing pixel level details.
The radius for the lower right edge of our diamond is correct, so we must subtract 1 from the radius in each of the other quadrants. This one-pixel adjustment must be made before the radius is scaled. Make the following modification to the MarriageAnchor getLocation(...) method:
public Point getLocation(Point originalReference) {
... existing code ...
PrecisionDimension radius =
new PrecisionDimension(RADIUS, RADIUS);
if (reference.preciseX < origin.preciseX)
radius.preciseWidth = 1.0D - radius.preciseWidth;
if (reference.preciseY < origin.preciseY)
radius.preciseHeight = 1.0D - radius.preciseHeight;
getOwner().translateToAbsolute(radius);
double x = (radius.preciseWidth * Ax) / divisor;
double y = (radius.preciseHeight * Ay) / divisor;
return new PrecisionPoint(origin.preciseX + x,
origin.preciseY + y);
}
Once these changes are complete, the MarriageAnchor correctly positions the connections along all edges of the MarriageFigure (see Figure 7–17).
Figure 7–17. Genealogy view showing correct anchors during scaling.
7.5 Summary
Draw2D provides support for layering collections of figures on top of each other to allow for advanced routing algorithms, scrolling so that the displayed drawing can be larger than the user’s monitor, and the ability to zoom in and out of drawings.
References
Chapter source (see Section 2.6 on page 20).
GEF and Draw2D Plug-in Developer Guide, Eclipse Documentation (see http://help.eclipse.org/).
Hudson, Randy, Building Applications with Eclipse’s Graphical Editing Framework, EclipseCon 2004 presentation (see www.eclipsecon.org/2004/presentations.htm).
Moore, Bill, David Dean, Anna Gerber, Gunnar Wagenknecht, and Philippe Vanderheyden, Eclipse Development Using the Graphical Editing Framework and the Eclipse Modeling Framework. IBM Redbooks, February 2004.