
10. Boom, Bubble, Bust, and Crash
June 2, 1995: This is as good a date as any to begin the string of events that led to the subprime financial shock. On this day, the nation’s housing market was enjoying a blessedly fortunate set of conditions—the best in at least 30 years, with fixed mortgage rates below 8%, adjustable rates below 6%, and a healthy job market. Combined with the relatively low house prices that prevailed into the mid-1990s, these rates made housing as good a bargain as it had ever been in the United States. Sure enough, home sales, construction, ownership, and prices all climbed steadily through the remainder of the decade—and kept climbing, right through the 2001 recession and into the jobless recovery that followed.
Housing Boom
The period from the mid-1990s through the early 2000s is best described as a housing boom. Consistently strong activity was driven by well-supported demand and disciplined new housing supply. Buyers of second homes or vacation homes had every intention of holding on to them; they weren’t “flippers” looking for quick profit. House prices posted solid, steady gains—but those who wanted real action turned to the stock market. Anyone seeking a fast buck was focused on the price of Cisco stock or perhaps eBay—not a Miami Beach condo or San Diego ranch home. Speculation had taken over the stock market, but not yet the housing market.
A single-family home was a bargain in the late 1990s, and the job market was arguably stronger than at any previous time in the nation’s history. In 1995, a median-priced U.S. home could be purchased with a monthly mortgage payment of $675.1 Because mortgage rates had fallen steadily, that monthly payment was no greater than it had been in 1980. Meanwhile, household incomes had more than doubled. Unemployment was falling, too. In 1995, it was near 5.5%, down from 7.5% early in the decade and half the level of the early 1980s. By the end of the 1990s, unemployment had reached a post–World War II low below 4%.
Minority groups were gaining meaningful access to mortgage credit for the first time. African-American and Hispanic households with incomes and savings who may have been unable to obtain mortgage loans in the past now finally could do so. This was a priority for the Clinton Administration; it empowered and then pushed regulators to aggressively enforce requirements on mortgage lenders to extend more loans to previously excluded groups.
Foreign immigration also soared during the 1990s, pushing up the number of households and, thus, the demand for housing. Immigrants were attracted by the surging U.S. economy and all the available jobs, particularly in contrast to their own troubled economies in Latin America, Southeast Asia, and Eastern Europe. The terror attacks of 9/11 were still in the future, and security was a relatively modest concern. Legal and illegal immigrants were adding half a million households a year to the U.S. population; each household required a place to live. Almost one-fourth of the new homes constructed during the housing boom were for immigrants.
Despite the strong demand for new homes, builders were restrained from overbuilding. The large California and Northeast housing markets still felt the effects of the early 1990s savings and loan (S&L) crisis, when many builders failed along with their banks. The S&L bust had hobbled the infrastructure for building homes, from obtaining construction permits to selling completed units.
Even as housing demand improved, it was difficult to put together all the moving parts needed to erect a home. California housing starts in 1995 were a third of their level from a decade earlier. Not until the decade’s end did the home-building industry begin humming again.
Housing Bubble
July 4, 2003: What had been a housing boom became a housing bubble (see Figure 10.1). There was no obvious warning: The war in Iraq still looked like an easy win, the domestic job market was finally regaining traction, fixed mortgage rates were closer to 5%, and adjustable rates had fallen firmly below 4%. Despite the solid rise of house prices in the preceding eight boom years, housing was still affordable. But this was also when home buyers, lenders, and mortgage investors began looking skyward, assuming that because house prices had been rising strongly in the recent past, they would continue to do so far into the future. Speculation began to grip the market.
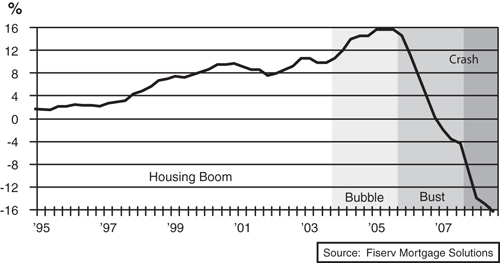
Figure 10.1 Housing boom, bubble, bust, and crash: housing price growth.
The housing bubble was born out of the boom. The boom had been based on solid demand and supply fundamentals, such as affordable homes, strong incomes, and ample household savings. The bubble developed when Americans started buying not simply because they needed someplace to live, but because they thought housing was a great investment. Prices had risen; therefore, they would continue to rise. This is speculation. A bubble develops when an asset’s price becomes disconnected from its fundamental value. Stocks derive their fundamental value from future corporate earnings. Housing derives its fundamental value from its future value as shelter or from the rent it generates.
Some regions are more susceptible to bubbles than others. Parts of the country where geography or zoning makes development land scarce—think California, Florida, and the Northeast corridor—are particularly fertile soil for speculation. When strong demand meets a restrictive building environment, houses can be bid up quickly, divorcing price appreciation from the factors that caused the gains in the first place. Some of these areas had seen house-price bubbles in the mid-1970s, and again in the early 1990s. By contrast, in areas where new construction is relatively easy—Texas or Iowa—speculation is less likely. As soon as prices show any strength, builders rush in to add more houses and compete away the gains. Without dramatic price gains to point to, buyers’ imaginations never drift toward the skies.
Conventional wisdom stated that although isolated regional housing bubbles might form, a nationwide bubble was all but impossible. The reasoning was based on transaction costs—the incidental expenses involved in buying and selling homes, from realtor fees to taxes. Speculative bubbles, it was believed, require frenzied buying and selling to fuel the price gains. Real estate transaction costs, however, were high enough to short-circuit such activity. Stocks, by contrast, were prone to speculation because the transaction costs involved in trading shares were much lower.
Yet the collapse of the Internet stock bubble at the turn of the century created the fodder for the subsequent national house price bubble. With stocks reeling and the Federal Reserve slashing interest rates, many households wondered what to do with their savings. Because housing was still rising in price, the answer seemed straightforward: Buy a house, or maybe several houses. The idea grew even more appealing following 9/11, as travel began to seem less alluring than a barbecue in the safety of your own backyard.
Besides, almost anyone could get a mortgage loan. For those with unblemished credit histories, the rates resembled those our parents and grandparents talked about, much as they recounted hearing Elvis Presley or Jimmy Dorsey for the first time. Even better, those high transaction costs were falling fast. Competition among mortgage lenders and newfangled Internet technology had made shuffling all those documents much less expensive. There was no place like a brand new home, and sales soared to astonishing levels. At the apex in 2005, fully 10% of all the homes in the country were bought and sold.
How Overvalued?
Economists often debate what constitutes a bubble and how to determine whether one is forming. After all, the price for any asset, from a share of stock to a home, is based on forecasts of future returns by many buyers—and who can say that all those buyers are getting their forecasts wrong? There are some telltale signs, however, and the housing market circa 2005 exhibited all of them: a huge volume of home sales; available easy money for house purchases; and a lot of new theorists arguing that, yes, prices might have gotten too high in the past, but things were different now. To these theorists, the housing market made perfect sense. All you had to do was discard all those antiquated measurements and notions of what constituted an appropriate house price.
One such measure of housing valuation compares house prices with rents.2 The logic is simple: Households can choose to own or rent their home, and are likely to choose whichever option is more cost-effective. The cost of ownership, of course, is closely tied to the sale price of the home. If house prices rise faster than rents over a long enough period, renting becomes the cheaper option for many people, making house prices look overvalued. (The same relationship works in reverse: If house prices fall relative to rents over time, houses will likely be undervalued.) The relationship between house prices and rents depends on many factors, including interest rates and the availability of mortgage credit. Over sufficiently long periods of time, however, this relationship is quite stable.
Here’s another way to think about it: The relationship between house prices and rents is much like a price–earnings ratio for stocks. PE ratios fluctuate as markets change, but since World War II, the PE on the S&P 500 stock index has averaged about 15—that is, stock prices have averaged about 15 times corporate earnings. At times a PE of more than 15 can be justified—such as when interest rates are low—but using the long-term average is a good rule of thumb for identifying whether the stock market is over- or undervalued. Just before the Internet stock bust in 2000, for example, the PE on the S&P 500 peaked around 45. As subsequent events proved, it was clearly overvalued.
Nationally, the housing “price-to-rent” ratio hit an all-time peak of 25 at the end of 2005 (see Figure 10.2). On July 4, 2003, the day I’ve identified as the start of the housing bubble, the price-to-rent ratio was 18.5. This compares with an average over the past quarter-century of 16.5 and a low of 12.5 during the mid-1980s. Although the overvalued national housing market in 2005 wasn’t in the same league as the stock market in 2000, it was close in some metropolitan markets. The highest flyers included Miami, Florida; Washington, DC; Phoenix, Arizona; Orlando, Florida; most of southern California and Sacramento; Las Vegas, Nevada; and Long Island, New York. Before the bubble ended, however, almost every major market in the country was deemed to be overvalued to some extent.3

Figure 10.2 An overvalued housing market.
Housing Bust
April 10, 2006: On this chilly and wet day (at least, in my neighborhood in suburban Philadelphia), housing was palpably overvalued from coast to coast. Housing affordability was sinking, dragged down both by soaring prices and by the Federal Reserve’s recent series of interest rate hikes. The economy was looking robust, thanks largely to the soaring housing market, and low interest rates were no longer part of the central bank’s prescription for balancing growth and inflation. Rising rates didn’t prick the housing bubble immediately; mortgage lenders kept them at bay by offering even easier lending terms to borrowers. Eventually, lenders ran out of tricks for keeping monthly payments down. By the spring selling season of 2006, the housing bubble was starting to leak.
Nationally, house prices didn’t fall much in 2006, but even the modest decline that occurred was unnerving. Not since the Great Depression had there been such an overall, coast-to-coast average price decline, and it got people’s attention. Small and medium-size real estate speculators stopped buying and began selling—and when no one else showed up to buy, they began mailing their house keys back to their lenders. Mortgage loans made just a few months earlier began to show signs of trouble. Before long, a wave of mortgage defaults began the foreclosure process.4 The pace of defaults rose from an annualized 775,000 at the end of 2005 to nearly 1 million by year-end 2006 (see Figure 10.3).5 Many defaults involved recent buyers, who had made only one or two payments—or none—on their loans. Most were “flippers” who had taken out a mortgage expecting to pay it off quickly, after selling the house at a profit. When they couldn’t sell or even rent their investment home, they defaulted.
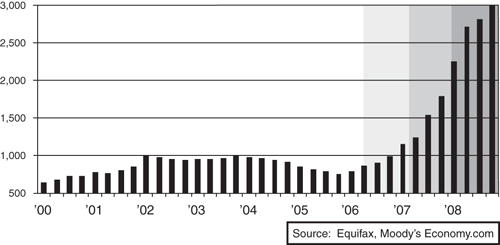
Figure 10.3 Three waves of foreclosures: first mortgage loan defaults, ths, SAAR.
A second wave of defaults and foreclosures began in spring 2007. Subprime mortgage borrowers who had obtained loans two years earlier choked as their mortgage payments jumped higher. Most had so-called 2/28 loans: For two years, the rate was low and fixed; after that, it adjusted generally every six months to levels reflecting prevailing short-term rates. Homeowners who hit their first rate reset in 2007 found themselves facing an average increase of $350 per month: Their average monthly payment shot from $1,200 to $1,550, often an unmanageable amount. The pace of defaults rose from 1 million per year at the end of 2006 to more than 1.5 million by summer 2007.
Nobody in the mortgage business had expected this. Many had understood it could happen—under the terms borrowers had agreed to, they could technically face a payment reset that would overwhelm their household finances—but almost no one thought it would happen. Surely such borrowers would be able to refinance; doing so was in everyone’s interest. Mortgage lenders would collect more fees—often charging both to originate a new loan and to collect a penalty for paying off the old one early. Mortgage investors would be happy to get their money back; they had planned it that way and didn’t want to worry about whether these shaky borrowers would default in the future. Borrowers would have a clean start.
Yet as credit conditions weakened, mortgage lenders and investors grew less willing to refinance hard-pressed borrowers facing resets. Suddenly, no one wanted to take on the risk, and subprime borrowers began defaulting en masse.
It was all too much for mortgage investors. They had been judiciously unloading their mortgage security holdings for more than a year, but by summer 2007, panic had set in and the rout was on. The subprime financial shock was in full swing.
Housing Crash
July 30, 2007: As the opening bell sounded on Wall Street, news spread that investment bank Bear Stearns was shuttering two of its hedge funds, both of which had loaded up with subprime mortgage investments. The story pushed the housing market over the edge. Mortgage securities trading shut down; the pipeline from global capital markets to the housing market had been severed. Now mortgage lenders couldn’t make a loan even if they wanted to. There were still FHA loans and loans backed by Fannie Mae and Freddie Mac, but they could not fill the void left as private mortgage lending ceased. This was particularly true in places such as California and Florida, where government lending was virtually nonexistent.
Without mortgage credit, home sales plunged. At the start of 2007, new and existing home sales were running close to a 7.5 million unit pace a year, but by the end of the year, the pace had fallen below 5.5 million. Psychology in the housing market had been turned upside down. Until this point, home builders and other sellers had believed that if they were flexible on pricing and were patient, they would make a sale. It might take a few extra weeks or months, and perhaps an incentive such as a built-out basement or retiled roof, but eventually homes would sell for close to their initial asking price. Now, with mortgages and home sales evaporating, sellers realized they had no choice but to slash prices. Of course, those buyers who were still in the market sensed sellers’ terror and turned coy; they didn’t want to catch the proverbial falling knife.
House prices crashed. The national average price, which had fallen about 5% between the spring 2006 selling season and summer 2007, dropped another 20% by the end of 2008. National house prices had plunged some 25% from their peaks. The declines were much worse around Washington, DC, and on Long Island, where they had declined by more than 30%; in Arizona and Nevada, where they were off by 35%; and in southwest Florida and the Central Valley of California, where the declines were approaching a stunning 50%.
Prices have even farther to fall. Using the price-to-rent analysis as a guide, if the ratio of prices to rents returned to its 25-year average, nationwide house prices are likely to fall at least an additional 10%. This would mean a total drop in house prices of more than 35%, a tumble comparable to the one experienced in the Great Depression. Moreover, some large metro areas (including Miami, Florida; Washington, DC; Long Island, New York; the Bay Area of California; Orlando, Florida; and Phoenix, Arizona) will likely experience price declines measurably larger than this (see Figure 10.4).6
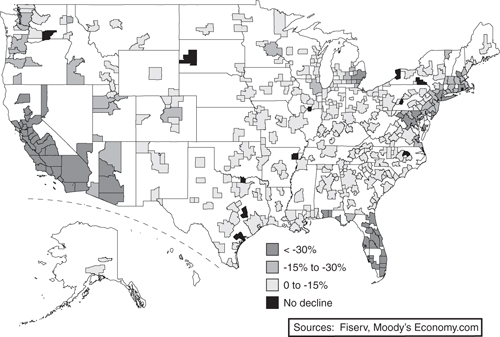
Figure 10.4 Where house prices will decline most: projected peak-to-trough house price decline, U.S. = −36%.
Where’s the Bottom?
The free-fall in house prices after the subprime financial shock brought on a third wave of mortgage loan defaults and foreclosures. This time, the catalyst for foreclosure was negative equity, the dilemma faced by a homeowner who owes more on a home loan than the home itself is worth.7 With house prices falling back to 2003 levels, homeowners in most parts of the country who had purchased between 2004 and mid-2007 and put less than 10% down were lucky if they were still above water. By early 2009, close to 14 million homeowners—more than one in four of all those with a first mortgage—were indeed underwater. This was up from no more than 7 million a year earlier and just over 3 million the year before that.
Some homeowners chose to just walk away. With their homes’ value falling far below the amount of their mortgage, they lost hope of ever getting back their equity and simply handed both mortgage and house back to the bank. This was unusual, however. Most homeowners were willing to work hard to stay current and in their homes, even while in negative equity. Many didn’t really know their homes’ value; others figured it was worth the wait until prices rose once again. It was a tenuous position to be in: One financial mishap, such as a temporary loss of income or an unexpected increase in expenses, could mean the loss of a home. The danger was compounded by lenders who couldn’t or wouldn’t renegotiate or modify the terms of a loan.
Many negative-equity households were also caught up in a rapidly weakening job market. Some were facing layoffs; others were losing overtime hours or settling for part-time work because full-time jobs weren’t available. Predictably, regions with the worst housing troubles also saw the most severe job losses. The situation was precarious for those with negative equity: A fender bender, a busted water heater, or a child’s broken arm could push families into delinquency and default.
From summer 2007 to the end of 2008, first-mortgage loan defaults soared from more than 1.5 million to 3 million. Nearly 3% of the nation’s households were in default on their mortgages. Default rates were measurably higher in California, Arizona, Nevada, Florida, the industrial Midwest, and heavily populated regions of the Northeast corridor (see Figure 10.5).
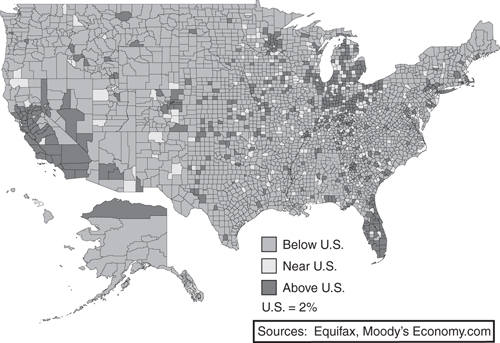
Figure 10.5 Defaults soar across the country: % of households defaulting on their first mortgage, ’08q4.
Not all loan defaults forced families from their homes. In good times, fewer than half of defaults do. Homeowners and lenders are often able to work out a deal; lenders put homeowners on a repayment plan or modify the loan by lowering the borrower’s interest rate or extending the term to make the loan more affordable. Many homeowners are able to recover and make good on their loans. But during times of economic weakness, things are different: More than half of defaults cause households to lose their homes. The end could be a short sale, in which the home is sold for less than the mortgage amount; lenders sometimes agree to accept this just to get rid of the problem. It could also be a “deed in lieu,” in which the homeowner simply hands the deed back to the lender and is freed from further obligation. More often than not, however, the lender eventually takes possession of the home, putting it into an “other real estate owned” (REO) account from which it is sold.
With so many homes going through this process, the number of vacant homes for sale surged. According the Census Bureau, by the end of 2008, more than 2.25 million homes were vacant and for sale. During the housing boom, there were only 1.25 million such homes. In other words, the bust had turned more than one million homes into “excess inventory.”
Such properties were often sold far below prevailing market prices. Lenders were absorbing big losses in maintenance, legal, and carrying costs, and wanted to sell their foreclosed REO properties quickly, even if that meant writing off substantial sums. In early 2009, lenders were commonly selling foreclosed property for 50% below prevailing market prices.
These distressed sales were devastating for the broader housing market. A typical home sold in foreclosure reduces the value of surrounding properties by more than a full percentage point. Rising foreclosures were driving up inventories, which, in turn, were driving down prices and homeowners’ equity and, thus, creating more foreclosures. The housing market was trapped in a self-reinforcing negative cycle. This had occurred briefly in California and New England in the early 1990s, but never in so many parts of the country. There was no obvious way out of the cycle—and no guarantee that house prices would stop falling soon.