
Chapter 3. Indexes and Efficient Markets
“The investment management business is built upon a simple and basic belief: professional managers can beat the market. That premise appears to be false.”
Charles D. Ellis, Financial Analysts Journal, July 1975
Index funds are a great idea for most investors, but the more they grow, the more inefficient they make the market, and the more they encourage investors to move in lockstep. They are based on academic theories on efficient markets which breed a psychology of overconfidence, that inflates bubbles.
Index funds—normal mutual funds that merely match the returns of an index, rather than trying to beat it—are dull staple products that make investing much cheaper for small savers. But they have only been around since 1975 and have their roots in a radical academic theory that holds that it is impossible to beat the market.
The irony is that as they grow more successful, they make the market less efficient. This should make it easier for active managers to beat the index. And yet the response of active managers has instead been to herd ever closer to the index.
Index funds also enable the kind of “top-down” investing, based on big international trends, that has inflated global super-bubbles. While virtually every investor should hold some index funds, the painful paradox is that they have helped make markets much more prone to bubbles.
Let us look at how index funds developed. Jack Bogle is the father of the index fund, an idea that came to him as a driven young Princeton academic who wrote a thesis questioning whether fund managers could beat the market. Unperturbed by the lack of demand from investors, he launched the first S&P 500 index fund in 1975, primarily on the proposition that index funds should be cheap.1 He modeled the ethos of his company, Vanguard, on a ship at sea (it has “crew members,” not employees) and adopted a structure aimed at minimizing principal-agent conflicts; the management company itself belongs to the mutual funds it manages.
Fund managers typically spend heavily on research to piece together portfolios with maybe a hundred stocks in them. If the efficient markets hypothesis, which was developed in U.S. universities in the 1950s and 1960s, is correct, this money is wasted. Stock prices always incorporate all known information, so their movements are random and cannot be predicted from one day to the next. They follow a “random walk.”2, Therefore, there is no point in paying for expensive research.
Computers offered an alternative. The S&P 500 index includes 500 stocks. Taking in money and paying out redemptions each day and buying or selling the right amount of stocks to track the index was impossible for fund managers armed with slide rules, but is easily done with computers, at much lower costs than active funds incur when they try to beat the market. Running index funds has grown cheaper as computers get more powerful and the funds grow bigger. For index funds, size is not the enemy of performance, as they enjoy economies of scale.
Bogle proved to be right about indexing. From 1978 to 1998, the S&P outperformed 79 percent of all mutual funds that survived that long—and this excludes those wound up due to poor performance. In the 30 years to December 2008, the S&P returned 11 percent per year, against 9.3 percent for active equity mutual funds.3
Investors saw this and bought in. Vanguard’s S&P 500 index fund grew to be worth more than $100 billion, and overtook Magellan as the world’s biggest fund in 2000, while Vanguard itself overtook Fidelity to become the biggest mutual fund manager in the United States.
Bogle changed investing. To see how, we must look at the theories that, in conjunction with the “random walk,” appeared to unlock the central mysteries of investing.4
Central notions are that risk can be quantified, and that risk and return can be traded off precisely to come up with an asset allocation that balances them. Risk is defined by how volatile a security’s price is; stocks that are prone to wide leaps and dives are riskier than stable stocks, even if in the long run their return is better.
To deal with risk, the theory holds that we should look at how much one security’s returns are correlated with another’s. If you have two very volatile stocks with strong returns, holding two will be less risky than holding one, provided that they are not correlated with each other, because the odds are that when one falls the other one will be alright. The art of risk management then becomes to add more securities until it is no longer possible to boost your return without also boosting your risk. Provided that the correlations are low, you can add a risky security to your portfolio, and make it less risky. These insights can all be quantified with elegant mathematics, and they have led investors for a generation on a hunt for assets with a low correlation to the assets they already hold. This drove them, as we will see, to create a synchronized bubble; once investors held on to assets on the assumption that they were uncorrelated, they tended to become correlated.
Another key concept is that market returns will follow the bell curve distribution that often occurs in natural sciences. Human height, for example, follows a bell curve. Applied to the market, it implies that a graph of daily stock market returns should follow a smooth curve (see Figure 3.1). Most days’ returns will be close to the average or have a small rise. A few days there will be outliers of very bad or very good returns. These are known in the jargon as the “tails”. But the key is that everything follows the smooth outlines of a bell, with steadily tapering thin tails. The more extreme the event, whether positive or negative, the less likely it is to occur. Armed with these theories and some data, investors can approach each day with a precise figure for the maximum amount of money they are likely to lose that day.
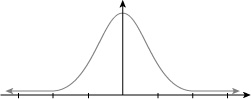
Figure 3.1. The bell curve—safety in numbers
How seriously did real practitioners take the academic ideas? The “random walk,” as Bogle spotted, implies that active management is pointless. Any real-life investors who continued to manage funds actively must therefore have assumed that these theories were at best an approximation of reality. Real life, with its booms and busts, shows that the “random walk” is not a perfect model, although it often holds good during long periods of stability. But even though investors knew that markets were not perfectly efficient, they used models based on that assumption to pick stocks and to manage risk.
More importantly, regulators forced them to take the academics seriously In 1974, Congress passed ERISA, the Employee Retirement Income Savings Act, which revolutionized the business of managing pension funds first in the United States and then elsewhere. The act required investment managers to be “prudent,” and it defined that word to mean that they should manage money in line with modern portfolio theory. This exacerbated still further their tendency to move in herds.
Most importantly, the theories became central to the curriculum of all business schools and had a psychological effect. By putting a precise number on risk, they diminished MBA students’ fear of the unknown. This turned to overconfidence, even when they reached trading desks and found the theories did not work as neatly in practice as they had done at business school. Bogle himself diagnosed this, saying he did not believe that “this focus on simplistic mathematical precision is a healthy state of being for managers, nor for their clients, nor for the market itself.”5
All of this matters because the structure rests on unsafe foundations. Risk, it turns out, cannot be measured with mathematical precision. Security price movements are not random, and extreme moves are far more common than the bell curve suggests. Benoit Mandelbrot, a Polish émigré mathematician best known as the inventor of fractal geometry, proved this as early as 1962. Studying financial markets as a hobby, he graphed daily stock and commodity price movements and looked for patterns. They were clearly not random, as there were too many extreme events, and he published a paper on cotton prices making this clear. “Bubbles and crashes are inherent to markets,” Mandelbrot argued. They were “the inevitable consequence of the human need to find patterns in the patternless.”6
Moreover, extreme events account for the bulk of all performance. From 1916 to 2003, on the assumption that markets followed a bell curve, there should have been 58 days when the Dow Jones Industrial Average, the oldest U.S. stock index, moved more than 3.4 percent. There were in fact 1,001. Index swings of 7 percent should come along once every 300 years, but made an appearance 48 times in the twentieth century alone.
But when Mandelbrot published his critique in 1962, academic economists denigrated it. They did this, arguably, because the bell curve was convenient for them. By assuming basic randomness, markets and risk management could be brought within the realm of conventional mathematics, opening all kinds of avenues to further research. If Mandelbrot was right, markets could only be modeled with the mind-bendingly complex mathematics needed to measure wind turbulence or chaos, which is even now still in its infancy. And so academics ignored Mandelbrot and cheerfully carried on building models on the assumption that price moves were random.7
“It does not work as advertised,” Mandelbrot commented sourly, but “it gives a comforting impression of precision and competence.” But anywhere the bell curve assumption entered “an error came out.... It means stock portfolios are being put together incorrectly; far from managing risk, they may be magnifying it.”8
Markets became less efficient when driven by ideas based on efficiency. Even index funds are a force for inefficiency, as they make no attempt to spot which stocks are over- or under-valued, and instead accept the market’s judgment. When bubbles start, index funds automatically buy more overpriced stocks, and sell stocks that are underpriced. If internet stocks are rising and displacing industries that generate real profits, then index funds must dumbly buy them and make the mispricing all the worse. If managers at a company misbehave, index funds do nothing to stop them, even though the capitalist system relies on shareholders, the companies’ owners, to enforce good behavior.
“Fundamental indexing,” in which funds track indexes based on the fundamentals of a stock—such as its earnings or dividends rather than on its market value—maintains the low costs of indexing, but does not chase the market into overvalued stocks. This helps avoid herding tendency and contributes to strong performance in the longer term. So, this development could play a major role in dealing with the problem, but for now fundamental index funds are only a very small part of the market.
Markets need active managers to conduct research and make sure prices stay realistic. This creates the paradox that as individual investors buy more index funds, they introduce inefficiencies, creating opportunities for active managers. But active managers tend not to take this opportunity. Instead, index funds increase the pressure to seek safety in numbers. By hugging to the stocks in the index, a fund ensures that it will not lose too badly relative to the market, even if their clients would be far better off in a cheaper pure index fund, where they pay no research costs.
The most famous alleged “closet indexer” was Magellan itself. Robert Stansky’s changes to the fund made it look ever more like the index. Antti Petajisto, a finance professor at Yale, came up with a concept to measure this, which he calls the “active share.” This measures the fraction of a fund’s holdings that differ from the S&P 500—for example, if its holdings are identical except that it has no Microsoft, which is 4 percent of the S&P, and instead holds 4 percent in stocks outside the index, it has an “active share” of 4 percent. A pure index fund has an active share of zero. An equity fund that invests only in obscure stocks excluded from the index has an active share of 100 percent.
Under Peter Lynch in the 1970s, Mr. Petajisto showed, Magellan had an active share of more than 90 percent. When the fund was smaller it had truly been able to buy bargains far from the mainstream. After Jeff Vinik’s bet on bonds, the active share was 77 percent—still plainly a very different beast from the index. Under Stansky, the active share fell to 33 percent.9 Stansky denied suggestions that he was a “closet indexer,” saying that he was not afraid to make any bet. And over his first five years, he slightly outperformed the S&P. But his own account of his success showed the gravitational pull that the index exerts on fund managers. “How do you beat the S&P?” he asked an interviewer rhetorically. “You beat it by overweighting some groups, underweighting others, and by owning stocks that aren’t in the S&P.”10
Psychologists identify “framing” as a persistent problem leading to bad decisions. Once we frame an issue in a particular way, it is hard to approach it differently, and indexes now frame the perceptions of many “active” investors. Fund managers describe themselves as “overweight” or “underweight” a stock or sector, by comparing its weight within their fund to its weight within the index. Compilers of the most widely tracked indexes, such as Dow Jones, S&P, MSCI Barra, and FTSE, have grown hugely powerful. Stockbrokers devote reams of research to predicting changes in indexes; stocks jump when they are included in a major index and plummet when they are excluded.
Research by Mr. Petajisto and others shows that indexes have come to dominate all fund management. Pure index funds grew from 1 to about 15 percent of mutual fund assets during the 1990s, but the fraction of “closet indexers” (with an active share of between 20 and 60 percent) rose to about 30 percent of all assets in 2003, compared to almost zero in the 1980s. This has indeed created opportunities for those who are truly active. Mr. Petajisto’s research shows funds with the highest active share beating their index by more than one percentage point a year, even after expenses.11 But for fund managers, the urge to herd was too strong, and most spurned the opportunity.
Bogle himself scorned “investment relativism,” and described closet indexing as the most “ineffective” response possible to indexing. “Today’s chance of victory, as small as it demonstrably is for active managers, will become tomorrow’s certainty of defeat if managers offer tacit index funds with high fees,” he said. It also helped make bubbles more certain—and the rise of markets soon ensured that this approach spread from stock investment to the price of money itself. Once set by banks, for many of us the price of a loan is now set by markets.
In Summary
• Index investing is a good idea for most savers, but it makes markets more inefficient and prone to bubbles, as index funds must buy into stocks that are overvalued and avoid stocks that are out of fashion.
• Its popularity also encouraged “closet indexing” by active managers.
• Theories of market efficiency, despite fundamental flaws, stoked overconfidence.
• They led many investors to look for assets that had low historic correlations to stocks they already held—spreading the reach of correlated markets.
• For savers, the solution is a rigid division; either buy an index fund or buy a fund that is truly active.
• And for professional investors the need is for a new theory of investment.