
CHAPTER
FIFTY-TWO
ELEMENTS OF MANAGING A HIGH-YIELD BOND PORTFOLIO
President, Chief Investment Officer
Shenkman Capital Management, Inc.
NICHOLAS R. SARCHESE, CFA
Senior Vice President
Shenkman Capital Management, Inc.
High-yield portfolio management involves the art and science of matching a portfolio’s investments to its underlying objectives and overall risk profile. The focus is to balance risk against performance with the goal of achieving superior risk-adjusted returns over an entire credit cycle. From a portfolio management perspective, the high-yield market is a unique asset class due to the fact that high-yield securities exhibit the characteristics of both debt instruments and equities. Given the greater risk associated with highly levered companies, changes in the underlying fundamental credit profile are the primary driver of return over time as default loss is a key concern. However, as part of the fixed income asset class, debt attributes of the security, such as coupon, maturity, covenants, and ratings, also affect prices and performance.
High-yield bonds offer significant incremental return and income as compared with most other fixed income investments. However, it is essential to keep in mind their asymmetrical risk profile. That is, a bond’s upside is generally limited to its face value at maturity or early redemption premium, while the downside could include an entire loss of principal in a default. In order to capture the attractive incremental returns and spreads offered by investing in high-yield bonds, minimizing default and credit loss are crucial components to achieving this goal.
Properly assessing and managing risk are critical elements of managing a high-yield portfolio. Risk controls require developing insightful and comprehensive procedures to identify and control risk across the following three key areas:
1. Bottom-up credit/security analysis
2. Top-down high-yield market drivers and macro considerations
3. Portfolio considerations
EXHIBIT 52–1
Elements of Managing a High-Yield Bond Portfolio
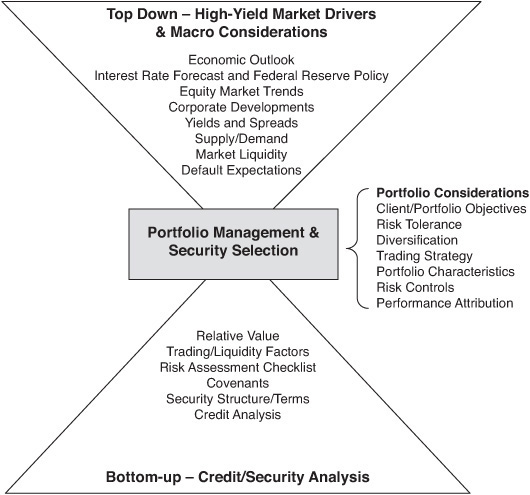
Exhibit 52–1 identifies these three areas and highlights the elements to consider. The most successful portfolio managers have the ability to assimilate all three areas as the intersection point is the nexus of the portfolio decision-making process. Each of these areas and their elements are discussed in further detail below.
Over the long term (and through various economic cycles), portfolio managers who have avoided defaults and major trading losses have typically outperformed various high-yield benchmarks.
BOTTOM-UP–CREDIT/SECURITY ANALYSIS1
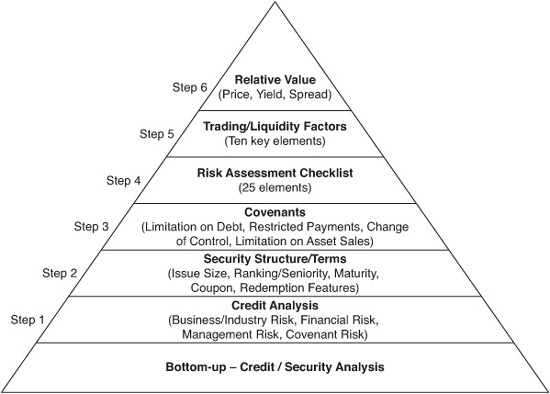
While credit analysis is arguably the most important component of a bottom-up investment process, security structure/terms, covenants, trading liquidity factors and relative value ultimately determine if a “good credit” will make a “good investment.” Poor relative value and overpaying for a good credit could lead to underperformance. Weak trading liquidity factors can magnify the downside and disrupt the value equation in a negative surprise scenario. In executing a buy-sell decision, a step-by-step process is required to ensure consistency and disciplined decision making. Exhibit 52–2 highlights the six steps in analyzing a high-yield issuance. A checklist of positive and negative attributes should be utilized at each step. It is also important to emphasize that all of the bottom-up steps are significant in their own right. A favorable assessment on many of the steps may not necessarily outweigh an individual risk component that is identified in the process.
EXHIBIT 52–2
Six Steps in Bottom-Up—Credit/Security Analysis
Step One: Credit Analysis
Thorough credit analysis is ultimately the foundation for a successful high-yield investment since its primary focus is to avoid defaults. A greater investment risk is getting the credit analysis wrong as opposed to potentially overpaying for a good credit. It is important to keep in perspective that the high-yield asset class involves highly levered companies that have disproportionately less margin for error. The asymmetrical upside/downside return profile of bonds also highlights the importance of avoiding meaningful downside credit risk. In practice, the underperformance related to overpaying for a good credit pales in comparison to the ultimate downside in holding the bonds of a credit that defaults. Remember that a bond’s upside is limited to par (plus perhaps an early takeout premium), while the downside is theoretically zero. If a bond drops from par to 50, it would take 10 bonds to advance five points each in order to recoup the 50-point decline in just one credit! Equity portfolios do not have this similar dynamic because one investment can soar by 500%, thereby offsetting the losses in numerous other transactions. However, the number of bonds in a portfolio that can jump five points or more may be limited.
Credit analysis can be simply defined as determining the borrower’s ability to meet its interest and principal obligations when due. It is often identified with financial ratio analysis. However, true credit analysis is much more comprehensive and encompasses greater in-depth review. For example, two credits with identical financial ratios may not represent the same credit risk. As outlined in Exhibit 52–3, credit analysis can be divided into four key areas: business risk, financial risk, management/ownership risk, and covenant risk.
EXHIBIT 52–3
The Four Key Components of Credit Analysis
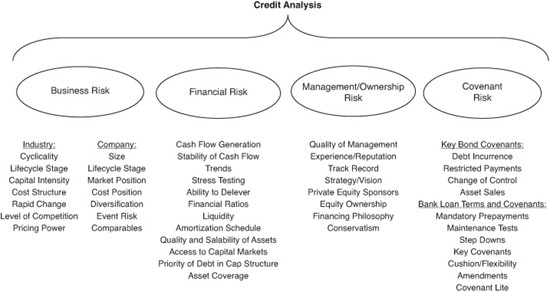
Thorough credit analysis is not complete without a detailed examination of all four risk factors. Weakness in any one of the four areas could offset the strength in the remaining three and result in high credit risk for a particular issuer (Exhibit 52–4).
EXHIBIT 52–4
Credit Analysis Examples
Examples include:
Strong Financial Profile + Strong Management + Strong Covenant Protection
The strengths may not be able to offset a high business risk where the industry structure is unfavorable, and the company is weakly positioned
Strong Business/Industry Fundamentals + Strong Financial Profile + Reasonable Covenant Protection
The strengths may not be able to offset the negative impacts of a weak management team with aggressive financial policy – OR – Bondholder unfriendly private equity sponsor
Strong Business/Industry Fundamentals + Strong Financial Profile + Strong Management
The strengths may not be able to offset the negative impact of a weak covenant package
Strong Business/Industry Fundamentals + Strong Management + Strong Covenant Protection
The strengths may not be able to offset the financial risk of a company that is overlevered
Investors must focus their analysis on a “forward looking” view of all four risk areas. While historical results are important for perspective, ultimately it is the future credit trend that will dictate performance.
Business Risk
Analyzing the business risk of a particular credit involves an assessment of both the industry risk and company-specific risk from more of a strategic perspective. This analysis should involve not only determining whether the industry structure and fundamentals are favorable, but ascertaining the company’s strategic position within its industry. Even the best company in a given industry may not be able to withstand major structural changes.
Industry Analysis. High levels of debt can be manageable and appropriate for certain industries but not others. Some industries are more conducive to leverage because their high operating margins, solid growth rates, and consistency of earnings enable the companies within the sector to service a higher degree of indebtedness. Factors used to assess an industry include: stability of cash-flows, stage in industry lifecycle, capital intensity, cost structure/operating leverage, degree of rapid change, competitive forces, regulation, and pricing power. In addition to providing an enhanced credit profile, industries that possess more favorable outlooks also tend to trade better because of positive macro considerations and investor support.
Company Analysis. It is imperative to dissect a company’s specific strengths and weaknesses and determine how it fits into its industry. For example, a company can operate in a growing industry but possess obsolete technology. Conversely, a company can compete in a declining industry but have a leading market position and generate significant cash-flow. Factors to consider include:
• Size of the company
• Stage in company lifecycle
• Market position
• Diversification
• Potential for event risk
All of the above mentioned factors can impact the creditworthiness of the borrower.
Financial Risk
After assessing an industry and company’s business risk, the next step is to consider the overall financial risk and credit profile of the borrower. This consideration should take into account the company’s capitalization and degree of leverage. The fundamental operating outlook and credit profile of a company are critical variables that should drive bond performance. Moreover, a thorough analysis must evaluate the past financial results to understand the drivers of the business.
The key variables to financial risk include:
• The stability of cash-flows
• Recent and near term projected performance trends
• Stress testing (how well a company’s credit profile can withstand negative surprise)
• Analysis of free cash-flow and the ability to de-lever
• Leverage and coverage statistics
• Cash and available liquidity
• Amortization/maturity schedule
• Quality and salability of assets
• Access to capital markets
• Asset coverage
Management/Ownership Risk
While factors relating to credit analysis are crucial, the senior management of the company are responsible for establishing goals, objectives, and strategic vision for the business. In the end, a great management team can make a significant difference in the performance of a security.
Direct Communications. Portfolio managers or research analysts should have direct contact with senior management (i.e., one-on-one meetings or calls, company visits, etc.). Direct access is the best way to understand and evaluate management and can provide greater insight into the risk parameters for a specific issuer. Moreover, analysts should maintain an ongoing dialogue with company managements. During times of duress, if management is inaccessible, investor confidence in the company could be shaken, and the bonds may underperform.
Quality of Management. The quality of the senior management team is significant in making a good investment. While successful companies must pursue effective strategies, development and execution of those strategies hinge on the management team in control. Although management assessment is somewhat subjective, and improves with experience, the best qualities to look for in a management team include: low turnover, tenure and reputation within the industry, strong track record, timeliness in filing financial statements, forthrightness in responding to questions, strategic vision, a deep bench, and successful completion of stated goals. Great business leaders are able to effectively communicate the company’s strategy and vision, articulate the opportunities and risks confronting the company, and act decisively and proactively in times of change.
Private Equity Sponsors/Ownership. Often, a highly levered company may be owned by a private equity sponsor. In these cases, the equity sponsor drives the company’s strategic direction and financial policies, while the operating senior management (i.e., CEO, COO, CFO) usually have less influence in the overall direction and financial risk tolerance of the company. It is always important to keep in mind that the interests of the private equity sponsor in many cases may not align with bondholders. For example, sponsors may declare a large cash dividend as quickly as possible to enhance their equity returns, although this action may lead to deterioration in the company’s credit quality. If the sponsors have little capital at risk, they could try for a “swing for the fences” type strategy since they have little downside (having taken their invested capital out) but significant upside if the strategy pays off. This “no capital at risk” strategy is not ideal for bond investors, as the company may have little capital cushion, particularly in a faltering economy. The sponsor’s investment track record, default history, and record in paying down debt should be carefully examined. Another factor is the percentage of equity owned by the management team. If equity ownership is spread throughout management, they are more likely to be deeply engaged in the success of the overall enterprise.
Financing Philosophy. Investors must consider both the ownership’s and management team’s intentions regarding the company’s balance sheet. Is management comfortable operating with high levels of debt and leverage, or are they more conservative and prefer to have more financial flexibility and lower leverage? Is management comfortable with the current amount of debt or is debt pay down a key priority? How committed is management to paying down debt? Is management opportunistic in that they would consider making an attractive acquisition even if it involved increasing the financial risk profile of the company? If the management team is comfortable with the current level of debt, they might focus on using cash-flow toward paying dividends, share buybacks, or funding additional acquisitions. If debt pay down is a key priority, and the company generates a large amount of free cash-flow, the issuer’s credit metrics are likely to improve. Knowing management’s philosophy towards debt is of vital importance in forecasting the company’s credit profile as it will serve as a guide toward the application of free cash-flow. It also provides a guidepost from which to judge their success in achieving previously stated goals as well as their credibility. For example, if the management team has stated its intention to de-lever and then initiates a large stock buyback, the bonds are likely to underperform as the “credit story” has not met expectations, and investors may have diminished confidence in senior management.
Covenant Risk
A detailed examination of covenants is a critical part of credit analysis. Although each tranche of debt may contain its own specific debt covenants, collectively they impact the borrower’s overall credit risk profile and financial flexibility. Evaluating the collective impact of all of the company’s covenants (bank loan as well as bond covenants) is important in understanding the overall credit risk of a company. The presence of a strong covenant package within an issuer’s bank loan may have significant influence on bond performance. In certain cases, limited covenant flexibility may improve the overall credit profile of the company because it could create the opportunity for early redemption at a premium or limit increases in financial risk. Conversely, there are cases where limited covenant flexibility may prove to be a significant risk to a borrower’s credit profile as it could force a liquidity event at an inopportune time in the credit cycle. Covenants are covered in further detail as part of Step 3, the analysis of an individual security.
Step Two: Security Structure and Terms
A key consideration of a particular bond investment is its terms and structure. Most investors tend to favor bonds that possess terms and structure that are in line with or better than market standard. However, as terms evolve and change with market conditions, portfolio managers must understand the implications and risks associated with alternative structures, and if acceptable, ensure that they are compensated appropriately.
The following factors must be carefully evaluated.
• Issue size
• Ranking/seniority
• Coupon type
• Early redemption features
Issue Size
The issue size of a bond will influence its liquidity and general attractiveness to other constituents in the market. For example, an issue size that is less than $250 million may have a smaller investor base and therefore less trading liquidity. To the extent there is a seller of this security, the downside impact to the market may be greater given the lower trading liquidity and a narrower universe of investors willing to purchase a small, less liquid security. Conversely, mega-issues (greater than $1 billion issue size) may experience greater price volatility. As they tend to be liquid “benchmark” issues in the high-yield market, they may exhibit higher beta during aggressive movements in the overall market, as institutional investors are able to more easily execute trades and express their market sentiment.
Ranking/Seniority
The ranking and seniority of a bond are vital factors in assessing the risk and attractiveness of a security. Ranking and seniority refer to the location of the bond within the issuer’s capital structure as well as the priority of claim in the event of bankruptcy. The ranking and seniority range from and include: senior secured, senior secured second-lien, senior unsecured, senior subordinated, subordinated, and structurally subordinated. The more senior securities in the capital structure are generally accompanied by lower relative yields. Additionally, investors must ascertain the level of guarantees provided and where the tranches of debt sit relative to the assets of the company as well as the ranking within the capital structure. Portfolio managers should properly identify the risk associated with the ranking/seniority terms of the specific security so that they can determine the appropriate yield.
Maturity
A bond’s maturity involves both technical and credit considerations. From a top-down perspective, an investor may be concerned with a significant rise in interest rates and, therefore, favor a shorter maturity option within a given capital structure. From a bottom-up perspective, an investor may be comfortable with the short-term prospects and liquidity for a given credit, but much less comfortable with the longer-term viability of the company and, therefore, favor a shorter maturity option within a capital structure with multiple maturities. Lastly, uncommon maturity terms may lead to greater price volatility given the potentially smaller investor base interested in a “non-standard” bond. High-yield bonds have historically been structured with final maturities of between 7 and 10 years. More recently, however, issuers have come to market with longer maturities of 11 and 12 years to take advantage of the low interest-rate environment. These uncommon maturities have thus far been met with mixed results.
Coupon Type
While the high-yield market consists primarily of cash-pay bonds, alternative structures also exist, including: zero coupon, pay-in-kind (PIK), or PIK toggle. While the alternative structures tend to offer higher yields as a result of the less investor-friendly repayment terms, they also typically possess greater trading liquidity risk as they tend to appeal to a much smaller investor base within the high-yield universe.
Early Redemption Features
Early redemption features are common within the high-yield market. For example, the most typical bond structures are 8-year, noncall 4, or 10-year, noncall 5. This type of security is not callable for the first half of its life, but then is callable at the company’s option and according to a schedule that pays a premium to face value which declines as it nears final maturity. More recently, issuers have come to market with less call protection in exchange for a small, additional premium. Portfolio managers must be careful in evaluating early redemption features that may have a significant impact on returns as they can limit a bond’s potential upside.
Step Three: Covenants
Contained within the indenture of all high-yield bond offerings are certain covenants (or agreements) between the issuing company and bondholders. Covenants are essentially restrictions on the borrower/issuer imposed by the lender/bondholder that require the company to do or refrain from doing certain activities. The covenants are primarily designed to protect bondholders against credit deterioration that would hinder the company’s ability to service the interest and repay the obligations on a timely basis.
Covenants are often referred to as “tight/strong” or “loose/weak,” depending on the specific terms and ultimate financial flexibility they provide the issuer. A weak covenant package can significantly increase the risk of a high-yield bond investment, even though the credit’s business and financial risk profiles can be strong. As a result, the covenant package may not protect the bondholders by prohibiting enough actions by the issuer that could be detrimental to its ability to repay the bonds and service the interest.
Covenant analysis is a crucial part of any high-yield bond investment process. While a strong covenant package cannot offset the risk of a weak credit, it may provide significant financial protection to the investor. A weak covenant package may not necessarily preclude investment in a particular issue; however, it may increase the yield an investor demands due to the higher level of risk.
From an investment standpoint, there are four key covenants to analyze, as follows: Limitation on Indebtedness, Restricted Payments, Change of Control, and Limitations on Asset Sales.
Limitation on Indebtedness
The limitation on indebtedness covenant restricts the amount of additional indebtedness that an issuer can incur. Unless it is kept in proportion to operating cashflow and assets, additional indebtedness can ultimately dilute the claims of the existing bondholders and weaken the credit profile of the company due to the increased debt-service requirements.
Restricted Payments
The restricted payments covenant protects bondholders’ interests in the assets of the company by restricting the company’s ability to distribute money or assets outside the company, thereby preserving the company’s ability to repay its indebtedness. Undesirable distributions and asset transfers that are limited by this covenant include dividends, repurchases of equity, investments in unrestricted third parties, and retiring debt that is subordinate to the bonds before retiring the bonds. It is important to recognize that the restricted payments covenant does not limit acquisitions and capital expenditures, both of which should result in incremental cash-flow and return on investment. The test is ultimately backward looking in that it determines whether the company has earned the right to make a payment to benefit the equity of the company as opposed to the debt.
Change of Control
The change of control covenant requires the issuer to offer to purchase the debt at 101% of principal if a change of control occurs. It is the bondholder’s option to accept or decline the offer. In effect, this covenant gives a put option to the bondholder upon certain events. The rationale behind the change of control covenant is that it protects bondholders against a change in controlling interest by an owner who may have a different financial strategy for the issuer that could ultimately lead to deterioration in credit quality.
Limitation on Asset Sales
In contrast to its title, the asset sale covenant does not necessarily limit the ability of the issuer to sell assets. Its true purpose is to define the acceptable use of proceeds from asset sales. The proceeds must be used to permanently repay debt or to reinvest in replacement assets. The rationale is that the assets sold usually generate earnings and cash-flow to service debt and should be replaced with similar assets.
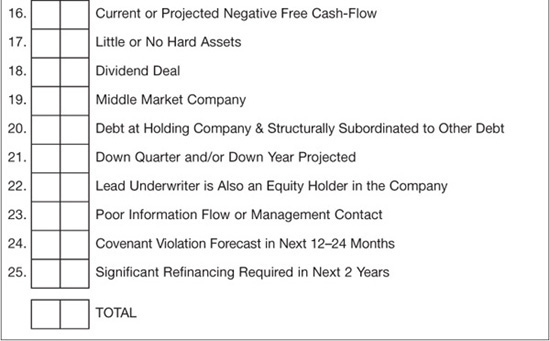
Step Four: Risk Assessment Checklist
One of the key methodologies to optimize a portfolio is to use a checklist of variables that can help to identify hidden risk factors. Similar to a pilot who is required to perform a checklist before any plane takes off, portfolio managers should engage in a similar rigid review. Exhibit 52–5 is a list of 25 factors that can cause unexpected losses and volatility. The more indicators that flash negative, the greater level of risk associated with the investment. This checklist is by no means a complete listing of all potential risk factors. However, it is meant to highlight certain risks that perhaps garner less focus and attention from investors.
EXHIBIT 52–5
Risk Assessment Checklist

Step Five: Trading/Liquidity Factors
While credit analysis is focused on assessing the financial risk of a particular bond issue, the analysis of trading and liquidity risk evaluates the additional volatility that may be experienced by a bond issue. Trading liquidity can hamper the performance of a bond issue that may possess a favorable credit risk profile, but the far more significant risk is that a poor trading liquidity profile could dramatically magnify the downside risk of a weak credit. It may be already difficult to garner investment interest and new buyers in a weak or deteriorating credit; however, it is considerably more challenging to develop new demand in a weak credit that also possesses poor trading liquidity. For example, a disappointing earnings announcement could result in a two-point drop in bond price if the issue possesses favorable trading liquidity, whereas the same announcement could result in a five-point (or greater) drop in price if the bond possesses thin trading liquidity. Portfolio managers should have extremely high conviction level in credits with limited liquidity and require higher returns in those situations.
Liquidity Risk2
Liquidity risk involves measuring the ability to sell a particular credit on a timely basis. While equities often trade on an organized stock exchange or electronically and buyers and sellers are matched, high-yield bonds trade over-the-counter. Bond investors are dependent on broker-dealers to make a market. Also, unlike equities, the majority of high-yield bonds do not trade on any given day. An interesting analogy is to think of the high-yield market as being like a lake that is one mile wide, but only inches deep. If a particular high-yield bond has limited liquidity, portfolio managers may be unable to execute their buy/sell decisions.
Portfolio managers should take into consideration the following key elements to assess the liquidity risk of a particular bond.
1. Public or private company: Private companies often possess less liquidity than public companies because there is either not enough information about the company in the market or the information is not widely dispersed. For example, a potential purchaser of an unregistered bond (e.g., Rule 144A) issued by a private company can usually get information about the issuer only by requesting it from the underwriter or trading desk. New purchasers may be reticent to ask for the information because they may signal to the trading desk their intentions to purchase the bonds, thereby causing the broker-dealer to raise its offered price for the credit.
2. Number of market makers and number of analysts following the issuer: The fewer professionals on Wall Street who trade or actively “follow” a bond reduce the available information on a company. Bond issues that have only one market maker and no analyst coverage may be so illiquid that they “trade by appointment” (meaning that a seller has to give an order to a broker-dealer who then tries to sell the bond over a period of time).
3. Number of tranches of debt in the capital structure: The more tranches, or issues, of debt that a company has outstanding, the higher the probability that more traders and analysts will follow a given credit. A large number of tranches provides more activity in an issuer because there are paired-trade possibilities, such as shorting senior bonds and purchasing subordinated bonds. The ability to trade across the capital structure in one credit increases the universe of investors interested in the bonds.
4. Accessibility of management: Bonds issued by companies with inaccessible management typically inhibit trading activity because investors lack sufficient information to give them comfort or conviction, particularly in volatile markets. If a management team is unwilling to talk when times are good, they are even more unlikely to talk when times are bad!
5. CDX-listed issuer: The CDX is a widely traded index of 100 Credit Default Swaps (CDS) that mirrors the broader high-yield market. The CDX, the underlying CDS, and the underlying bonds are all linked by the arbitrage that exists if the CDX becomes too cheap compared with the CDS or the actual bonds. Therefore, underlying bonds of CDS in the CDX tend to trade more frequently because investors may be executing arbitrage trades. Moreover, the price of CDX-listed issues tends to be more volatile because they are the most liquid credits.
6. Volume of trading activity according to TRACE: Broker-dealers are required to report high-yield bond trades to a self-regulating organization that makes some trade details of certain high-yield bonds publicly available. This system is called TRACE (Trade Reporting and Compliance Engine). Bonds that have a TRACE history typically have more liquidity because historical patterns and data points can be obtained and measured.
7. Issuer is a major company within its industry: Bonds of companies that have a real “presence” in their respective industries tend to have more liquidity for two reasons. First, if the underlying company is a major part of its industry, it becomes a proxy for the industry and allows investors to obtain exposure to a sector. Second, high-yield traders typically like to own and trade the largest credits in an industry sector.
8. Size of issue: The universe of potential buyers of a bond typically increases with the dollar size of the issue. The larger pool of potential purchasers increases the ability of a bondholder to sell a particular issue.
9. Ratings of issuer and issue: Higher-rated credits within the high-yield universe tend to trade more frequently because they are perceived as being more stable and have greater demand. Triple-C rated issues generally require more work and conviction to purchase, causing traders to be less willing to hold a bond that investors may need more time to analyze.
10. Crossover credits: Bonds that generate demand from both investment-grade and high-yield buyers, such as utilities, offer greater liquidity. High-yield bonds that are considered crossover companies typically generate a new class of investment-grade purchasers who from time-to-time dip down and buy the high-yield bond tranche. With a larger universe of such buyers and sellers, liquidity often improves.
Based on these 10 criteria, each credit should be designated as L1, L2, or L3. L1 credits are traded by multiple market-makers on a daily basis; L2 names are typically traded by two or more market-makers on a weekly basis; and L3 credits trade a few times per month by one or more market-makers, which can result in an inability to execute on a timely basis. In many cases, an L3 bond can become an “orphan” credit if the original underwriter no longer covers or makes a market in the credit.
The percentage of the portfolio represented by L1, L2, or L3 liquidity ratings should be calculated and monitored to determine the appropriate weighting in each category.
Step 6: Relative Value
Relative value is the final step in the bottom-up security analysis process. Once the credit and liquidity risks of an issue have been determined and evaluated, then the overall expected risk premium for the security can be appropriately established. Spread analysis is typically the most appropriate metric in determining if the security’s return is commensurate with its overall credit and investment risk.
Risk/Reward
Determining relative value in the high-yield market is more an art than a science. The age-old maxim “Buyer Beware” rings loudly in high-yield as all risk is not created equal! For example, it is much easier to compare and value the risk of financial leverage across two credits than it is to determine how much incremental return or yield is required to compensate for the potential risk presented by significant covenant flexibility that can be utilized to the detriment of bondholders. Some investors use ratings (usually assigned by Moody’s and/or S&P) to determine their credit risk and then evaluate the spreads on that basis. For example, a single-B rated issue yielding 500 basis points over riskless U.S. Treasuries may be considered attractive relative to another single-B rated issue yielding 350 basis points, or versus the current high-yield single-B index average spread of 400 basis points. However, in order to make this assessment, investors must assume that the credit ratings themselves are accurate, and that they are a “leading” indicator of credit risk. More importantly, investors should realize that credit ratings do not contemplate many of the investment risks discussed above, such as bond covenants, size of issue, quality of underwriter(s), number of market makers, Wall Street sponsorship, and information flow, to list a few. Relying on the credit rating alone to determine risk will not give a complete picture and can be a perilous exercise during certain stages of the credit cycle.
Comparables
The basic formula for assessing relative value is to compare the spread of the security being evaluated to the bond spreads of industry peers and other credits of similar risk. Exhibit 52–6 is a typical “comp sheet” that can help assess the relative value of one bond versus another.
EXHIBIT 52–6
Sample Credit Comparable Analysis
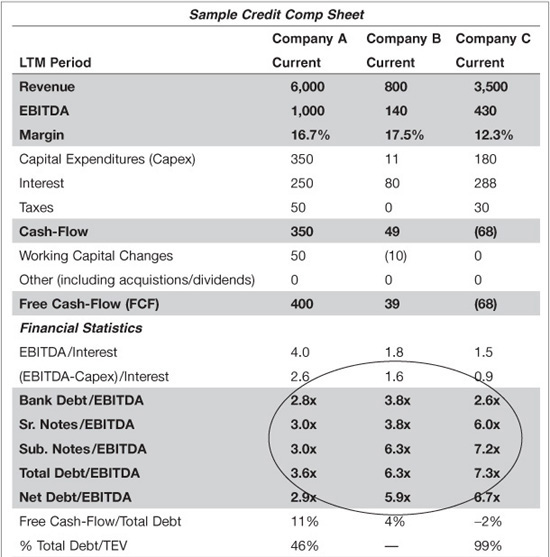
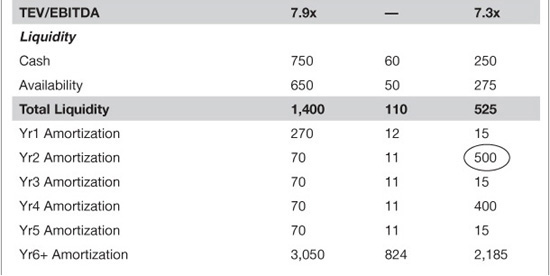
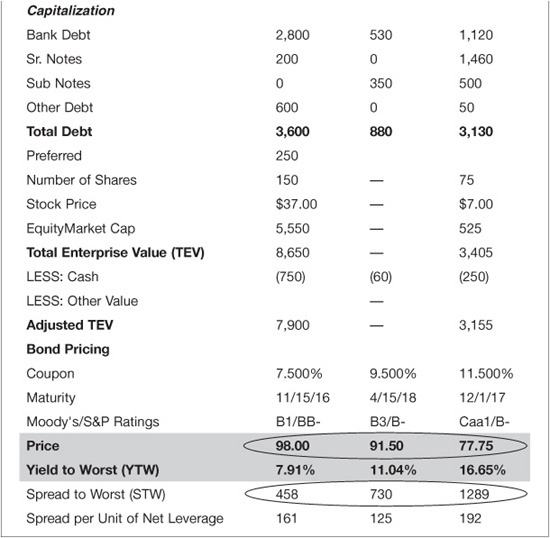
Analyzing the credit comparable on the next page, it becomes apparent that Company C is a weaker credit. As compared to the other two companies, Company C has higher leverage, weak interest coverage, negative cash-flow, and significant near-term amortization for which it does not appear to have ample liquidity to address. Given the higher risk credit profile, the spread on Company C’s subordinated notes is meaningfully wider than its comparables as one would expect. In contrast, Company A’s stronger credit profile has resulted in a meaningfully tighter spread than its comparables. Although it also has substantial debt amortization in the current year, it appears to have ample liquidity (as measured by its cash and availability) to absorb the amortization. Credit comparables should include a snapshot of the trailing 12-month operating results as well as a forward looking credit profile for the next 12 months.
Quadrant Analysis
Many investors use credit ratings to determine risk and evaluate comparable spreads. Given the prevalence of ratings in the marketplace and their acceptance among market participants, portfolio managers should not rely on these ratings as a primary assessment of creditworthiness. Rather, portfolio managers should construct a more comprehensive risk assessment that can be tailored to incorporate factors they deem appropriate.
Constructing a risk/return matrix can be helpful in determining a framework. Credits can be divided into four quadrants as shown in Exhibit 52–7 based on their level of risk and potential return. A description of each of these quadrants is as follows:
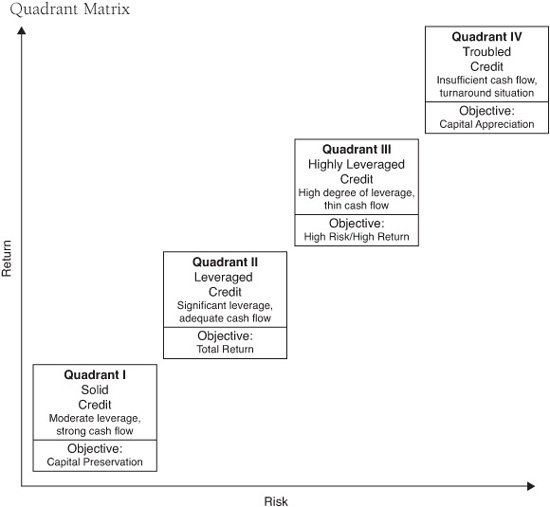
• Quadrant I: Solid credits with strong credit statistics, moderate leverage, and strong free cash-flow. Typical characteristics would include companies with predictable and improving cash-flows; deleveraging companies; and companies that have substantial assets well in excess of debt. Objective: Capital Preservation
• Quadrant II: Good credits with significant leverage that show stability and/or improvement in their credit profile via improved results and lower leverage. Quadrant II companies can appreciate or depreciate depending upon their ability to execute their business plans, and ultimate credit trend. These companies typically possess above average creditworthiness with adequate balance sheets and relatively weak asset value coverage of their total debt. Objective: Total Return
• Quadrant III: Weak credits with extremely high leverage and deteriorating or at risk credit trends. These credits have a small margin for error and, therefore, require higher yields to compensate bondholders for the additional risk. Typical characteristics include minimal to negative free cash-flow (best measured relative to total debt) and deteriorating credit statistics. They may also include relatively new companies, companies with large capital requirements, and companies with aggressive capital structures that utilize zero coupon, PIK or PIK/toggle notes. Asset value coverage of total debt is typically weak. Objective: High Risk/High Return
• Quadrant IV: Troubled credits that are stressed or distressed and could be in actual or technical violation of covenants. Bonds are likely to be impaired and therefore should require much higher equity-like returns. Objective: Capital Appreciation
When assigning quadrants to specific credits, they should be evaluated with an emphasis on the prospective, forward-looking view because the markets are more focused on where a credit is going rather than where it has been. Portfolio managers who are better able to correctly forecast credit trends should outperform their peers. Placing too much emphasis on past results could ultimately provide a myopic risk assessment and thereby limit the risk/reward equation and relative value analysis.
Within the quadrant concept, spreads can be analyzed relative to credits within the same quadrant. Given the potentially wide spectrum of credit quality within a specific quadrant, issuers may be further subdivided into lower and upper quadrants for greater segmentation. Once quadrants have been assigned, portfolio managers should compare spreads of companies within the same quadrant that are most similar. When possible, comparisons should be to companies within the same industry and quadrant. Other relative considerations include trading history, stock and bank loan/CDS prices, and duration.
Scenario Analysis
Scenario analysis is another tool to better identify relative value and determine an appropriate investment recommendation. This analysis is particularly useful in circumstances with multiple outcomes or potential event risk.
In Exhibit 52–8, the subject company has just announced a significant acquisition, although financing has not yet been determined. After assessing the amount of flexibility provided by the company’s existing covenants as well as taking into account current capital market conditions for debt and equity, the analyst can utilize a scenario analysis to determine a potential trading recommendation.
EXHIBIT 52–8
Scenario Analysis Example
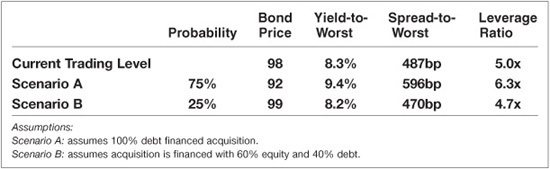
Given management’s prior comments and long standing financial policy, the analyst has assigned a 75% probability to a debt-financed acquisition as opposed to a more balanced combination of debt and equity. Likely potential trading levels are then assigned to each of the scenarios above based on the pro forma risk profiles. This scenario analysis indicates that there is six points of potential downside on the higher probability outcome as opposed to one point of upside on the less likely outcome. Based on this analysis, the recommendation would likely be to sell or reduce the position if possible, or at least proceed with caution.
Trading History
To the extent an issuer has had bonds outstanding for a period of time, portfolio managers should examine the trading history of those bonds. Exhibit 52–9 provides a list of some key trading history questions.
EXHIBIT 52–9
Key Trading History Questions
What is the issuer’s bond price history? If the bond has been volatile, in which case a higher risk premium may be more appropriate?
What is the issuer’s bond spread history relative to the current spread? Is it at the tight end or wide end of its historical range? Is it aligned with the credit profile?
What is the issuer’s bond spread relative to its industry or the high-yield index? How has this relationship trended over time? Is it at the tight or wide end of its historical range? Where is the price relative to where the current credit profile warrants?
What is the current spread level relative to the spread at issuance? Has it widened or tightened dramatically? Were the moves associated with a change in credit profile as opposed to more technical factors?
Stock Prices
Since many lower-rated companies are over-levered, their bond performance oftentimes is highly correlated to their stock prices. In some cases, equity prices may be a leading indicator, and in other cases bond prices may lead the equity markets. In any event, equity prices (if it is public) of the specific credit, or its public peers and competitors, may have a significant impact on bond prices. As equity prices rise or fall, the equity valuation of the company changes, which essentially measures the degree of “equity cushion” on the specific credit. For example, a stock price that has declined 20% may signal that the implied asset value cushion relative to the bonds has also been dramatically reduced, thereby increasing the overall risk of the credit. If a portfolio manager is looking at two similar credits within the same industry and the same leverage ratios, he or she would rather own the company with the higher Enterprise Value-to-EBITDA valuation multiple because it ultimately implies greater asset value coverage and thereby less risk (all other things being equal). In Exhibit 52–10, a company’s leverage has not changed dramatically over the last four quarters, but due to a severe decline in the stock price, the enterprise valuation of the company has fallen. As a result, the enterprise value coverage of total debt has declined dramatically, and the credit risk has increased. The equity cushion is the lightly shaded area in Exhibit 52–10.
EXHIBIT 52–10
Enterprise Value-to-EBITDA vs. Leverage
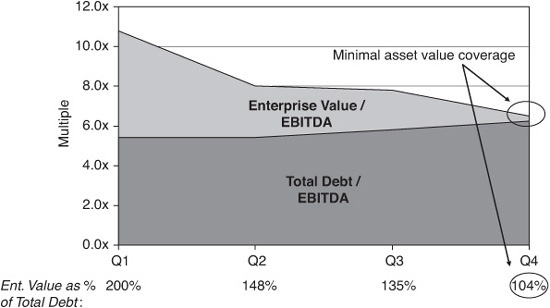
Examples such as this illustration are an important reason why portfolio managers should not take comfort in high implied levels of asset coverage based on the stock price and enterprise value. If equity investors no longer have a favorable view on the company’s growth prospects, multiples may contract. Thus, it is important for the credit analysis to include alternate independent methods of asset and enterprise valuation, while monitoring and considering movements in the current public equity value. Although credit metrics may not change dramatically in the near-term, a forward-looking viewpoint of the equity valuation may be important in determining perceived enterprise value coverage and trading outlook. In Exhibit 52–10, the 104% enterprise value-to-total debt coverage in the fourth quarter (Q4) suggests that the bond requires equity-like returns as its implied asset coverage is weak.
Bank Loan Prices/CDS
Portfolio managers should monitor the price of the senior instruments in the capital structure as well as single-name CDS trends. Moreover, the lines between high-yield bonds and bank loans are increasingly blurring as the two markets and investor bases converge. For example, if the yield on a company’s term loan is too tight to the yield on its bonds, it may signify that one or both instruments are mispriced. In order to make an appropriate comparison, portfolio managers must evaluate both yields on an equivalent basis since the bank loan yield is floating rate and based on LIBOR, whereas the bonds are fixed-rate and based on comparably dated U.S. Treasuries. Monitoring CDS trends also provides a window into potential changes in market sentiment towards a particular issue. Given the illiquidity of many high-yield bonds, it is sometimes easier for investors to express their credit opinion on a given issue by trading CDS as opposed to the underlying bond. As such, market sentiment may sometimes be more quickly reflected in CDS price movement before it is evident in the bond. Evaluating and monitoring all securities within the capital structure is essential to good security selection.
Duration
Duration measures the price sensitivity to yield as well as the percentage change in price for a parallel shift in yield. The longer the duration, the more sensitive the price will be to interest rate fluctuations. Overall, bonds of equal maturity with higher yields will have shorter durations than lower yielding issues.
Duration is an important consideration in assessing relative value apart from its sensitivity to changes in underlying Treasuries and determining the appropriate level of additional compensation required for going further out on the curve. First, credit risk will naturally increase with longer dated maturities as there are many factors that can change a company’s credit profile over time and have a more profound impact on a levered issuer compared with an investment-grade issuer. Second, to the extent there is near-term potential for a negative surprise, a longer duration bond should have more downside risk. As investors demand incremental yield to compensate for the risk, longer duration bonds should generally experience more downside risk.
TOP-DOWN HIGH-YIELD MARKET DRIVERS AND MACRO CONSIDERATIONS
While the bottom-up component of portfolio management should be the primary driver of security selection, it is important to incorporate a view on key macro top-down factors that will influence the markets as well as individual industries and credits. Understanding these drivers is necessary in evaluating past performance and building individual portfolios. Furthermore, macro considerations are a key component to providing the proper context for individual industry and credit allocations.
The high-yield market has eight primary drivers. The top-down (macro) component of the portfolio management process is further highlighted in Exhibit 52–11 and discussed below.
EXHIBIT 52–11
Top Down—High-Yield Market Drivers and Macro Considerations
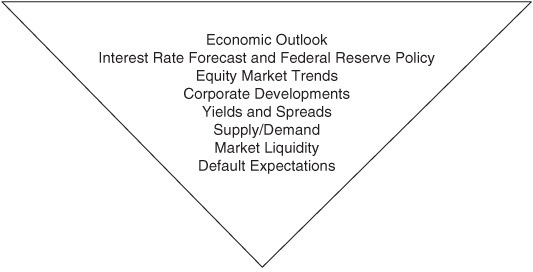
Economic Outlook
All top-down macro views require some form of economic analysis. An assessment of current and expected future economic conditions is essential to portfolio management, as the performance of the economy has a significant bearing on the performance and profitability of the companies that make up the high-yield market. An analysis of the general economy usually begins with the business cycle. One determinant of industry allocation decisions is a forecast of whether the macro economy is improving or weakening. A forecast that differs from consensus can have a significant impact on strategy and performance. Economic indicators such as GDP, inflation, consumer sentiment, consumer spending, business investments, unemployment, housing, and ISM provide the necessary data to develop an informed viewpoint and forecast. Ideally, this data should be supplemented with primary research derived from direct management contact. Complementing economic data with primary research can provide a higher level of conviction in formulating an economic forecast. Furthermore, it may highlight risks in the consensus view and provide portfolio managers with an opportunity to add value and enhance returns. Once the economic outlook has been created, it is necessary to establish the impact of that forecast on specific industries as not all sectors are equally sensitive to the business cycle. For example, a negative economic outlook may warrant a higher weighting in defensive industries and conservatively capitalized credits. Conversely, a positive forecast would favor more economically sensitive industries and credits.
Interest-Rate Forecast and Federal Reserve Policy
Rising rates and tightening monetary policy tend to have a negative impact on fixed income investments. While high-yield has historically shown a relatively low correlation to U.S. Treasuries as compared with many other fixed income asset classes such as investment-grade corporates, formulating an outlook on interest rates provides a framework for the construction of the portfolio. For example, if the interest rate forecast calls for a significant increase in interest rates, it may be appropriate to reduce a portfolio’s exposure to low coupon, longer maturities and the most interest-sensitive lower-yielding credits. Additionally, from a credit perspective, certain industries that are highly sensitive to interest rates (such as financials) may face additional risk and technical pressure in a rising rate environment.
Equity Market Trends
Contrary to popular belief, the high-yield market has demonstrated a much higher correlation to the equity markets than to 10-year U.S. Treasuries. For the 20-year period ended February 2011, the high-yield market exhibited a –0.06 correlation to 10-year Treasuries versus a 0.58 correlation to large cap equity according to StyleAdvisor. Although high-yield is a fixed income vehicle, the meaningful risk premium over Treasuries absorbs much of the volatility in Treasuries to deliver more equity-like returns. As equity markets fluctuate, so does the ultimate equity cushion for debt investors. Stronger equity markets typically signify stronger outlooks and earnings momentum; however, they also signify stronger equity cushion and asset protection for bondholders. The opposite is true when equity markets are declining. These dynamics are amplified for highly levered companies. In the end, it is generally more difficult for high-yield bonds to perform well when the equity markets are declining. Portfolio managers should keep this dynamic in perspective when managing risk.
Corporate Developments
Just as corporate fundamentals drive returns on an individual issuer, broader trends in overall corporate developments influence the high-yield market as well. To illustrate, a strong equity market may drive many private high-yield companies to go public and use the proceeds to pay down debt (a positive credit event). Conversely, an overabundance of available credit may incentivize private equity sponsors to raise debt in order to fund dividends to the equity holders at the expense of existing bondholders. To the extent corporate development trends are occurring on a broader scale, it may positively or negatively impact the high-yield market as investors anticipate other issuers that are likely to undertake similar positive or negative actions.
Market Yield and Spread (Relative to Historical Averages and vs. Other Asset Classes)
In determining asset allocations for their larger, overall portfolio, investors will ultimately consider the relative yield and spread of high-yield bonds to historical averages as well as to other asset classes and investment alternatives. This consideration provides an important perspective for high-yield portfolio managers as it is a key influence that drives overall demand in the high-yield market as well as the market technicals. In developing a relative perspective, portfolio managers should consider the following reference points and how they compare to historical ranges and averages:
• High-yield market spread over Treasuries
• High-yield market absolute yield
• High-yield market spread vs. investment-grade corporates
• High-yield market yield vs. dividend yield on the S&P 500
For example, if high-yield spreads are at all time highs, there should be strong technical pressure and ultimate demand to drive yields tighter as new buyers enter the market to take advantage of the opportunity. Additionally, if the incremental high-yield market spread over investment-grade corporates is at all-time historical tights, investors may decide that the incremental yield is insufficient, creating downside technical pressure.
High-Yield Market Supply/Demand
New issue supply and flow of funds play a meaningful role in the performance of the markets. While longer-term returns are more influenced by the overall corporate credit outlook and expected default rate, supply and demand characteristics may be difficult to forecast, but impossible to ignore. A record supply of new issuance can cause technical selling pressure on the secondary market in an otherwise fundamentally strong high-yield credit environment with low default expectations. Conversely, a lack of supply works to strengthen demand for existing issues in the secondary market and drive prices higher in a similar environment.
While new issue supply can easily be measured and monitored through multiple sources, demand is more difficult to ascertain. Although retail mutual fund flows are available on a weekly basis, they provide only a limited picture of the overall high-yield market demand. Retail mutual funds account for less than 15% of the overall high-yield market. Additionally, these funds may not accurately represent the sentiment of the larger institutional investors, which account for the majority of the high-yield market. While retail fund flows provide a window into overall demand, the largest high-yield managers with significant institutional assets can better measure demand through their own level of marketing activity and internal subscriptions/redemptions. Demand can have a significant impact on market returns, particularly in periods where new issue supply is limited.
Market Liquidity
Broker-dealers provide the liquidity needed to sustain active markets in high-yield securities. Over time, broader trends such as bank consolidation and new foreign entrants have had an impact on market liquidity. More recently, due to the consolidation among broker-dealers which was triggered by the financial crisis, a few smaller firms focused solely on secondary trading have entered the high-yield market to populate the void created in consolidation post the financial crisis. Apart from the broader trends, the amount of capital provided to broker-dealer trading desks is a significant determinant of the ability to effectively trade in the high-yield market. For instance, a broker-dealer’s senior management may decide (whether for macro concerns or company-specific circumstances) to “dial down” its risk exposure and hence limit the capital it provides to its high-yield trading desk. In turn, its traders become less willing to commit capital. As a result, investors may experience longer execution times, higher transaction costs, and greater price volatility. Market liquidity is also seasonal based on staffing and the new issue calendar. For example, late summer and periods surrounding holidays exhibit lower liquidity as broker-dealers operate skeleton crews and limit capital. Moreover, traders may be less willing to risk capital as they approach their fiscal year-end and thereby impact their year-to-date profit and loss. It is important for portfolio managers to understand both the secular and shorter-term trends that influence the ability to execute trades in the market.
Default Expectations
Since inception, the high-yield market’s most important driver is default rates. In periods where default rate expectations are low, the high-yield market tends to perform well as the lower default expectations influence two important components of high-yield returns: risk premiums and default loss.
Expected High-Yield Return = Risk-Free Rate + Risk Premium – Default Loss
In an environment of lower default expectations, risk premiums as measured through credit-spreads should decline as investors are less concerned with default risk and willing to accept less yield, thereby driving bond prices up. Additionally, the lower expected default risk reduces the expected default loss, hence increasing the overall expected high-yield return. Portfolio managers can temper their portfolio risk tolerance based on their overall default expectations. For example, portfolio managers may be willing to assume more risk when the outlook for default rates are trending lower, whereas increasing default rates may warrant a more defensive posture.
PORTFOLIO CONSIDERATIONS
Portfolio considerations are the framework applied by the investment managers to ultimately decide which securities are most appropriate for inclusion in a given portfolio. They act as the filter to screen the potential investment universe utilizing the bottom-up and top-down considerations discussed in this chapter. These portfolio considerations include:
• Client/portfolio objectives
• Risk tolerance
• Diversification
• Trading strategy
• Portfolio characteristics
• Risk controls
• Performance attribution
Client/Portfolio Objectives
Portfolio objectives are essential to providing the overall direction for portfolio construction and day-to-day investment decisions. A quote from poet Ella Wheeler Wilcox serves as a good analogy for the importance of these objectives. “One ship drives east and another drives west with the selfsame winds that blow. ’Tis the set of sails and not the gales which tells us the way to go.” With respect to portfolio management, investment objectives serve as the sails to guide the portfolio in the proper direction. The most vital portfolio objectives are return target and risk tolerance. The client or portfolio manager must decide what the primary investment objective is (i.e., income generation, total return, benchmark “hugger,” absolute return, or preservation of capital). Most portfolio managers have one primary objective and a secondary goal; for example, absolute total return as the primary objective and high current income as a secondary goal. The more clearly defined the objectives, the more likely the strategy will be effective and successful.
Risk Tolerance
In the universe of high-yield bonds, preserving capital and controlling risks are paramount factors in generating superior returns over a full credit and economic cycle. Calibrating the portfolio’s risk tolerance goes hand-in-hand with the portfolio’s investment objective.
For example, a total return strategy will necessitate a higher-risk tolerance, as managers must buy higher-yielding issues with greater risk premiums in order to achieve the high return objective. However, these greater returns and higher risk premiums will likely result in greater volatility of returns as well a higher probability of default loss. Ultimately, portfolio managers must clearly define whether their core risk tolerance is conservative or aggressive and maintain an unwavering style in the face of changing markets. Although it is feasible to beat the benchmark with a conservative strategy in a down market, or with an aggressive style in an up market, the combination of aggressive/conservative style outperforming in both bull and bear markets is extremely challenging and flawed. The lack of trading liquidity and the unavailability of many issues in the high-yield market inhibits the ability of portfolio managers to shift between styles in a short time frame. While a portfolio manager’s core strategy and risk tolerance must remain intact in order to succeed over an entire market or credit cycle, this should not preclude portfolio managers from increasing or decreasing their risk tolerance within their core conservative or aggressive strategy as market conditions change. However, these changes in risk tolerance must remain incremental as opposed to radical. Success is measured by achieving the highest risk-adjusted returns over an entire market or credit cycle.
Diversification
A key factor in reducing risk and helping to achieve return objectives is diversification. Diversification should not simply be measured by the number of investments held in a portfolio, but must be evaluated on many critical levels in order to appropriately manage and lower the overall risk. One of the most common mistakes portfolio managers make is that they “fall in love” with an industry and/or a credit and fail to properly diversify their high-yield portfolios.
There are several key factors to take into account in assessing a portfolio’s diversification including:
• Issuer concentration
• Industry concentration
• Risk
• Liquidity
• Duration
Issuer Concentration
Diversification by issuer should be measured on several levels. Number of holdings and average position size are one of the most important diversification measures. Some investors may believe that a more concentrated “best ideas” approach to portfolio management (<35 issuers) will achieve the highest returns; however, it may do so at a much higher level of risk given that the most severe credit losses tend to be the unexpected ones. Conversely, some portfolio managers may believe that a large number of holdings (>200 issuers) provides greater protection against individual loss as well as smaller tracking error versus a given benchmark; however, this is typically more of an index fund approach and it is difficult to argue that a portfolio manager is adding much value in this scenario. Ultimately, a properly diversified portfolio should target position sizes of 1% to 2% on average per name in order to balance the benefits of diversification with the opportunity for greater value added. It is important to remember that larger portfolios will, by necessity, be forced to hold many more issues as their size limits the desired amount of a given issuer that can be held. In addition to the number of holdings and average position size, individual issuer limits and top 10 concentrations should also be considered. In a properly diversified portfolio, most portfolio managers should maintain diversification percentages with limits of no more than 3% per issuer, and the portfolio’s top 10 holdings should not exceed 25% of the portfolio. Portfolio managers must also make certain that their top 10 positions generate the best returns. If the top positions are underperforming, it is extremely difficult to achieve superior results.
Industry Concentration
Industry concentration levels should be held to no more than 15% to 20% and should be reserved for those industries with the strongest technical and fundamental characteristics. Additionally, the portfolio’s five largest industry weightings should represent less than 50% of the total assets. Proper diversification should not only reduce a portfolio’s volatility, but these weightings should help mitigate the effect of unexpected announcements by an issuer or events that affect an industry in general.
Risk
Managing risk is a critical role of the high-yield portfolio manager. Most investors look to evaluate the ratings (e.g., Moody’s/S&P) distribution of the portfolio and monitor concentrations across the ratings categories. However, portfolio managers should maintain their own proprietary framework for evaluating and monitoring credit risk exposure and concentration. Another important risk factor is to identify and monitor the percentage of holdings by the lead underwriter, senior lender, and private equity sponsor. Lead underwriters and senior lenders are important because not all underwriters and lenders are equally committed to the asset class. Some underwriters-brokers are active in high-yield when there is a bull market and abandon their efforts when the market declines, leaving the purchaser holding an orphaned bond. Moreover, broker-dealers possess varying degrees of capital on their trading desks. Private equity sponsors, meanwhile, have track records that cannot be ignored. Some private sponsors are known for frequently taking major dividends out of their LBO companies, thus leaving the entities more leveraged with no benefit to the debt holders. Overconcentration in any of these factors could jeopardize performance over the long term.
Liquidity
Liquidity risk involves measuring the ability to sell a particular credit on a timely basis. If a particular high-yield bond has poor liquidity, a portfolio manager may be unable to execute a buy/sell decision. The percentage of the portfolio represented by L1, L2, or L3 liquidity ratings should be calculated and monitored. Concentration in L3 credits that trade sporadically should be a key focus as the downside risk to these holdings is amplified by their illiquidity.
Duration
For the reasons discussed above, a bond’s duration is an important driver of its volatility. Portfolio managers must consider their overall exposure to both longer and shorter duration bonds. Concentrations in either category can position the portfolio either more defensively (short duration) or more offensively (long duration). It is important to evaluate these concentrations and ensure that they are aligned with the portfolio manager’s overall market outlook and portfolio objective.
Trading Strategy
Portfolio managers generally have trading styles that capture their bias toward generating short-term trading profits versus focusing on longer-term outperformance over an entire credit cycle. Given the significant transaction costs and liquidity limitations of the high-yield market, short-term trading can be costly. Furthermore, it incorporates a greater degree of risk associated with attempting to time the market that can impact long-term performance. Regardless of the type of trading strategy, portfolio managers must develop and adhere to a buy and sell discipline that reflects their style and philosophy.
Buy Discipline
In executing a buy decision, a step-by-step process is required to ensure consistency and disciplined decision making. It is critical for portfolio managers to employ a rigorous bottom-up credit/security selection process complemented by top-down macro considerations. Portfolio managers should not sacrifice this process in the name of expediency or believe they might miss a “hot” opportunity. If there is not sufficient time to complete adequate diligence on a particular issue, the investment should not be made. The optimal investment should exhibit positive characteristics across all six of the key security analysis steps discussed above and align with the overall investment objectives and risk tolerance of the portfolio. For example, portfolio managers should bifurcate the decision of whether the company is a good credit from whether the credit’s bonds are attractive on a relative value basis.
Sell Discipline
Having a disciplined sale process is crucial for high-yield investing. Knowing when to sell is often times more important than knowing what to buy because losses are typically greater than gains due to the call constrained feature inherent in most high-yield bonds. The ability to execute a sell decision can separate an average portfolio manager from an extraordinary one. The three primary reasons to sell a bond are:
• Credit deterioration
• Relative value (risk/reward imbalance)
• Management drift
Strong credit analysis and continuous in-depth monitoring are key components of managing credit risk as the security analysis process does not end once a security is purchased.
Credit Deterioration. If a credit is undergoing (or forecasted to undergo) a fundamental change that may significantly increase the risk of default, the security should be sold. The more proactive a portfolio manager is, the higher the overall portfolio return as price deterioration and default loss are minimized.
Relative Value. While fundamental reasons should always be the most significant sale criteria, relative value and managing the risk/reward balance are vital factors in driving long-term returns. For example, an issuer may not necessarily be at near-term risk for default, but if its risk profile has increased (or is forecasted to increase) materially, there may be a sale opportunity if yields have not yet reflected this concern. Conversely, if a credit’s yield has tightened well beyond the assessed risk, the bond should also be considered for sale. Lastly, credits that have shown significant improvement in their credit risk profile may no longer offer attractive yields. Although the credit profile may now be much stronger, an investment-grade credit profile may not be appropriate for a high-yield portfolio objective.
Management Drift. As previously discussed, the quality of the management team is a significant factor in analyzing a company. The leadership and veracity of management are paramount in making this assessment. To that end, bonds of a company where the management team deviates from its previously stated goal(s) or misleads investors must be sold. These management teams present a higher level of risk that is difficult to assess or quantify.
Red Flags
An important complement to a strong sell discipline is to have a process for uncovering potential risks that may not have been uncovered through traditional monitoring. Price drift and credit drift are two key elements to monitor. Bond prices should be monitored for declines and necessitate automatic reviews for declines of 10%. While ongoing credit analysis may not have uncovered a significant enough change in risk to justify the price movement, it is important discipline for the manager to appreciate and understand the reason for the movement. Credit drift is also an important element to monitor. For this purpose, the credit drift to monitor should be based on the proprietary method by the portfolio manager as discussed above. Reacting to changes in the major rating agencies’ (e.g., Moody’s and S&P) published credit ratings will invariably be a poor strategy as the market may have already priced-in the revised published credit ratings.
Portfolio Characteristics
A key element of portfolio management is monitoring and evaluating all of the portfolio’s holdings. Some of the characteristics to monitor include yield-to-worst, spread-to-worst, average price, ratings, and risk, as well as the diversification considerations discussed above. Monitoring a portfolio’s characteristics is an important tool in portfolio management as it helps ensure a portfolio’s holdings are in line with macro considerations and portfolio objectives as opposed to solely a result of bottom-up selection. Daily and weekly review is necessary so that portfolio managers can make informed decisions based on actual facts that reflect changes in the market rather than “seat-of-the-pants” intuition. Organized, customized, and detailed reports showing percentages and variance calculations are essential for critical decision making.
Risk Controls
One of the keys to avoiding significant losses is to establish firm risk control procedures and to develop and maintain a formal credit review process that examines the key risk factors covered in this chapter, namely credit risk, liquidity risk, and portfolio/diversification risk.
Risk controls are typically talked about but are seldom enforced in many money management organizations. Most times, organizations undertake serious, comprehensive risk controls only after a crisis. However, portfolio managers should carefully measure and monitor all three types of risk. Implementing a front-end compliance system to monitor key parameters is a critical tool for controlling risk and helping to guide a portfolio’s alignment with its objectives. A front-end compliance system typically involves an integrated portfolio management and trading system in which portfolio constraints and limitations are categorized and monitored real-time. As a result, a portfolio manager is unable to enter a trade order that does not comply with the portfolio’s guidelines or risk tolerances. A comprehensive front-end compliance system compares much more favorably to back-end compliance systems, which only capture violations or higher than desired exposures once a trade has already been executed. Monitoring portfolio concentrations and diversification is also another important element of risk controls.
Performance Attribution
Performance attribution is an important tool that enables portfolio managers to assess individual performance and refine the strategy. The objective is to break down the variance between a portfolio’s active returns and the returns of the passive market into various segmented detail for further analysis. This analysis serves to illuminate the portfolio manager’s decision-making process and reveal factors that benefited or detracted from performance for a given period. It is important to identify the many flaws inherent in utilizing a passive market index as the benchmark, particularly in high-yield, where the relative illiquidity of its underlying constituents makes the index nearly impossible to replicate in practice. Performance attribution serves as a helpful reference for portfolio managers to better understand the results of their investment decisions as well as to guide future adjustments to the portfolio.
KEY POINTS
• High-yield bonds are a unique and dynamic asset class that combine the characteristics of both fixed income securities and equities. As such, the overall approach to managing a high-yield portfolio must involve an inherent underlying focus of the three key risks: credit risk, liquidity risk, and portfolio risk.
• High-yield portfolio management incorporates three key focus areas: (1) bottom-up credit/security analysis; (2) top-down high-yield market drivers and macro considerations; and (3) portfolio considerations. All three elements are critical to effective portfolio management and the individual security selections occur at the intersection of these focus areas.
• The bottom-up credit/security analysis serves as the foundation for the investment decision. While credit analysis is arguably the most important component of the investment process, security structure/terms, covenants, trading liquidity factors and relative value ultimately determine if a “good credit” will make for a “good investment.” It is important to emphasize that all of the bottom-up steps are significant in their own right, and that a favorable assessment on many of the steps may not necessarily outweigh an individual risk component that is identified in the process.
• Understanding and evaluating the top-down high-yield market drivers and macro considerations are another critical component of high-yield portfolio management. While the bottom-up component of portfolio management should be the primary driver of security selection, it is important to incorporate a view on key macro top-down factors that will ultimately drive/influence the high-yield market as well as individual industries and credits.
• Portfolio considerations are the framework applied by the portfolio manager to ultimately decide which securities are most appropriate for inclusion in a given portfolio. They create the filter that is used to screen the potential investment universe utilizing bottom-up and top-down considerations.
• The high-yield market offers favorable return opportunities, but investors must also remember the old adage: The greater the return, the greater the risks! Selecting securities with the highest yields is easy. Delivering consistent and superior risk-adjusted returns with lower volatility is what sets apart the best portfolio managers from the average.
• High-yield securities earn interest on weekends and holidays, while equities do not.