
CHAPTER
FIFTY-SIX
INVESTING IN DISTRESSED STRUCTURED CREDIT SECURITIES
Executive Vice President
Pacific Investment Management Company
The structured credit market encompasses securities backed by a wide range of assets. Structured credit securities are often secured by residential mortgage loans, commercial mortgage loans, student loans, credit card loans, auto loans, corporate loans, or other structured credit securities. Nevertheless, there are numerous structured credit securities that are backed by more idiosyncratic collateral types such as aircraft, shipping containers, railcars, restaurant franchise right cash-flows, tobacco tax revenues, airport fees, and small business loans. In a buoyant market, a strategy of investing in distressed structured credit securities may not be feasible, but a fixed income investor should be sufficiently familiar with the strategy to take advantage of the opportunity, should it present itself. This chapter discusses the distressed residential mortgage investment strategy in detail, which is a subset of the distressed structured credit securities investment strategy. Ideas from the distressed residential mortgage investment strategy can often be applied to investments in other sectors of the structured credit market.
BACKGROUND
The unprecedented decline in residential housing prices shifted the bulk of the existing universe of nonagency (not guaranteed by any agency of the government such as Fannie Mae, Freddie Mac, or Ginnie Mae) mortgage-backed securities to the distressed market by the end of 2007, leading to a development of a distressed mortgage-backed securities investment strategy.
The author expresses his gratitude for the insights provided by Chris Dialynas.
Nonagency mortgage-backed securities are created by aggregating the cash-flows from a pool of mortgage loans into a trust and distributing these cash-flows between various tranches according to predetermined rules. Securities that have the highest priority in the cash-flow distribution waterfall (and consequently are least exposed to credit risk) were sold to risk-averse buyers (such as banks, insurance companies, and money managers), which were willing to accept a lower yield to purchase the securities. In addition, an important factor in the purchase decision of the more risk-averse buyers was the fact that these securities were typically rated AAA by a nationally recognized rating agency (such as Moody’s, S&P, or Fitch).
By 2010, national housing prices had declined by 29% from the peak, and mortgage credit performance had significantly underperformed original expectations (from the time of deal origination, where a stress scenario housing price assumption typically assumed flat housing prices). In fact, performance was so poor that even the most senior tranches of most securitizations that were created in 2006 and 2007 have now suffered partial principal writedowns or are expected to sustain partial principal writedowns in the future.
As the rating methodologies of Moody’s, S&P, and Fitch all require that a bond that suffers any writedown at all (even if 99.99% of the principal is paid back at par) be downgraded to CCC or lower, the vast majority of the nonagency mortgage-backed securities that were issued in 2006 and 2007 have now been downgraded to CCC or lower by all rating agencies. Rating agency downgrades of nonagency mortgage-backed securities are important because many investors (including many of the largest banks, insurance companies, and money managers) are explicitly prohibited from either purchasing or holding securities once the rating agency ranking has been downgraded below a certain threshold. In addition, even if an investor is not constrained by rating agency ranking (e.g., hedge funds or distressed funds), bonds with lower rating agency ranking tend to finance on poorer repo terms, thus reducing the levered yield for such securities.
Consequently, the plunge in residential housing prices not only had a negative fundamental impact on nonagency mortgage-backed securities (due to the impact of defaults on the underlying mortgage loans, leading to principal writedowns), but also had a very significant negative technical impact on the marketplace (due to forced selling from ratings constrained investors). The forced selling from ratings constrained investors resulted in a decline in market trading levels. Following this price decline, many levered investors were hit by margin calls, leading to further forced selling (even from investors that were not ratings constrained), resulting in a self-sustaining decline in market trading levels. In addition, unlike many niche sectors of the investment universe, there was no large distressed buyer willing to take advantage of the forced selling.
To begin with, the nonagency mortgage-backed security marketplace is very large ($1.4 trillion par as of year-end 2010), and reasonably complicated (especially for nonpractitioners). In addition, since almost all market participants that understood how to analyze nonagency mortgage-backed securities already viewed nonagency mortgage-backed securities to be very “cheap” well before the trough in prices had been reached, there were very few investors who had the combination of capital, credibility, and knowledge of how to analyze nonagency mortgage-backed securities to stand in the way of the forced selling. At the nadir in early 2009, senior pass-through securities backed by 2006 or 2007 vintage prime ARM collateral (which were originally sold around par) had plunged to the high $40s (per $100 par). Subsequently, the market rallied, such that these bonds traded in the $80 area (per $100 par) by the end of 2010.
ECONOMIC (CREDIT) RISK VERSUS FINANCIAL (LEVERAGE) RISK
Cash-flows from each of the underlying mortgage loans are distributed among the various tranches according to a prespecified cash-flow distribution waterfall. Note that it is likely that with a pool of even the lowest quality mortgage loans, at least some cash-flow will be generated, while with a pool of even the highest quality mortgage loans it is possible that one loan could default and sustain a loss (and thus the pool as a whole would suffer a loss). Consequently, by adjusting cash-flow priorities and deal structure it is possible to create very safe bonds from even the riskiest collateral, and to create risky bonds from even the safest collateral.
An investor in nonagency mortgage-backed securities has two main methods to increase returns—either take economic (credit) risk, or take financial (leverage) risk. Employing either strategy will increase the investor’s returns in the event of a favorable scenario, at the expense of a reduced return in a negative scenario. An investor taking economic (credit) risk will purchase nonagency mortgage-backed securities either backed by weaker underlying collateral (i.e., bonds backed by subprime collateral instead of bonds backed by prime collateral), and/or securities that have less structural protection (i.e., less senior in the cash-flow waterfall). In contrast, an investor that takes financial (leverage) risk will borrow funds (either explicitly in the repo market, or implicitly in the derivatives market) and use the borrowed funds to purchase additional securities.
In an environment in which mortgage credit performance deteriorates (which is most likely caused by a decline in housing prices or reduced availability of mortgage credit), a strategy of taking mortgage credit risk may result in poor returns, as voluntary prepayments are lower than expected and defaults are higher than expected. In contrast, a strategy of employing financial leverage risk may produce attractive returns if reasonable access to repo funding is maintained, mark-to-mark price declines are not so large as to cause forced selling and the deterioration in mortgage credit performance is not sufficient to negatively impact the cash-flows of the higher-quality bonds in the portfolio that is employing financial leverage instead of credit risk. On the other hand, in an environment in which financial conditions deteriorate (even if the circumstances are not related to the state of housing market), a combination of reduced repo availability and mark-to-market price declines may lead to margin calls and forced selling (leading to very poor performance for a strategy based on financial leverage). Note that by buying securities that are less senior in the cash-flow waterfall, an investor is in effect locking in nonrecourse term funding on the investment, with the funding rate being the hold-to-maturity yield of the more senior bonds in the waterfall, and the investment being the tranche that was explicitly purchased, plus all of the tranches which are more senior in the cash-flow waterfall.
ANALYSIS OF NONAGENCY MORTGAGE-BACKED SECURITIES
Analysis of nonagency mortgage-backed securities can generally be divided into three main categories: (1) analysis of the underlying mortgage loans; (2) analysis of the servicing, which can impact cash-flows that are received from underlying mortgage loans; and (3) analysis of the deal structure whereby the cash-flows from each of the underlying mortgage loans are divided among the various securities. All three types of analysis must be completed to formulate an informed investment decision.
Analysis of Residential Mortgage Loans
Analysis of residential mortgage loans involves a review of various attributes for each of the underlying mortgage loans backing the mortgage-backed security, with the end goal of generating a vector of prepayment, default, loss severity, and delinquency rates for each of the mortgage loans in the pool under a variety of scenarios. While one is often tempted to simplify the analysis by assuming that the pool consists of one loan with the “average” of the characteristics of each of the underlying loans, such a simplification could lead to erroneous analysis due to the nonlinearity of various loan characteristics on the likelihood of default and prepayment. For example, a mortgage pool with two loans, each with a loan-to-value ratio of 80%, likely has a much lower loss expectation than another mortgage pool with two loans, one with a loan-to-value ratio of 60%, and the other with a loan-to-value ratio of 100% (since the likelihood of default increases dramatically as the amount of equity that a borrower has in his or her property declines). Consequently, the ability to separately analyze each mortgage loan in the pool will lead to much more accurate results than simply lumping all of the loans together and considering the pool of loans to be the “average” mortgage loan.
Predicting mortgage loan voluntary prepayment, default, loss severity, and delinquency rates will depend upon various mortgage loan characteristics. Mortgage loan characteristics can generally be divided into three main types: (1) static loan characteristics, (2) dynamic loan characteristics, and (3) economic drivers. Static loan characteristics are various data that are obtained at the time of the loan origination, such as credit score, debt-to-income ratio, loan-to-value ratio, lien position, combined loan-to-value ratio (the loan-to-value ratio if all mortgage loans encumbering the property are included), original loan size, zip code, etc. Dynamic loan characteristics are observed subsequent to the loan origination, and include loan dependent information such as delinquency status, refinance incentive, and mark-to-market loan-to-value ratio. Economic drivers are factors which are observed subsequent to loan origination, which can affect numerous loans; such drivers can include regional housing price changes and mortgage rates.
By reviewing historical data, one can construct a mortgage credit model that can predict voluntary prepayment, default, loss severity and delinquency rates for each loan in a mortgage loan pool under various economic scenarios. Although in theory it may appear to be relatively simple to formulate a mortgage credit model, it is difficult to do so in practice. Note that there are numerous variables to consider, many variables appear to change at once (making it difficult to calibrate the model), and there are numerous problems with the data itself (either due to misreporting on the part of participants in the mortgage origination process, or differences in reporting by issuer). Furthermore, given the large data sets to be analyzed (millions of loans, with numerous data for each month of historical performance data), it may be necessary to employ specialized computer systems such as grid computers with hundreds of microprocessors in order to compute model projections within a reasonable time period. In addition, as a mortgage credit model’s foundation is historical data, one should also use model projections with caution, especially when attempting to predict what will happen in scenarios that are significantly different from what has happened before (given the ever-increasing likelihood of unanticipated actions in such scenarios, such as governmental public policy activity).
Analysis of Residential Mortgage Loan Servicing
The servicer’s role in a mortgage-backed security transaction is to collect the cash-flows from the underlying mortgage loans. Servicers are generally paid a fee on a monthly basis, which is calculated as a percentage of the loan balance being serviced, regardless of what tasks the servicer actually performs. In an environment of increasing housing prices with few delinquencies, the servicer has a relatively simple task, essentially receiving checks from borrowers and cashing them. On the other hand, in a declining housing price environment with skyrocketing delinquencies, the cost of servicing will increase dramatically as the servicer will need to absorb increased costs of collection procedures. In addition to the increased costs of collection when loans become delinquent, servicers are generally required to advance contractual interest and principal payments to the trust (even for delinquent loans). Even though the servicer is entitled to recoup the advances when the loan is liquidated, a capital constrained servicer may have liquidity pressures if the percentage of delinquent loans in its servicing portfolio increases.
Pursuant to deal documents, servicers usually have a duty to maximize the present value of cash-flow to the trust when making servicing decisions. Nevertheless, deal documents typically provide the servicer with wide latitude in determining which decisions maximize present value. The vast majority of mortgage loans in nonagency mortgage-backed securities transactions are serviced by affiliates of large banks. In addition to servicing a particular mortgage loan in a mortgage-backed securities transaction, the bank may have originated the mortgage loan, invested in securities backed by the mortgage loan, or may own a second lien mortgage that is subordinated to the first lien mortgage in the mortgage-backed securities transaction. Consequently, the servicer may have an incentive to operate in a manner that maximizes their recovery at the expense of other investors.
Given the substantial decline in home prices and skyrocketing delinquency rates, there have been substantial public policy developments attempting to direct servicers to “keep the borrower in the house,” and only foreclosing on the property as a last resort. One way to attempt to keep the borrower in the house is to modify the mortgage loan in order to reduce the likelihood that the borrower will default.
Loan modifications can take many forms. When the housing market was buoyant, a common type of loan modification was a loan capitalization. Under a loan capitalization, delinquent mortgage payments are added to the loan balance, and the borrower was deemed to be current (although would now have a larger mortgage balance to repay). This type of loan modification works well if the borrower became delinquent as a result of inadvertently forgetting to make their mortgage payment, or had a temporary (and now resolved) interruption in income (as the borrower has the ability and willingness to pay, and the loan capitalization places the borrower back into current status and allows them to resume making mortgage payments).
In an environment in which housing prices plunge and the economy weakens, the main causes of delinquency are an inability to afford the required payments (if for example the homeowner loses his or her job), or an unwillingness to pay (if the borrower has a negative equity position in the property). A loan capitalization modification does not resolve these more serious drivers of ability to pay and willingness to pay. Consequently, interest rate reduction modifications (reducing the interest rate on the mortgage) or principal forgiveness (reducing the principal balance of the mortgage) modifications have proved to be more successful at keeping the borrower in the house than loan capitalization modifications.
Due to the servicer’s expanded involvement in the resolution of delinquent loans, as the performance of the mortgage pool deteriorates, bond cash-flows (and hence bond valuation) become increasingly sensitive to servicing practices. Given the fact that a servicer’s profitability has a very tenuous relationship with a mortgage-backed securities investor’s returns, when making investment decisions, one must be cognizant of the conflicts of interest between those of a servicer and those of a mortgage-backed securities’ investor when making investment decisions.
Analysis of Deal Structure
Nonagency mortgage-backed securities are created by aggregating the cash-flows from a pool of mortgage loans into a trust and distributing these cash-flows between various tranches according to predetermined rules. Given the fact that there are thousands of nonagency mortgage-backed security deals, each with its own cash-flow waterfall, many market participants use third-party cash-flow modeling systems that project the distribution of cash-flows between the various mortgage-backed security tranches when provided with loan-level, group-level, or deal-level voluntary prepayment, default, loss severity, and delinquency assumptions. While such third-party cash-flow modeling systems are generally accurate, there have been numerous cases in which cash-flows have not been modeled correctly, often leading to a material impact on bond valuation. Consequently, it is extremely important to carefully review deal documents and verify that the modeled cash-flows are consistent with the deal documents before executing trades.
An Illustrative Example
We now discuss the analysis of a sample nonagency mortgage-backed security, a super-senior tranche, backed by negative amortization adjustable-rate mortgages.
Exhibit 56–1 highlights the deal structure of the bond. One can observe that there are numerous A tranches, with an A included in the tranche name (i.e., 1A1, 2A1, etc.). These A tranches, were originally rated AAA, and are senior in loss allocation priority to the M tranche, which is senior in loss allocation priority to the B tranches (which have a B in the tranche name—B1, B2, etc.). Given the weak performance of the collateral pool to date, losses have been higher than expected. As a result, many of the subordinate tranches have now been written off. The B2, B3, B4, and B5 tranche have been completely written off as a result of the losses that have been realized to date. Future losses on the underlying collateral will now be used to write down the B1 tranche, after which subsequent losses will result in writedowns on the M tranche before the A tranches begin to suffer writedowns.
EXHIBIT 56–1
Sample Bond Loss Allocation Structure
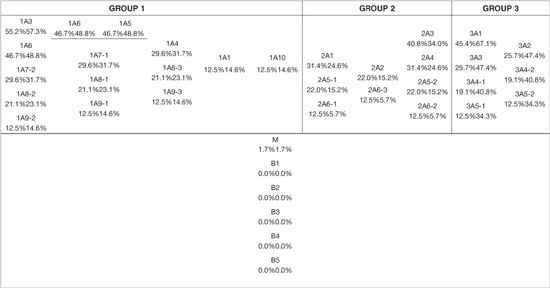
Although all of the A tranches are senior in the loss allocation priority to the M and B tranches, there are also differences in loss allocation priority between the A tranches themselves. First, there are three different pools of collateral. Cash-flow (and losses after the M and B tranches have been written off) from pool 1 is usually distributed between the 1A tranches (1A1, 1A2, etc.), cash-flow (and losses after the M and B tranches have been written off) from pool 2 is usually distributed between the 2A tranches (2A1, 2A2, etc.), while cash-flow (and losses after the M and B tranches have been written off) from pool 3 is usually distributed among the 3A tranches (3A1, 3A2, etc.). Second, by reviewing deal documents, one can observe that the 2A3 tranche is senior in loss allocation priority to the 2A4 tranche, which is senior in loss allocation priority to the 2A5 tranche, which is senior in loss allocation priority to the 2A6 tranche. In fact, given the substantial credit protection provided by more junior tranches in the capital structure, if losses were to be realized immediately, collateral losses would need to amount to 40.9% of the outstanding collateral balance before the 2A3 tranche even absorbs $1 of loss. Listed in the table next to the tranche name is a percentage number called the credit support percentage, which refers to the percentage of collateral losses that would need to be sustained before the bond begins to sustain losses.
Despite the 40.9% credit support, the 2A3 bond is still at risk of suffering a principal writedown. First, although the 2A3 bond has 40.9% credit support (assuming all losses occur immediately), principal is allocated between the senior bonds on a pro-rata basis, meaning that the credit support provided by the 2A4, 2A5, and 2A6 tranches is materially reduced if the losses occur over time instead of immediately. Second, given the substantial decline in housing prices since the loans were originated, collateral performance is substantially worse than originally expected.
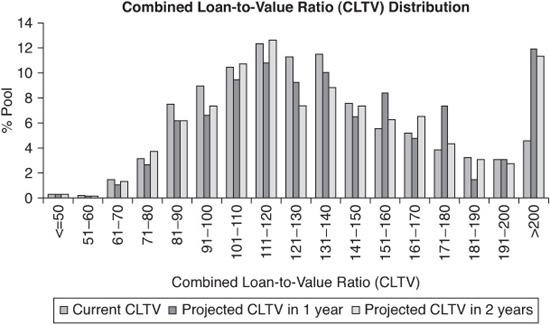
Exhibit 56–2 shows a distribution of mark-to-market combined loan value ratio of each of the loans in the pool. The combined loan-to-value ratio (CLTV) is the sum of all mortgage debt encumbering the property (first lien plus all junior liens) divided by the market value of the property. In addition, to a current distribution of the mark-to-market combined loan to value is included a projection of what the distribution of combined loan-to-value ratios will be one and two years from now. In aggregate, 76% of borrowers currently have negative equity in the property. Given an expectation of declining home prices over the next year, it is expected that 81.2% of borrowers will have negative equity in their property one year from now. In the following year, a modest increase in housing prices is expected, resulting in 80.2% of borrowers expected to have negative equity in their property two years from now.
EXHIBIT 56–2
Sample Bond Combined Loan-to-Value Distribution
The underlying loans in this pool are negative amortization adjustable rate mortgages. Pursuant to the terms of these mortgages, for the first five years, borrowers were permitted to make minimum monthly mortgage payments, which in many cases were not sufficient to even cover the interest that was accruing on the mortgage loans. In the case that the monthly payment was not sufficient to cover the interest accruing on the mortgage loan, the difference was added on to the existing mortgage balance, meaning that the outstanding principal balance increased over time, instead of decreasing. In conjunction with a declining housing market, the fact that mortgage principal balances on these loans were increasing had a substantial negative impact on mortgage credit performance. As a result, 54.6% of borrowers are now two or more payments delinquent on their mortgage.
Exhibit 56–3 provides a few summary data points regarding the collateral performance of the pool. One can note that the weighted average current combined loan-to-value ratio is currently 130%, a significant increase from the 77% combined loan-to-value ratio at the time that the loans were originated. As previously discussed, the main drivers of the increase in combined loan-to-value ratio are the substantial decline in home prices since deal inception and negative amortization on the underlying loans. Other noteworthy data from the table is the very low voluntary prepayment rate (a prepayment rate of 1% corresponds to a rate at which 1% of loans voluntarily prepay a year) and a very low constant default rate (a constant default rate of 1% means that 1% of loans default a year). Note that 54.6% of loans are currently two or more payments delinquent on their mortgage, so it is likely that the constant default rate will have to increase substantially to liquidate this backlog of delinquent loans.
EXHIBIT 56–3
Collateral Recent Performance
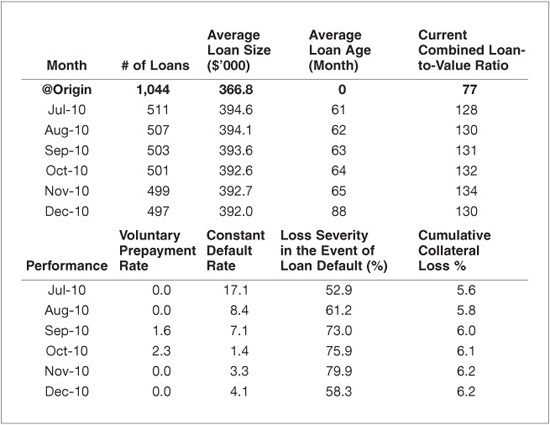
Exhibit 56–4 is an excerpt from what is called a yield table, which shows the yield of the bond in various scenarios (as a function of voluntary prepayment, default and loss severity assumptions), at an assumed purchase price of $62 (per $100 par). In practice, an investor would use a yield table with a much wider range of scenarios (which would then be difficult to display). In addition, yields assuming flat interest rates, and yields assuming that interest rates follow the interest rate forward curve are provided. Note that in the base case (of an assumed 0.5% CPR, 16% CDR, and 68% loss severity for life), 84.8% of remaining loans in the pool default, yet the bonds still provide a yield-to-maturity of 7.66% (when run assuming that interest rates follow the interest rate forward curve). This base case also incorporates a relatively conservative assumption that 7.95% of principal is forgiven due to loan modifications, yet these modifications lead to improved collateral performance. While projected default rates may appear to be high relative to recent experience, one must consider the fact that 54.6% of the loans in the pool have missed two or more payments, and that default rates will have to increase in order to liquidate the backlog of delinquent loans in the pool. One can note (as expected), that bond yields tend to decrease as default rates increase, and the bond yields tend to decrease as loss severity rates increase. Further note that bond yields are significantly higher when the forward interest rates (instead of static interest rates) are assumed.
EXHIBIT 56–4
Sample Bond Yield Table
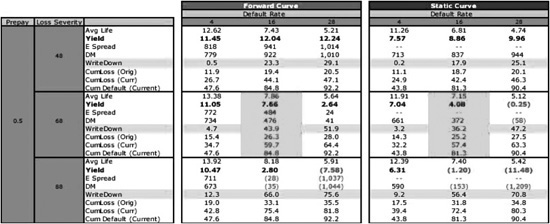
While the yield table is useful in terms of providing a summary of bond yields in various scenarios, one needs to be cognizant of two main limitations. First, the table shows yields in scenarios in which the voluntary prepayments, defaults, and loss severity are constant—in reality it is likely that these factors will vary over time. While it is possible to construct yield tables in which prepayment rates, etc. vary over time, it will likely make the yield table very difficult to understand. Second, as previously discussed, there may be significant dispersion in the characteristics of the underlying loans. Assuming a certain prepayment rate, etc. for the pool as a whole, in essence summarizes the loan characteristics of the pool down to the loan characteristics of the “average” loan. While this may be reasonable in certain cases, it may lead to significant errors in other cases.
KEY POINTS
• An investor in nonagency mortgage-backed securities has two main methods to increase returns—either take economic (credit) risk or take financial (leverage) risk.
• Analysis of nonagency mortgage-backed securities can generally be divided into three main categories: (1) analysis of the underlying mortgage loans; (2) analysis of the servicing, which can impact the cash-flows that are received from the underlying mortgage loans; and (3) analysis of the deal structure whereby the cash-flows from each of the underlying mortgage loans are divided among the various securities.
• Analysis of residential mortgage loans involves a review of various attributes for each of the underlying mortgage loans backing the mortgage-backed security, with the end goal of generating a vector of prepayment, default, loss severity and delinquency rates for each of the mortgage loans in the pool under a variety of scenarios.
• The servicer’s role in the mortgage-backed security is to collect the money from the underlying borrowers. Due to the servicer’s expanded involvement in the resolution of delinquent loans, as the performance of the mortgage pool deteriorates, bond cash-flows (and hence bond valuation) become increasingly sensitive to servicing practices. One must be cognizant of the conflicts of interest between those of a servicer and those of a mortgage-backed securities’ investor when making investment decisions.
• Nonagency mortgage-backed securities are created by aggregating the cash-flows from a pool of mortgage loans into a trust and distributing these cash-flows between various tranches according to predetermined rules. It is extremely important to carefully review deal documents and verify that the modeled cash-flows are consistent with the deal documents before executing trades.