1. The Superinvestors of Graham-and-Doddsville
EDITOR’S NOTE: This article is an edited transcript of a talk given at Columbia University in 1984 commemorating the fiftieth anniversary of Security Analysis, written by Benjamin Graham and David L. Dodd. This specialized volume first introduced the ideas later popularized in The Intelligent Investor. Buffett’s essay offers a fascinating study of how Graham’s disciples have used Graham’s value investing approach to realize phenomenal success in the stock market.
Is the Graham and Dodd “look for values with a significant margin of safety relative to prices” approach to security analysis out of date? Many of the professors who write textbooks today say yes. They argue that the stock market is efficient; that is, that stock prices reflect everything that is known about a company’s prospects and about the state of the economy. There are no undervalued stocks, these theorists argue, because there are smart security analysts who utilize all available information to ensure unfailingly appropriate prices. Investors who seem to beat the market year after year are just lucky. “If prices fully reflect available information, this sort of investment adeptness is ruled out,” writes one of today’s textbook authors.
Well, maybe. But I want to present to you a group of investors who have, year in and year out, beaten the Standard & Poor’s 500 stock index. The hypothesis that they do this by pure chance is at least worth examining. Crucial to this examination is the fact that these winners were all well known to me and pre-identified as superior investors, the most recent identification occurring over fifteen years ago. Absent this condition—that is, if I had just recently searched among thousands of records to select a few names for you this morning—I would advise you to stop reading right here. I should add that all these records have been audited. And I should further add that I have known many of those who have invested with these managers, and the checks received by those participants over the years have matched the stated records.
Before we begin this examination, I would like you to imagine a national coin-flipping contest. Let’s assume we get 225 million Americans up tomorrow morning and we ask them all to wager a dollar. They go out in the morning at sunrise, and they all call the flip of a coin. If they call correctly, they win a dollar from those who called wrong. Each day the losers drop out, and on the subsequent day the stakes build as all previous winnings are put on the line. After ten flips on ten mornings, there will be approximately 220,000 people in the United States who have correctly called ten flips in a row. They each will have won a little over $1,000.
Now this group will probably start getting a little puffed up about this, human nature being what it is. They may try to be modest, but at cocktail parties they will occasionally admit to attractive members of the opposite sex what their technique is, and what marvelous insights they bring to the field of flipping.
Assuming that the winners are getting the appropriate rewards from the losers, in another ten days we will have 215 people who have successfully called their coin flips 20 times in a row and who, by this exercise, each have turned one dollar into a little over $1 million. $225 million would have been lost, $225 million would have been won.
By then, this group will really lose their heads. They will probably write books on “How I Turned a Dollar into a Million in Twenty Days Working Thirty Seconds a Morning.” Worse yet, they’ll probably start jetting around the country attending seminars on efficient coin-flipping and tackling skeptical professors with, “If it can’t be done, why are there 215 of us?”
But then some business school professor will probably be rude enough to bring up the fact that if 225 million orangutans had engaged in a similar exercise, the results would be much the same—215 egotistical orangutans with 20 straight winning flips.
I would argue, however, that there are some important differences in the examples I am going to present. For one thing, if (a) you had taken 225 million orangutans distributed roughly as the U.S. population is; if (b) 215 winners were left after 20 days; and if(c) you found that 40 came from a particular zoo in Omaha, you would be pretty sure you were on to something. So you would probably go out and ask the zookeeper about what he’s feeding them, whether they had special exercises, what books they read, and who knows what else. That is, if you found any really extraordinary concentrations of success, you might want to see if you could identify concentrations of unusual characteristics that might be causal factors.
Scientific inquiry naturally follows such a pattern. If you were trying to analyze possible causes of a rare type of cancer—with, say, 1,500 cases a year in the United States—and you found that 400 of them occurred in some little mining town in Montana, you would get very interested in the water there, or the occupation of those afflicted, or other variables. You know that it’s not random chance that 400 come from a small area. You would not necessarily know the causal factors, but you would know where to search.
I submit to you that there are ways of defining an origin other than geography. In addition to geographical origins, there can be what I call an intellectual origin. I think you will find that a disproportionate number of successful coin-flippers in the investment world came from a very small intellectual village that could be called Graham-and-Doddsville. A concentration of winners that simply cannot be explained by chance can be traced to this particular intellectual village.
Conditions could exist that would make even that concentration unimportant. Perhaps 100 people were simply imitating the coin-flipping call of some terribly persuasive personality. When he called heads, 100 followers automatically called that coin the same way. If the leader was part of the 215 left at the end, the fact that 100 came from the same intellectual origin would mean nothing. You would simply be identifying one case as a hundred cases. Similarly, let’s assume that you lived in a strongly patriarchal society and every family in the United States conveniently consisted of ten members. Further assume that the patriarchal culture was so strong that, when the 225 million people went out the first day, every member of the family identified with the father’s call. Now, at the end of the 20-day period, you would have 215 winners, and you would find that they came from only 21.5 families. Some naive types might say that this indicates an enormous hereditary factor as an explanation of successful coin-flipping. But, of course, it would have no significance at all because it would simply mean that you didn’t have 215 individual winners, but rather 21.5 randomly distributed families who were winners.
In this group of successful investors that I want to consider, there has been a common intellectual patriarch, Ben Graham. But the children who left the house of this intellectual patriarch have called their “flips” in very different ways. They have gone to different places and bought and sold different stocks and companies, yet they have had a combined record that simply can’t be explained by random chance. It certainly cannot be explained by the fact that they are all calling flips identically because a leader is signaling the calls to make. The patriarch has merely set forth the intellectual theory for making coin-calling decisions, but each student has decided on his own manner of applying the theory.
The common intellectual theme of the investors from Graham-and-Doddsville is this: they search for discrepancies between the value of a business and the price of small pieces of that business in the market. Essentially, they exploit those discrepancies without the efficient market theorist’s concern as to whether the stocks are bought on Monday or Thursday, or whether it is January or July, etc. Incidentally, when businessmen buy businesses—which is just what our Graham & Dodd investors are doing through the medium of marketable stocks—I doubt that many are cranking into their purchase decision the day of the week or the month in which the transaction is going to occur. If it doesn’t make any difference whether all of a business is being bought on a Monday or a Friday, I am baffled why academicians invest extensive time and effort to see whether it makes a difference when buying small pieces of those same businesses. Our Graham & Dodd investors, needless to say, do not discuss beta, the capital asset pricing model, or covariance in returns among securities. These are not subjects of any interest to them. In fact, most of them would have difficulty defining those terms. The investors simply focus on two variables: price and value.
I always find it extraordinary that so many studies are made of price and volume behavior, the stuff of chartists. Can you imagine buying an entire business simply because the price of the business had been marked up substantially last week and the week before? Of course, the reason a lot of studies are made of these price and volume variables is that now, in the age of computers, there are almost endless data available about them. It isn’t necessarily because such studies have any utility; it’s simply that the data are there and academicians have worked hard to learn the mathematical skills needed to manipulate them. Once these skills are acquired, it seems sinful not to use them, even if the usage has no utility or negative utility. As a friend said, to a man with a hammer, everything looks like a nail.
I think the group that we have identified by a common intellectual home is worthy of study. Incidentally, despite all the academic studies of the influence of such variables as price, volume, seasonality, capitalization size, etc., upon stock performance, no interest has been evidenced in studying the methods of this unusual concentration of value-oriented winners.
I begin this study of results by going back to a group of four of us who worked at Graham-Newman Corporation from 1954 through 1956. There were only four—I have not selected these names from among thousands. I offered to go to work at Graham-Newman for nothing after I took Ben Graham’s class, but he turned me down as overvalued. He took this value stuff very seriously! After much pestering he finally hired me. There were three partners and four of us at the “peasant” level. All four left between 1955 and 1957 when the firm was wound up, and it’s possible to trace the record of three.
The first example (see Table 1, pages 549–550) is that of Walter Schloss. Walter never went to college, but took a course from Ben Graham at night at the New York Institute of Finance. Walter left Graham-Newman in 1955 and achieved the record shown here over 28 years.
Here is what “Adam Smith”—after I told him about Walter—wrote about him in Supermoney (1972):
He has no connections or access to useful information. Practically no one in Wall Street knows him and he is not fed any ideas. He looks up the numbers in the manuals and sends for the annual reports, and that’s about it.
In introducing me to [Schloss] Warren had also, to my mind, described himself. “He never forgets that he is handling other people’s money and this reinforces his normal strong aversion to loss.” He has total integrity and a realistic picture of himself. Money is real to him and stocks are real—and from this flows an attraction to the “margin of safety” principle.
Walter has diversified enormously, owning well over 100 stocks currently. He knows how to identify securities that sell at considerably less than their value to a private owner. And that’s all he does. He doesn’t worry about whether it’s January, he doesn’t worry about whether it’s Monday, he doesn’t worry about whether it’s an election year. He simply says, if a business is worth a dollar and I can buy it for 40 cents, something good may happen to me. And he does it over and over and over again. He owns many more stocks than I do—and is far less interested in the underlying nature of the business: I don’t seem to have very much influence on Walter. That’s one of his strengths; no one has much influence on him.
The second case is Tom Knapp, who also worked at Graham-Newman with me. Tom was a chemistry major at Princeton before the war; when he came back from the war, he was a beach bum. And then one day he read that Dave Dodd was giving a night course in investments at Columbia. Tom took it on a noncredit basis, and he got so interested in the subject from taking that course that he came up and enrolled at Columbia Business School, where he got the MBA degree. He took Dodd’s course again, and took Ben Graham’s course. Incidentally, 35 years later I called Tom to ascertain some of the facts involved here and I found him on the beach again. The only difference is that now he owns the beach!
In 1968 Tom Knapp and Ed Anderson, also a Graham disciple, along with one or two other fellows of similar persuasion, formed Tweedy, Browne Partners, and their investment results appear in Table 2. Tweedy, Browne built that record with very wide diversification. They occasionally bought control of businesses, but the record of the passive investments is equal to the record of the control investments.
Table 3 describes the third member of the group who formed Buffett Partnership in 1957. The best thing he did was to quit in 1969. Since then, in a sense, Berkshire Hathaway has been a continuation of the partnership in some respects. There is no single index I can give you that I would feel would be a fair test of investment management at Berkshire. But I think that any way you figure it, it has been satisfactory.
Table 4 shows the record of the Sequoia Fund, which is managed by a man whom I met in 1951 in Ben Graham’s class, Bill Ruane. After getting out of Harvard Business School, he went to Wall Street. Then he realized that he needed to get a real business education so he came up to take Ben’s course at Columbia, where we met in early 1951. Bill’s record from 1951 to 1970, working with relatively small sums, was far better than average. When I wound up Buffett Partnership I asked Bill if he would set up a fund to handle all our partners, so he set up the Sequoia Fund. He set it up at a terrible time, just when I was quitting. He went right into the two-tier market and all the difficulties that made for comparative performance for value-oriented investors. I am happy to say that my partners, to an amazing degree, not only stayed with him but added money, with the happy result shown.
There’s no hindsight involved here. Bill was the only person I recommended to my partners, and I said at the time that if he achieved a four-point-per-annum advantage over the Standard & Poor’s, that would be solid performance. Bill has achieved well over that, working with progressively larger sums of money. That makes things much more difficult. Size is the anchor of performance. There is no question about it. It doesn’t mean you can’t do better than average when you get larger, but the margin shrinks. And if you ever get so you’re managing two trillion dollars, and that happens to be the amount of the total equity evaluation in the economy, don’t think that you’ll do better than average!
I should add that in the records we’ve looked at so far, throughout this whole period there was practically no duplication in these portfolios. These are men who select securities based on discrepancies between price and value, but they make their selections very differently. Walter’s largest holdings have been such stalwarts as Hudson Pulp & Paper and Jeddo Highland Coal and New York Trap Rock Company and all those other names that come instantly to mind to even a casual reader of the business pages. Tweedy Browne’s selections have sunk even well below that level in terms of name recognition. On the other hand, Bill has worked with big companies. The overlap among these portfolios has been very, very low. These records do not reflect one guy calling the flip and fifty people yelling out the same thing after him.
Table 5 is the record of a friend of mine who is a Harvard Law graduate, who set up a major law firm. I ran into him in about 1960 and told him that law was fine as a hobby but he could do better. He set up a partnership quite the opposite of Walter’s. His portfolio was concentrated in very few securities and therefore his record was much more volatile but it was based on the same discount-from-value approach. He was willing to accept greater peaks and valleys of performance, and he happens to be a fellow whose whole psyche goes toward concentration, with the results shown. Incidentally, this record belongs to Charlie Munger, my partner for a long time in the operation of Berkshire Hathaway. When he ran his partnership, however, his portfolio holdings were almost completely different from mine and the other fellows mentioned earlier.
Table 6 is the record of a fellow who was a pal of Charlie Munger’s—another non–business school type—who was a math major at USC. He went to work for IBM after graduation and was an IBM salesman for a while. After I got to Charlie, Charlie got to him. This happens to be the record of Rick Guerin. Rick, from 1965 to 1983, against a compounded gain of 316 percent for the S&P, came off with 22,200 percent, which, probably because he lacks a business school education, he regards as statistically significant.
One sidelight here: it is extraordinary to me that the idea of buying dollar bills for 40 cents takes immediately with people or it doesn’t take at all. It’s like an inoculation. If it doesn’t grab a person right away, I find that you can talk to him for years and show him records, and it doesn’t make any difference. They just don’t seem able to grasp the concept, simple as it is. A fellow like Rick Guerin, who had no formal education in business, understands immediately the value approach to investing and he’s applying it five minutes later. I’ve never seen anyone who became a gradual convert over a ten-year period to this approach. It doesn’t seem to be a matter of IQ or academic training. It’s instant recognition, or it is nothing.
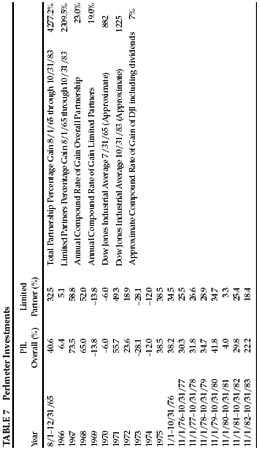
Table 7 is the record of Stan Perlmeter. Stan was a liberal arts major at the University of Michigan who was a partner in the advertising agency of Bozell & Jacobs. We happened to be in the same building in Omaha. In 1965 he figured out I had a better business than he did, so he left advertising. Again, it took five minutes for Stan to embrace the value approach.
Perlmeter does not own what Walter Schloss owns. He does not own what Bill Ruane owns. These are records made independently. But every time Perlmeter buys a stock it’s because he’s getting more for his money than he’s paying. That’s the only thing he’s thinking about. He’s not looking at quarterly earnings projections, he’s not looking at next year’s earnings, he’s not thinking about what day of the week it is, he doesn’t care what investment research from any place says, he’s not interested in price momentum, volume, or anything. He’s simply asking: What is the business worth?
Table 8 and Table 9 are the records of two pension funds I’ve been involved in. They are not selected from dozens of pension funds with which I have had involvement; they are the only two I have influenced. In both cases I have steered them toward value-oriented managers. Very, very few pension funds are managed from a value standpoint. Table 8 is the Washington Post Company’s Pension Fund. It was with a large bank some years ago, and I suggested that they would do well to select managers who had a value orientation.
As you can see, overall they have been in the top percentile ever since they made the change. The Post told the managers to keep at least 25 percent of these funds in bonds, which would not have been necessarily the choice of these managers. So I’ve included the bond performance simply to illustrate that this group has no particular expertise about bonds. They wouldn’t have said they did. Even with this drag of 25 percent of their fund in an area that was not their game, they were in the top percentile of fund management. The Washington Post experience does not cover a terribly long period but it does represent many investment decisions by three managers who were not identified retroactively.
Table 9 is the record of the FMC Corporation fund. I don’t manage a dime of it myself but I did, in 1974, influence their decision to select value-oriented managers. Prior to that time they had selected managers much the same way as most larger companies. They now rank number one in the Becker survey of pension funds for their size over the period of time subsequent to this “conversion” to the value approach. Last year they had eight equity managers of any duration beyond a year. Seven of them had a cumulative record better than the S&P. All eight had a better record last year than the S&P. The net difference now between a median performance and the actual performance of the FMC fund over this period is $243 million. FMC attributes this to the mindset given to them about the selection of managers. Those managers are not the managers I would necessarily select but they have the common denominator of selecting securities based on value.
So these are nine records of “coin-flippers” from Graham-and-Doddsville. I haven’t selected them with hindsight from among thousands. It’s not like I am reciting to you the names of a bunch of lottery winners—people I had never heard of before they won the lottery. I selected these men years ago based upon their framework for investment decision-making. I knew what they had been taught and additionally I had some personal knowledge of their intellect, character, and temperament. It’s very important to understand that this group has assumed far less risk than average; note their record in years when the general market was weak. While they differ greatly in style, these investors are, mentally, always buying the business, not buying the stock. A few of them sometimes buy whole businesses. Far more often they simply buy small pieces of businesses. Their attitude, whether buying all or a tiny piece of a business, is the same. Some of them hold portfolios with dozens of stocks; others concentrate on a handful. But all exploit the difference between the market price of a business and its intrinsic value.
I’m convinced that there is much inefficiency in the market. These Graham-and-Doddsville investors have successfully exploited gaps between price and value. When the price of a stock can be influenced by a “herd” on Wall Street with prices set at the margin by the most emotional person, or the greediest person, or the most depressed person, it is hard to argue that the market always prices rationally. In fact, market prices are frequently nonsensical.
I would like to say one important thing about risk and reward. Sometimes risk and reward are correlated in a positive fashion. If someone were to say to me, “I have here a six-shooter and I have slipped one cartridge into it. Why don’t you just spin it and pull it once? If you survive, I will give you $1 million.” I would decline—perhaps stating that $1 million is not enough. Then he might offer me $5 million to pull the trigger twice—now that would be a positive correlation between risk and reward!
The exact opposite is true with value investing. If you buy a dollar bill for 60 cents, it’s riskier than if you buy a dollar bill for 40 cents, but the expectation of reward is greater in the latter case. The greater the potential for reward in the value portfolio, the less risk there is.
One quick example: The Washington Post Company in 1973 was selling for $80 million in the market. At the time, that day, you could have sold the assets to any one of ten buyers for not less than $400 million, probably appreciably more. The company owned the Post, Newsweek, plus several television stations in major markets. Those same properties are worth $2 billion now, so the person who would have paid $400 million would not have been crazy.
Now, if the stock had declined even further to a price that made the valuation $40 million instead of $80 million, its beta would have been greater. And to people who think beta measures risk, the cheaper price would have made it look riskier. This is truly Alice in Wonderland. I have never been able to figure out why it’s riskier to buy $400 million worth of properties for $40 million than $80 million. And, as a matter of fact, if you buy a group of such securities and you know anything at all about business valuation, there is essentially no risk in buying $400 million for $80 million, particularly if you do it by buying ten $40 million piles for $8 million each. Since you don’t have your hands on the $400 million, you want to be sure you are in with honest and reasonably competent people, but that’s not a difficult job.
You also have to have the knowledge to enable you to make a very general estimate about the value of the underlying businesses. But you do not cut it close. That is what Ben Graham meant by having a margin of safety. You don’t try and buy businesses worth $83 million for $80 million. You leave yourself an enormous margin. When you build a bridge, you insist it can carry 30,000 pounds, but you only drive 10,000-pound trucks across it. And that same principle works in investing.
In conclusion, some of the more commercially minded among you may wonder why I am writing this article. Adding many converts to the value approach will perforce narrow the spreads between price and value. I can only tell you that the secret has been out for 50 years, ever since Ben Graham and Dave Dodd wrote Security Analysis, yet I have seen no trend toward value investing in the 35 years that I’ve practiced it. There seems to be some perverse human characteristic that likes to make easy things difficult. The academic world, if anything, has actually backed away from the teaching of value investing over the last 30 years. It’s likely to continue that way. Ships will sail around the world but the Flat Earth Society will flourish. There will continue to be wide discrepancies between price and value in the marketplace, and those who read their Graham & Dodd will continue to prosper.
Tables 1–9 follow:

TABLE 2 Tweedy, Browne Inc.
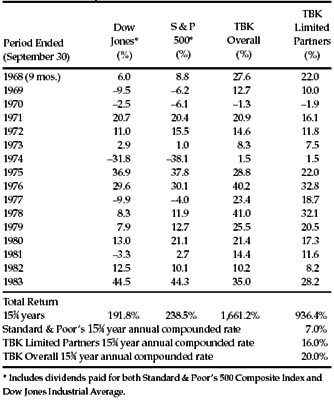
TABLE 3 Buffett Partnership, Ltd
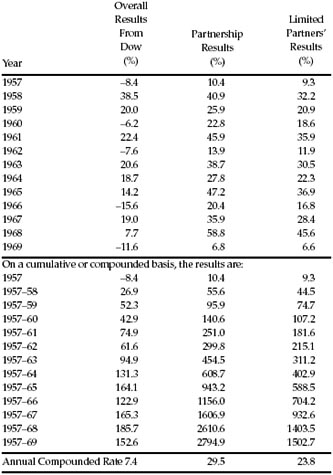
TABLE 4 Sequoia Fund, Inc.
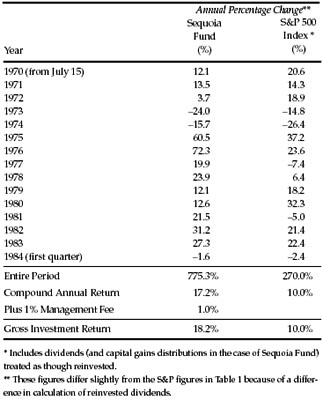
TABLE 5 Charles Munger
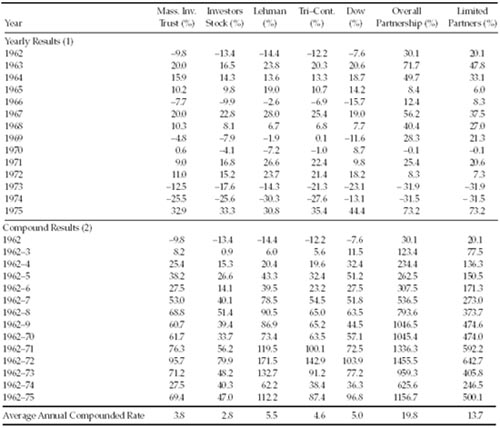
TABLE 6 Pacific Partners, Ltd.


2. Important Rules Concerning Taxability of Investment Income and Security Transactions (in 1972)
Editor’s note: Due to extensive changes in the rules governing such transactions, the following document is presented here for historical purposes only. When first written by Benjamin Graham in 1972, all the information therein was correct. However, intervening developments have rendered this document inaccurate for today’s purposes. Following Graham’s original Appendix 2 is a revised and updated version of “The Basics of Investment Taxation,” which brings the reader up-to-date on the relevant rules.
Rule 1—Interest and Dividends
Interest and dividends are taxable as ordinary income except (a) income received from state, municipal, and similar obligations, which are free from Federal tax but may be subject to state tax, (b) dividends representing a return of capital, (c) certain dividends paid by investment companies (see below), and (d) the first $100 of ordinary domestic-corporation dividends.
Rule 2—Capital Gains and Losses
Short-term capital gains and losses are merged to obtain net short-term capital gain or loss. Long-term capital gains and losses are merged to obtain the net long-term capital gain or loss. If the net short-term capital gain exceeds the net long-term capital loss, 100 per cent of such excess shall be included in income. The maximum tax thereon is 25% up to $50,000 of such gains and 35% on the balance.
A net capital loss (the amount exceeding capital gains) is deductible from ordinary income to a maximum of $1,000 in the current year and in each of the next five years. Alternatively, unused losses may be applied at any time to offset capital gains. (Carry-overs of losses taken before 1970 are treated more liberally than later losses.)
Note Concerning “Regulated Investment Companies”
Most investment funds (“investment companies”) take advantage of special provisions of the tax law, which enable them to be taxed substantially as partnerships. Thus if they make long-term security profits they can distribute these as “capital-gain dividends,” which are reported by their shareholders in the same way as long-term gains. These carry a lower tax rate than ordinary dividends. Alternatively, such a company may elect to pay the 25% tax for the account of its shareholders and then retain the balance of the capital gains without distributing them as capital-gain dividends.
3. The Basics of Investment Taxation (Updated as of 2003)
Interest and Dividends
Interest and dividends are taxed at your ordinary-income tax rate except (a) interest received from municipal bonds, which is free from Federal income tax but may be subject to state tax, (b) dividends representing a return of capital, and (c) long-term capital-gain distributions paid by mutual funds (see below). Private-activity municipal bonds, even within a mutual fund, may subject you to the Federal alternative minimum tax.
Capital Gains and Losses
Short-term capital gains and losses are merged to obtain net short-term capital gain or loss. Long-term capital gains and losses are merged to determine your net long-term capital gain or loss. If your net short-term capital gain exceeds the net long-term capital loss, that excess is counted as ordinary income. If there is a net long-term capital gain, it is taxed at the favorable capital gains rate, generally 20%—which will fall to 18% for investments purchased after December 31, 2000, and held for more than five years.
A net capital loss is deductible from ordinary income to a maximum of $3,000 in the current year. Any capital losses in excess of $3,000 may be applied in later tax years to offset future capital gains.
Mutual Funds
As “regulated investment companies,” nearly all mutual funds take advantage of special provisions of the tax law that exempt them from corporate income tax. After selling long-term holdings, mutual funds can distribute the profits as “capital-gain dividends,” which their shareholders treat as long-term gains. These are taxed at a lower rate (generally 20%) than ordinary dividends (up to 39%). You should generally avoid making large new investments during the fourth quarter of each year, when these capital-gain distributions are usually distributed; otherwise you will incur tax for a gain earned by the fund before you even owned it.
4. The New Speculation in Common Stocks1
What I shall have to say will reflect the spending of many years in Wall Street, with their attendant varieties of experience. This has included the recurrent advent of new conditions, or a new atmosphere, which challenge the value of experience itself. It is true that one of the elements that distinguish economics, finance, and security analysis from other practical disciplines is the uncertain validity of past phenomena as a guide to the present and future. Yet we have no right to reject the lessons of the past until we have at least studied and understood them. My address today is an effort toward such understanding in a limited field—in particular, an endeavor to point out some contrasting relationships between the present and the past in our underlying attitudes toward investment and speculation in common stocks.
Let me start with a summary of my thesis. In the past the speculative elements of a common stock resided almost exclusively in the company itself; they were due to uncertainties, or fluctuating elements, or downright weaknesses in the industry, or the corporation’s individual setup. These elements of speculation still exist, of course; but it may be said that they have been sensibly diminished by a number of long-term developments to which I shall refer. But in revenge a new and major element of speculation has been introduced into the common-stock arena from outside the companies. It comes from the attitude and viewpoint of the stock-buying public and their advisers—chiefly us security analysts. This attitude may be described in a phrase: primary emphasis upon future expectations.
Nothing will appear more logical and natural to this audience than the idea that a common stock should be valued and priced primarily on the basis of the company’s expected future performance. Yet this simple-appearing concept carries with it a number of paradoxes and pitfalls. For one thing, it obliterates a good part of the older, well-established distinctions between investment and speculation. The dictionary says that “speculate” comes from the Latin “specula,” a lookout. Thus it was the speculator who looked out and saw future developments coming before other people did. But today, if the investor is shrewd or well advised, he too must have his lookout on the future, or rather he mounts into a common lookout where he rubs elbows with the speculator.
Secondly, we find that, for the most part, companies with the best investment characteristics—i.e., the best credit rating—are the ones which are likely to attract the largest speculative interest in their common stocks, since everyone assumes they are guaranteed a brilliant future. Thirdly, the concept of future prospects, and particularly of continued growth in the future, invites the application of formulas out of higher mathematics to establish the present value of the favored issues. But the combination of precise formulas with highly imprecise assumptions can be used to establish, or rather to justify, practically any value one wishes, however high, for a really outstanding issue. But, paradoxically, that very fact on close examination will be seen to imply that no one value, or reasonably narrow range of values, can be counted on to establish and maintain itself for a given growth company; hence at times the market may conceivably value the growth component at a strikingly low figure.
Returning to my distinction between the older and newer speculative elements in common stock, we might characterize them by two outlandish but convenient words, viz.: endogenous and exogenous. Let me illustrate briefly the old-time speculative common stock, as distinguished from an investment stock, by some data relating to American Can and Pennsylvania Railroad in 1911–1913. (These appear in Benjamin Graham and David L. Dodd, Security Analysis, McGraw-Hill, 1940, pp. 2–3.)
In those three years the price range of “Pennsy” moved only between 53 and 65, or between 12.2 and 15 times its average earnings for the period. It showed steady profits, was paying a reliable $3 dividend, and investors were sure that it was backed by wellover its par of $50 in tangible assets. By contrast, the price of American Can ranged between 9 and 47; its earnings between 7 cents and $8.86; the ratio of price to the three-year average earnings moved between 1.9 times and 10 times; it paid no dividend at all; and sophisticated investors were well aware that the $100 par value of the common represented nothing but undisclosed “water,” since the preferred issue exceeded the tangible assets available for it. Thus American Can common was a representative speculative issue, because American Can Company was then a speculatively capitalized enterprise in a fluctuating and uncertain industry. Actually, American Can had a far more brilliant long-term future than Pennsylvania Railroad; but not only was this fact not suspected by investors or speculators in those days, but even if it had been it would probably have been put aside by the investors as basically irrelevant to investment policies and programs in the years 1911–1913.
Now, to expose you to the development through time of the importance of long-term prospects for investments. I should like to use as my example our most spectacular giant industrial enterprise—none other than International Business Machines, which last year entered the small group of companies with $1 billion of sales. May I introduce one or two autobiographical notes here, in order to inject a little of the personal touch into what otherwise would be an excursion into cold figures? In 1912 I had left college for a term to take charge of a research project for U.S. Express Company. We set out to find the effect on revenues of a proposed revolutionary new system of computing express rates. For this purpose we used the so-called Hollerith machines, leased out by the then Computing-Tabulating-Recording Company. They comprised card punches, card sorters, and tabulators—tools almost unknown to businessmen, then, and having their chief application in the Census Bureau. I entered Wall Street in 1914, and the next year the bonds and common stock of C.-T.-R. Company were listed on the New York Stock Exchange. Well, I had a kind of sentimental interest in that enterprise, and besides I considered myself a sort of technological expert on their products, being one of the few financial people who had seen and used them. So early in 1916 I went to the head of my firm, known as Mr. A. N., and pointed out to him that C.-T.-R. stock was selling in the middle 40s (for 105,000 shares); that it had earned $6.50 in 1915; that its book value— including, to be sure, some nonsegregated intangibles—was $130; that it had started a $3 dividend; and that I thought rather highly of the company’s products and prospects. Mr. A. N. looked at me pityingly. “Ben,” said he, “do not mention that company to me again. I would not touch it with a ten-foot pole. [His favorite expression.] Its 6 per cent bonds are selling in the low 80s and they are no good. So how can the stock be any good? Everybody knows there is nothing behind it but water.” (Glossary: In those days that was the ultimate of condemnation. It meant that the asset account of the balance sheet was fictitious. Many industrial companies—notably U.S. Steel—despite their $100 par, represented nothing but water, concealed in a written-up plant account. Since they had “nothing” to back them but earning power and future prospects, no self-respecting investor would give them a second thought.)
I returned to my statistician’s cubbyhole, a chastened young man. Mr. A. N. was not only experienced and successful, but extremely shrewd as well. So much was I impressed by his sweeping condemnation of Computing-Tabulating-Recording that I never bought a share of it in my life, not even after its name was changed to International Business Machines in 1926.
Now let us take a look at the same company with its new name in 1926, a year of pretty high stock markets. At that time it first revealed the good-will item in its balance sheet, in the rather large sum of $13.6 million. A. N. had been right. Practically every dollar of the so-called equity behind the common in 1915 had been nothing but water. However, since that time the company had made an impressive record under the direction of T. L. Watson, Sr. Its net had risen from $691,000 to $3.7 million—over fivefold—a greater percentage gain than it was to make in any subsequent eleven-year period. It had built up a nice tangible equity for the common, and had split it 3.6 for one. It had established a $3 dividend rate for the new stock, while earnings were $6.39 thereon. You might have expected the 1926 stock market to have been pretty enthusiastic about a company with such a growth history and so strong a trade position. Let us see. The price range for that year was 31 low, 59 high. At the average of 45 it was selling at the same 7-times multiplier of earnings and the same 6.7 per cent dividend yield as it had done in 1915. At its low of 31 it was not far in excess of its tangible book value, and in that respect was far more conservatively priced than eleven years earlier.
These data illustrate, as well as any can, the persistence of the old-time investment viewpoint until the culminating years of the bull market of the 1920s. What has happened since then can be summarized by using ten-year intervals in the history of IBM. In 1936 net expanded to twice the 1926 figures, and the average multiplier rose from 7 to 17½. From 1936 to 1946 the gain was 2½ times, but the average multiplier in 1946 remained at 17½. Then the pace accelerated. The 1956 net was nearly 4 times that of 1946, and the average multiplier rose to 32½. Last year, with a further gain in net, the multiplier rose again to an average of 42, if we do not count the unconsolidated equity in the foreign subsidiary.
When we examine these recent price figures with care we see some interesting analogies and contrasts with those of forty years earlier. The one-time scandalous water, so prevalent in the balance sheets of industrial companies, has all been squeezed out—first by disclosure and then by writeoffs. But a different kind of water has been put back into the valuation by the stock market—by investors and speculators themselves. When IBM now sells at 7 times its book value, instead of 7 times earnings, the effect is practically the same as if it had no book value at all. Or the small book-value portion can be considered as a sort of minor preferred-stock component of the price, the rest representing exactly the same sort of commitment as the old-time speculator made when he bought Woolworth or U.S. Steel common entirely for their earning power and future prospects.
It is worth remarking, in passing, that in the thirty years which saw IBM transformed from a 7-times earnings to a 40-times earnings enterprise, many of what I have called the endogenous speculative aspects of our large industrial companies have tended to disappear, or at least to diminish greatly. Their financial positions are firm, their capital structures conservative: they are managed far more expertly, and even more honestly, than before. Furthermore, the requirements of complete disclosure have removed one of the important speculative elements of years ago—that derived from ignorance and mystery.
Another personal digression here. In my early years in the Street one of the favorite mystery stocks was Consolidated Gas of New York, now Consolidated Edison. It owned as a subsidiary the profitable New York Edison Company, but it reported only dividends received from this source, not its full earnings. The unreported Edison earnings supplied the mystery and the “hidden value.” To my surprise I discovered that these hush-hush figures were actually on file each year with the Public Service Commission of the state. It was a simple matter to consult the records and to present the true earnings of Consolidated Gas in a magazine article. (Incidentally, the addition to profits was not spectacular.) One of my older friends said to me then: “Ben, you may think you are a great guy to supply those missing figures, but Wall Street is going to thank you for nothing. Consolidated Gas with the mystery is both more interesting and more valuable than ex-mystery. You youngsters who want to stick your noses into everything are going to ruin Wall Street.”
It is true that the three M’s which then supplied so much fuel to the speculative fires have now all but disappeared. These were Mystery, Manipulation, and (thin) Margins. But we security analysts have ourselves been creating valuation approaches which are so speculative in themselves as to pretty well take the place of those older speculative factors. Do we not have our own “3M’s” now—none other than Minnesota Mining and Manufacturing Company—and does not this common stock illustrate perfectly the new speculation as contrasted with the old? Consider a few figures. When M. M. & M. common sold at 101 last year the market was valuing it at 44 times 1956 earnings, which happened to show no increase to speak of in 1957. The enterprise itself was valued at $1.7 billion, of which $200 million was covered by net assets, and a cool $1½ billion represented the market’s appraisal of “good will.” We do not know the process of calculation by which that valuation of good will was arrived at; we do know that a few months later the market revised this appraisal downward by some $450 million, or about 30 per cent. Obviously it is impossible to calculate accurately the intangible component of a splendid company such as this. It follows as a kind of mathematical law that the more important the good will or future earning-power factor the more uncertain becomes the true value of the enterprise, and therefore the more speculative inherently the common stock.
It may be well to recognize a vital difference that has developed in the valuation of these intangible factors, when we compare earlier times with today. A generation or more ago it was the standard rule, recognized both in average stock prices and in formal or legal valuations, that intangibles were to be appraised on a more conservative basis than tangibles. A good industrial company might be required to earn between 6 per cent and 8 per cent on its tangible assets, represented typically by bonds and preferred stock; but its excess earnings, or the intangible assets they gave rise to, would be valued on, say, a 15 per cent basis. (You will find approximately these ratios in the initial offering of Woolworth preferred and common stock in 1911, and in numerous others.) But what has happened since the 1920s? Essentially the exact reverse of these relationships may now be seen. A company must now typically earn about 10 per cent on its common equity to have it sell in the average market at full book value. But its excess earnings, above 10 per cent on capital, are usually valued more liberally, or at a higher multiplier, than the base earnings required to support the book value in the market. Thus a company earning 15 per cent on the equity may well sell at 13½ times earnings, or twice its net assets. This would mean that the first 10 per cent earned on capital is valued at only 10 times, but the next 5 per cent—what used to be called the “excess”—is actually valued at 20 times.
Now there is a logical reason for this reversal in valuation procedure, which is related to the newer emphasis on growth expectations. Companies that earn a high return on capital are given these liberal appraisals not only because of the good profitability itself, and the relative stability associated with it, but perhaps even more cogently because high earnings on capital generally go hand in hand with a good growth record and prospects. Thus what is really paid for nowadays in the case of highly profitable companies is not the good will in the old and restricted sense of an established name and a profitable business, but rather their assumed superior expectations of increased profits in the future.
This brings me to one or two additional mathematical aspects of the new attitude toward common-stock valuations, which I shall touch on merely in the form of brief suggestions. If, as many tests show, the earnings multiplier tends to increase with profitability—i.e., as the rate of return on book value increases—then the arithmetical consequence of this feature is that value tends to increase directly as the square of the earnings, but inversely the book value. Thus in an important and very real sense tangible assets have become a drag on average market value rather than a source thereof. Take a far from extreme illustration. If Company A earns $4 a share on a $20 book value, and Company B also $4 a share on $100 book value, Company A is almost certain to sell at a higher multiplier, and hence at higher price than Company B—say $60 for Company A shares and $35 for Company B shares. Thus it would not be inexact to declare that the $80 per share of greater assets for Company B are responsible for the $25 per share lower market price, since the earnings per share are assumed to be equal.
But more important than the foregoing is the general relationship between mathematics and the new approach to stock values. Given the three ingredients of (a) optimistic assumptions as to the rate of earnings growth, (b) a sufficiently long projection of this growth into the future, and (c) the miraculous workings of compound interest—lo! the security analyst is supplied with a new kind of philosopher’s stone which can produce or justify any desired valuation for a really “good stock.” I have commented in a recent article in the Analysts’ Journal on the vogue of higher mathematics in bull markets, and quoted David Durand’s exposition of the striking analogy between value calculations of growth stocks and the famous Petersburg Paradox, which has challenged and confused mathematicians for more than two hundred years. The point I want to make here is that there is a special paradox in the relationship between mathematics and investment attitudes on common stocks, which is this: Mathematics is ordinarily considered as producing precise and dependable results; but in the stock market the more elaborate and abstruse the mathematics the more uncertain and speculative are the conclusions we draw therefrom. In forty-four years of Wall Street experience and study I have never seen dependable calculations made about common-stock values, or related investment policies, that went beyond simple arithmetic or the most elementary algebra. Whenever calculus is brought in, or higher algebra, you could take it as a warning signal that the operator was trying to substitute theory for experience, and usually also to give to speculation the deceptive guise of investment.
The older ideas of common-stock investment may seem quite naïve to the sophisticated security analyst of today. The great emphasis was always on what we now call the defensive aspects of the company or issue—mainly the assurance that it would continue its dividend unreduced in bad times. Thus the strong railroads, which constituted the standard investment commons of fifty years ago, were actually regarded in very much the same way as the public-utility commons in recent years. If the past record indicated stability, the chief requirement was met; not too much effort was made to anticipate adverse changes of an underlying character in the future. But, conversely, especially favorable future prospects were regarded by shrewd investors as something to look for but not to pay for.
In effect this meant that the investor did not have to pay anything substantial for superior long-term prospects. He got these, virtually without extra cost, as a reward for his own superior intelligence and judgment in picking the best rather than the merely good companies. For common stocks with the same financial strength, past earnings record, and dividend stability all sold at about the same dividend yield.
This was indeed a shortsighted point of view, but it had the great advantage of making common-stock investment in the old days not only simple but also basically sound and highly profitable. Let me return for the last time to a personal note. Somewhere around 1920 our firm distributed a series of little pamphlets entitled Lessons for Investors. Of course it took a brash analyst in his middle twenties like myself to hit on so smug and presumptuous a title. But in one of the papers I made the casual statement that “if a common stock is a good investment it is also a good speculation.” For, reasoned I, if a common stock was so sound that it carried very little risk of loss it must ordinarily be so good as to possess excellent chances for future gains. Now this was a perfectly true and even valuable discovery, but it was true only because nobody paid any attention to it. Some years later, when the public woke up to the historical merits of common stocks as long-term investments, they soon ceased to have any such merit, because the public’s enthusiasm created price levels which deprived them of their builtin margin of safety, and thus drove them out of the investment class. Then, of course, the pendulum swung to the other extreme, and we soon saw one of the most respected authorities declaring (in 1931) that no common stock could ever be an investment.
When we view this long-range experience in perspective we find another set of paradoxes in the investor’s changing attitude toward capital gains as contrasted with income. It seems a truism to say that the old-time common-stock investor was not much interested in capital gains. He bought almost entirely for safety and income, and let the speculator concern himself with price appreciation. Today we are likely to say that the more experienced and shrewd the investor, the less attention he pays to dividend returns, and the more heavily his interest centers on long-term appreciation. Yet one might argue, perversely, that precisely because the old-time investor did not concentrate on future capital appreciation he was virtually guaranteeing to himself that he would have it, at least in the field of industrial stocks. And, conversely, today’s investor is so concerned with anticipating the future that he is already paying handsomely for it in advance. Thus what he has projected with so much study and care may actually happen and still not bring him any profit. If it should fail to materialize to the degree expected he may in fact be faced with a serious temporary and perhaps even permanent loss.
What lessons—again using the pretentious title of my 1920 pamphlet—can the analyst of 1958 learn from this linking of past with current attitudes? Not much of value, one is inclined to say. We can look back nostalgically to the good old days when we paid only for the present and could get the future for nothing—an “all this and Heaven too” combination. Shaking our heads sadly we mutter, “Those days are gone forever.” Have not investors and security analysts eaten of the tree of knowledge of good and evil prospects? By so doing have they not permanently expelled themselves from that Eden where promising common stocks at reasonable prices could be plucked off the bushes? Are we doomed always to run the risk either of paying unreasonably high prices for good quality and prospects, or of getting poor quality and prospects when we pay what seems a reasonable price?
It certainly looks that way. Yet one cannot be sure even of that pessimistic dilemma. Recently, I did a little research in the long-term history of that towering enterprise, General Electric—stimulated by the arresting chart of fifty-nine years of earnings and dividends appearing in their recently published 1957 Report. These figures are not without their surprises for the knowledgeable analyst. For one thing they show that prior to 1947 the growth of G. E. was fairly modest and quite irregular. The 1946 earnings, per share adjusted, were only 30 per cent higher than in 1902—52 cents versus 40 cents—and in no year of this period were the 1902 earnings as much as doubled. Yet the price-earnings ratio rose from 9 times in 1910 and 1916 to 29 times in 1936 and again in 1946. One might say, of course, that the 1946 multiplier at least showed the well-known prescience of shrewd investors. We analysts were able to foresee then the really brilliant period of growth that was looming ahead in the next decade. Maybe so. But some of you remember that the next year, 1947, which established an impressive new high for G.E.’s per-share earnings, was marked also by an extraordinary fall in the price-earnings ratio. At its low of 32 (before the 3-for-1 split) G.E. actually sold again at only 9 times its current earnings and its average price for the year was only about 10 times earnings. Our crystal ball certainly clouded over in the short space of twelve months.
This striking reversal took place only eleven years ago. It casts some little doubt in my mind as to the complete dependability of the popular belief among analysts that prominent and promising companies will now always sell at high price-earnings ratios—that this is a fundamental fact of life for investors and they may as well accept and like it. I have no desire at all to be dogmatic on this point. All I can say is that it is not settled in my mind, and each of you must seek to settle it for yourself.
But in my concluding remarks I can say something definite about the structure of the market for various types of common stocks, in terms of their investment and speculative characteristics. In the old days the investment character of a common stock was more or less the same as, or proportionate with, that of the enterprise itself, as measured quite well by its credit rating. The lower the yield on its bonds or preferred, the more likely was the common to meet all the criteria for a satisfactory investment, and the smaller the element of speculation involved in its purchase. This relationship, between the speculative ranking of the common and the investment rating of the company, could be graphically expressed pretty much as a straight line descending from left to right. But nowadays I would describe the graph as U-shaped. At the left, where the company itself is speculative and its credit low, the common stock is of course highly speculative, just as it has always been in the past. At the right extremity, however, where the company has the highest credit rating because both its past record and future prospects are most impressive, we find that the stock market tends more or less continuously to introduce a highly speculative element into the common shares through the simple means of a price so high as to carry a fair degree of risk.
At this point I cannot forbear introducing a surprisingly relevant, if quite exaggerated, quotation on the subject which I found recently in one of Shakespeare’s sonnets. It reads:
Have I not seen dwellers on form and favor
Lose all and more by paying too much rent?
Returning to my imaginary graph, it would be the center area where the speculative element in common-stock purchases would tend to reach its minimum. In this area we could find many well-established and strong companies, with a record of past growth corresponding to that of the national economy and with future prospects apparently of the same character. Such common stocks could be bought at most times, except in the upper ranges of a bull market, at moderate prices in relation to their indicated intrinsic values. As a matter of fact, because of the present tendency of investors and speculators alike to concentrate on more glamorous issues, I should hazard the statement that these middle-ground stocks tend to sell on the whole rather below their independently determinable values. They thus have a margin-of-safety factor supplied by the same market preferences and prejudices which tend to destroy the margin of safety in the more promising issues. Furthermore, in this wide array of companies there is plenty of room for penetrating analysis of the past record and for discriminating choice in the area of future prospects, to which can be added the higher assurance of safety conferred by diversification.
When Phaëthon insisted on driving the chariot of the Sun, his father, the experienced operator, gave the neophyte some advice which the latter failed to follow—to his cost. Ovid summed up Phoebus Apollo’s counsel in three words:
Medius tutissimus ibis
You will go safest in the middle course
I think this principle holds good for investors and their security analyst advisers.
5. A Case History: Aetna Maintenance Co.
The first part of this history is reproduced from our 1965 edition, where it appeared under the title “A Horrible Example.” The second part summarizes the later metamorphosis of the enterprise.
We think it might have a salutary effect on our readers’ future attitude toward new common-stock offerings if we cited one “horrible example” here in some detail. It is taken from the first page of Standard & Poor’s Stock Guide, and illustrates in extreme fashion the glaring weaknesses of the 1960–1962 flotations, the extraordinary overvaluations given them in the market, and the subsequent collapse.
In November 1961, 154,000 shares of Aetna Maintenance Co. common were sold to public at $9 and the price promptly advanced to $15. Before the financing the net assets per share were about $1.20, but they were increased to slightly over $3 per share by the money received for the new shares.
The sales and earnings prior to the financing were:

The corresponding figures after the financing were:
| June 1963 | $4,681,000 | $42,000 (def.) | $0.11 (def.) | ||
| June 1962 | 4,234,000 | 149,000 | 0.36 |
In 1962 the price fell to 2 2/3, and in 1964 it sold as low as 7/8. No dividends were paid during this period.
COMMENT: This was much too small a business for public participation. The stock was sold—and bought—on the basis of one good year; the results previously had been derisory. There was nothing in the nature of this highly competitive business to insure future stability. At the high price soon after issuance the heedless public was paying much more per dollar of earnings and assets than for most of our large and strong companies. This example is admittedly extreme, but it is far from unique; the instances of lesser, but inexcusable, overvaluations run into the hundreds.
Sequel 1965–1970
In 1965 new interests came into the company. The unprofitable building-maintenance business was sold out, and the company embarked in an entirely different venture: making electronic devices. The name was changed to Haydon Switch and Instrument Co. The earnings results have not been impressive. In the five years 1965–1969 the enterprise showed average earnings of only 8 cents per share of “old stock,” with 34 cents earned in the best year, 1967. However, in true modern style, the company split the stock 2 for 1 in 1968. The market price also ran true to Wall Street form. It advanced from 7/8 in 1964 to the equivalent of 16½ in 1968 (after the split). The price now exceeded the record set in the enthusiastic days of 1961. This time the overvaluation was much worse than before. The stock was now selling at 52 times the earnings of its only good year, and some 200 times its average earnings. Also, the company was again to report a deficit in the very year that the new high price was established. The next year, 1969, the bid price fell to $1.
QUESTIONS: Did the idiots who paid $8+ for this stock in 1968 know anything at all about the company’s previous history, its five-year earnings record, its asset value (very small)? Did they have any idea of how much—or rather how little—they were getting for their money? Did they care? Has anyone on Wall Street any responsibility at all for the regular recurrence of completely brainless, shockingly widespread, and inevitable catastrophic speculation in this kind of vehicle?
6. Tax Accounting for NVF’s Acquisition of Sharon Steel Shares
1. NVF acquired 88% of Sharon stock in 1969, paying for each share $70 in NVF 5% bonds, due 1994, and warrants to buy 1½ shares of NVF at $22 per share. The initial market value of the bonds appears to have been only 43% of par, while the warrants were quoted at $10 per NVF share involved. This meant that the Sharon holders got only $30 worth of bonds but $15 worth of warrants for each share turned in, a total of $45 per share. (This was about the average price of Sharon in 1968, and also its closing price for the year.) The book value of Sharon was $60 per share. The difference between this book value and the market value of Sharon stock amounted to about $21 million on the 1,415,000 shares of Sharon acquired.
2. The accounting treatment was designed to accomplish three things: (a) To treat the issuance of the bonds as equivalent to a “sale” thereof at 43, giving the company an annual deduction from income for amortization of the huge bond discount of $54 million. (Actually it would be charging itself about 15% annual interest on the “proceeds” of the $99 million debenture issue.) (b) To offset this bond-discount charge by an approximately equal “profit,” consisting of a credit to income of one-tenth of the difference between the cost price of 45 for the Sharon stock and its book value of 60. (This would correspond, in reverse fashion, to the required practice of charging income each year with a part of the price paid for acquisitions in excess of the book value of the assets acquired.) (c) The beauty of this arrangement would be that the company could save initially about $900,000 a year, or $1 per share, in income taxes from these two annual entries, because the amortization of bond discount could be deducted from taxable income but the amortization of “excess of equity over cost” did not have to be included in taxable income.
3. This accounting treatment is reflected in both the consolidated income account and the consolidated balance sheet of NVF for 1969, and pro forma for 1968. Since a good part of the cost of Sharon stock was to be treated as paid for by warrants, it was necessary to show the initial market value of the warrants as part of the common-stock capital figure. Thus in this case, as in no other that we know, the warrants were assigned a substantial value in the balance sheet, namely $22 million+ (but only in an explanatory note).
7. Technological Companies as Investments
In the Standard & Poor’s services in mid-1971 there were listed about 200 companies with names beginning with Compu-, Data, Electro-, Scien-, Techno-. About half of these belonged to some part of the computer industry. All of them were traded in the market or had made applications to sell stock to the public.
A total of 46 such companies appeared in the S & P Stock Guide for September 1971. Of these, 26 were reporting deficits, only six were earning over $1 per share, and only five were paying dividends.
In the December 1968 Stock Guide there had appeared 45 companies with similar technological names. Tracing the sequel of this list, as shown in the September 1971 Guide, we find the following developments:
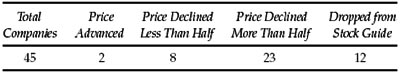
COMMENT: It is virtually certain that the many technological companies not included in the Guide in 1968 had a poorer subsequent record than those that were included; also that the 12 companies dropped from the list did worse than those that were retained. The harrowing results shown by these samples are no doubt reasonably indicative of the quality and price history of the entire group of “technology” issues. The phenomenal success of IBM and a few other companies was bound to produce a spate of public offerings of new issues in their fields, for which large losses were virtually guaranteed.