It is time to turn to some broader applications of the techniques of security analysis. Since we have already described in general terms the investment policies recommended for our two categories of investors,* it would be logical for us now to indicate how security analysis comes into play in order to implement these policies. The defensive investor who follows our suggestions will purchase only high-grade bonds plus a diversified list of leading common stocks. He is to make sure that the price at which he bought the latter is not unduly high as judged by applicable standards.
In setting up this diversified list he has a choice of two approaches, the DJIA-type of portfolio and the quantitatively-tested portfolio. In the first he acquires a true cross-section sample of the leading issues, which will include both some favored growth companies, whose shares sell at especially high multipliers, and also less popular and less expensive enterprises. This could be done, most simply perhaps, by buying the same amounts of all thirty of the issues in the DowJones Industrial Average (DJIA). Ten shares of each, at the 900 level for the average, would cost an aggregate of about $16,000.1 On the basis of the past record he might expect approximately the same future results by buying shares of several representative investment funds.†
His second choice would be to apply a set of standards to each purchase, to make sure that he obtains (1) a minimum of quality in the past performance and current financial position of the company, and also (2) a minimum of quantity in terms of earnings and assets per dollar of price. At the close of the previous chapter we listed seven such quality and quantity criteria suggested for the selection of specific common stocks. Let us describe them in order.
1. Adequate Size of the Enterprise
All our minimum figures must be arbitrary and especially in the matter of size required. Our idea is to exclude small companies which may be subject to more than average vicissitudes especially in the industrial field. (There are often good possibilities in such enterprises but we do not consider them suited to the needs of the defensive investor.) Let us use round amounts: not less than $100 million of annual sales for an industrial company and, not less than $50 million of total assets for a public utility.
2. A Sufficiently Strong Financial Condition
For industrial companies current assets should be at least twice current liabilities—a so-called two-to-one current ratio. Also, long-term debt should not exceed the net current assets (or “working capital”). For public utilities the debt should not exceed twice the stock equity (at book value).
3. Earnings Stability
Some earnings for the common stock in each of the past ten years.
4. Dividend Record
Uninterrupted payments for at least the past 20 years.
5. Earnings Growth
A minimum increase of at least one-third in per-share earnings in the past ten years using three-year averages at the beginning and end.
6. Moderate Price/Earnings Ratio
Current price should not be more than 15 times average earnings of the past three years.
7. Moderate Ratio of Price to Assets
Current price should not be more than 1½ times the book value last reported. However, a multiplier of earnings below 15 could justify a correspondingly higher multiplier of assets. As a rule of thumb we suggest that the product of the multiplier times the ratio of price to book value should not exceed 22.5. (This figure corresponds to 15 times earnings and 1½ times book value. It would admit an issue selling at only 9 times earnings and 2.5 times asset value, etc.)
GENERAL COMMENTS: These requirements are set up especially for the needs and the temperament of defensive investors. They will eliminate the great majority of common stocks as candidates for the portfolio, and in two opposite ways. On the one hand they will exclude companies that are (1) too small, (2) in relatively weak financial condition, (3) with a deficit stigma in their ten-year record, and (4) not having a long history of continuous dividends. Of these tests the most severe under recent financial conditions are those of financial strength. A considerable number of our large and formerly strongly entrenched enterprises have weakened their current ratio or overexpanded their debt, or both, in recent years.
Our last two criteria are exclusive in the opposite direction, by demanding more earnings and more assets per dollar of price than the popular issues will supply. This is by no means the standard viewpoint of financial analysts; in fact most will insist that even conservative investors should be prepared to pay generous prices for stocks of the choice companies. We have expounded our contrary view above; it rests largely on the absence of an adequate factor of safety when too large a portion of the price must depend on ever-increasing earnings in the future. The reader will have to decide this important question for himself—after weighing the arguments on both sides.
We have nonetheless opted for the inclusion of a modest requirement of growth over the past decade. Without it the typical company would show retrogression, at least in terms of profit per dollar of invested capital. There is no reason for the defensive investor to include such companies—though if the price is low enough they could qualify as bargain opportunities.
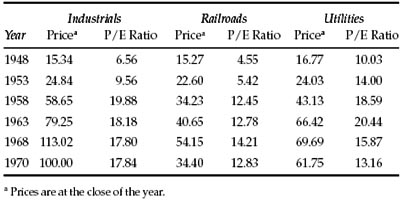
The suggested maximum figure of 15 times earnings might well result in a typical portfolio with an average multiplier of, say, 12 to 13 times. Note that in February 1972 American Tel. & Tel. sold at 11 times its three-year (and current) earnings, and Standard Oil of California at less than 10 times latest earnings. Our basic recommendation is that the stock portfolio, when acquired, should have an overall earnings/price ratio—the reverse of the P/E ratio—at least as high as the current high-grade bond rate. This would mean a P/E ratio no higher than 13.3 against an AA bond yield of 7.5%.*
Application of Our Criteria to the DJIA at the End of 1970
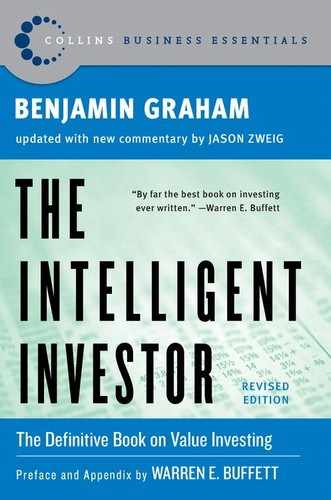
All of our suggested criteria were satisfied by the DJIA issues at the end of 1970, but two of them just barely. Here is a survey based on the closing price of 1970 and the relevant figures. (The basic data for each company are shown in Tables 14-1 and 14-2.)
- Size is more than ample for each company.
- Financial condition is adequate in the aggregate, but not for every company.2
- Some dividend has been paid by every company since at least 1940. Five of the dividend records go back to the last century.
- The aggregate earnings have been quite stable in the past decade. None of the companies reported a deficit during the prosperous period 1961–69, but Chrysler showed a small deficit in 1970.
- The total growth—comparing three-year averages a decade apart—was 77%, or about 6% per year. But five of the firms did not grow by one-third.
- The ratio of year-end price to three-year average earnings was 839 to $55.5 or 15 to 1—right at our suggested upper limit.
- The ratio of price to net asset value was 839 to 562—also just within our suggested limit of 1½ to 1.
TABLE 14-1 Basic Data on 30 Stocks in the Dow Jones Industrial Average at September 30, 1971


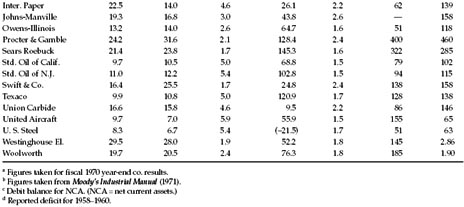
If, however, we wish to apply the same seven criteria to each individual company, we would find that only five of them would meet all our requirements. These would be: American Can, American Tel. & Tel., Anaconda, Swift, and Woolworth. The totals for these five appear in Table 14-3. Naturally they make a much better statistical showing than the DJIA as a whole, except in the past growth rate.3
Our application of specific criteria to this select group of industrial stocks indicates that the number meeting every one of our tests will be a relatively small percentage of all listed industrial issues. We hazard the guess that about 100 issues of this sort could have been found in the Standard & Poor’s Stock Guide at the end of 1970, just about enough to provide the investor with a satisfactory range of personal choice.*
The Public-Utility “Solution”
If we turn now to the field of public-utility stocks we find a much more comfortable and inviting situation for the investor.† Here the vast majority of issues appear to be cut out, by their performance record and their price ratios, in accordance with the defensive investor’s needs as we judge them. We exclude one criterion from our tests of public-utility stocks—namely, the ratio of current assets to current liabilities. The working-capital factor takes care of itself in this industry as part of the continuous financing of its growth by sales of bonds and shares. We do require an adequate proportion of stock capital to debt.4
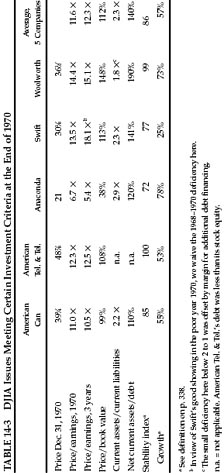
In Table 14-4 we present a résumé of the 15 issues in the Dow Jones public-utility average. For comparison, Table 14-5 gives a similar picture of a random selection of fifteen other utilities taken from the New York Stock Exchange list.
As 1972 began the defensive investor could have had quite a wide choice of utility common stocks, each of which would have met our requirements for both performance and price. These companies offered him everything he had a right to demand from simply chosen common-stock investments. In comparison with prominent industrial companies as represented by the DJIA, they offered almost as good a record of past growth, plus smaller fluctuations in the annual figures—both at a lower price in relation to earnings and assets. The dividend return was significantly higher. The position of the utilities as regulated monopolies is assuredly more of an advantage than a disadvantage for the conservative investor. Under law they are entitled to charge rates sufficiently remunerative to attract the capital they need for their continuous expansion, and this implies adequate offsets to inflated costs. While the process of regulation has often been cumbersome and perhaps dilatory, it has not prevented the utilities from earning a fair return on their rising invested capital over many decades.

For the defensive investor the central appeal of the public-utility stocks at this time should be their availability at a moderate price in relation to book value. This means that he can ignore stockmarket considerations, if he wishes, and consider himself primarily as a part owner of well-established and well-earning businesses. The market quotations are always there for him to take advantage of when times are propitious—either for purchases at unusually attractive low levels, or for sales when their prices seem definitely too high.
The market record of the public-utility indexes—condensed in Table 14-6, along with those of other groups—indicates that there have been ample possibilities of profit in these investments in the past. While the rise has not been as great as in the industrial index, the individual utilities have shown more price stability in most periods than have other groups.* It is striking to observe in this table that the relative price/earnings ratios of the industrials and the utilities have changed places during the past two decades. These reversals will have more meaning for the active than for the passive investor. But they suggest that even defensive portfolios should be changed from time to time, especially if the securities purchased have an apparently excessive advance and can be replaced by issues much more reasonably priced. Alas! there will be capital-gains taxes to pay—which for the typical investor seems to be about the same as the Devil to pay. Our old ally, experience, tells us here that it is better to sell and pay the tax than not sell and repent.
TABLE 14-6 Development of Prices and Price/Earnings Ratios for Various Standard & Poor’s Averages,
Investing in Stocks of Financial Enterprises
A considerable variety of concerns may be ranged under the rubric of “financial companies.” These would include banks, insurance companies, savings and loan associations, credit and small-loan companies, mortgage companies, and “investment companies” (e.g., mutual funds).* It is characteristic of all these enterprises that they have a relatively small part of their assets in the form of material things—such as fixed assets and merchandise inventories—but on the other hand most categories have short-term obligations well in excess of their stock capital. The question of financial soundness is, therefore, more relevant here than in the case of the typical manufacturing or commercial enterprise. This, in turn, has given rise to various forms of regulation and supervision, with the design and general result of assuring against unsound financial practices.
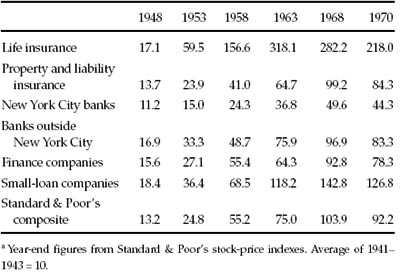
Broadly speaking, the shares of financial concerns have produced investment results similar to those of other types of common shares. Table 14-7 shows price changes between 1948 and 1970 in six groups represented in the Standard & Poor’s stock-price indexes. The average for 1941–1943 is taken as 10, the base level. The year-end 1970 figures ranged between 44.3 for the 9 New York banks and 218 for the 11 life-insurance stocks. During the subintervals there was considerable variation in the respective price movements. For example, the New York City bank stocks did quite well between 1958 and 1968; conversely the spectacular life-insurance group actually lost ground between 1963 and 1968. These cross-movements are found in many, perhaps most, of the numerous industry groups in the Standard & Poor’s indexes.
TABLE 14-7 Relative Price Movements of Stocks of Various
We have no very helpful remarks to offer in this broad area of investment—other than to counsel that the same arithmetical standards for price in relation to earnings and book value be applied to the choice of companies in these groups as we have suggested for industrial and public-utility investments.
Railroad Issues
The railroad story is a far different one from that of the utilities. The carriers have suffered severely from a combination of severe competition and strict regulation. (Their labor-cost problem has of course been difficult as well, but that has not been confined to railroads.) Automobiles, buses, and airlines have drawn off most of their passenger business and left the rest highly unprofitable; the trucks have taken a good deal of their freight traffic. More than half of the railroad mileage of the country has been in bankruptcy (or “trusteeship”) at various times during the past 50 years.
But this half-century has not been all downhill for the carriers. There have been prosperous periods for the industry, especially the war years. Some of the lines have managed to maintain their earning power and their dividends despite the general difficulties.
The Standard & Poor’s index advanced sevenfold from the low of 1942 to the high of 1968, not much below the percentage gain in the public-utility index. The bankruptcy of the Penn Central Transportation Co., our most important railroad, in 1970 shocked the financial world. Only a year and two years previously the stock sold at close to the highest price level in its long history, and it had paid continuous dividends for more than 120 years! (On p. 423 below we present a brief analysis of this railroad to illustrate how a competent student could have detected the developing weaknesses in the company’s picture and counseled against ownership of its securities.) The market level of railroad shares as a whole was seriously affected by this financial disaster.
It is usually unsound to make blanket recommendations of whole classes of securities, and there are equal objections to broad condemnations. The record of railroad share prices in Table 14-6 shows that the group as a whole has often offered chances for a large profit. (But in our view the great advances were in themselves largely unwarranted.) Let us confine our suggestion to this: There is no compelling reason for the investor to own railroad shares; before he buys any he should make sure that he is getting so much value for his money that it would be unreasonable to look for something else instead.*
Selectivity for the Defensive Investor
Every investor would like his list to be better or more promising than the average. Hence the reader will ask whether, if he gets himself a competent adviser or security analyst, he should not be able to count on being supplied with an investment package of really superior merits. “After all,” he may say, “the rules you have outlined are pretty simple and easygoing. A highly trained analyst ought to be able to use all his skill and techniques to improve substantially on something as obvious as the Dow Jones list. If not, what good are all his statistics, calculations, and pontifical judgments?”
Suppose, as a practical test, we had asked a hundred security analysts to choose the “best” five stocks in the Dow Jones Average, to be bought at the end of 1970. Few would have come up with identical choices and many of the lists would have differed completely from each other.
This is not so surprising as it may at first appear. The underlying reason is that the current price of each prominent stock pretty well reflects the salient factors in its financial record plus the general opinion as to its future prospects. Hence the view of any analyst that one stock is a better buy than the rest must arise to a great extent from his personal partialities and expectations, or from the placing of his emphasis on one set of factors rather than on another in his work of evaluation. If all analysts were agreed that one particular stock was better than all the rest, that issue would quickly advance to a price which would offset all of its previous advantages.*
Our statement that the current price reflects both known facts and future expectations was intended to emphasize the double basis for market valuations. Corresponding with these two kinds of value elements are two basically different approaches to security analysis. To be sure, every competent analyst looks forward to the future rather than backward to the past, and he realizes that his work will prove good or bad depending on what will happen and not on what has happened. Nevertheless, the future itself can be approached in two different ways, which may be called the way of prediction (or projection) and the way of protection. *
Those who emphasize prediction will endeavor to anticipate fairly accurately just what the company will accomplish in future years—in particular whether earnings will show pronounced and persistent growth. These conclusions may be based on a very careful study of such factors as supply and demand in the industry—or volume, price, and costs—or else they may be derived from a rather naïve projection of the line of past growth into the future. If these authorities are convinced that the fairly long-term prospects are unusually favorable, they will almost always recommend the stock for purchase without paying too much regard to the level at which it is selling. Such, for example, was the general attitude with respect to the air-transport stocks—an attitude that persisted for many years despite the distressingly bad results often shown after 1946. In the Introduction we have commented on the disparity between the strong price action and the relatively disappointing earnings record of this industry.
By contrast, those who emphasize protection are always especially concerned with the price of the issue at the time of study. Their main effort is to assure themselves of a substantial margin of indicated present value above the market price—which margin could absorb unfavorable developments in the future. Generally speaking, therefore, it is not so necessary for them to be enthusiastic over the company’s long-run prospects as it is to be reasonably confident that the enterprise will get along.
The first, or predictive, approach could also be called the qualitative approach, since it emphasizes prospects, management, and other nonmeasurable, albeit highly important, factors that go under the heading of quality. The second, or protective, approach may be called the quantitative or statistical approach, since it emphasizes the measurable relationships between selling price and earnings, assets, dividends, and so forth. Incidentally, the quantitative method is really an extension—into the field of common stocks—of the viewpoint that security analysis has found to be sound in the selection of bonds and preferred stocks for investment.
In our own attitude and professional work we were always committed to the quantitative approach. From the first we wanted to make sure that we were getting ample value for our money in concrete, demonstrable terms. We were not willing to accept the prospects and promises of the future as compensation for a lack of sufficient value in hand. This has by no means been the standard viewpoint among investment authorities; in fact, the majority would probably subscribe to the view that prospects, quality of management, other intangibles, and “the human factor” far outweigh the indications supplied by any study of the past record, the balance sheet, and all the other cold figures.
Thus this matter of choosing the “best” stocks is at bottom a highly controversial one. Our advice to the defensive investor is that he let it alone. Let him emphasize diversification more than individual selection. Incidentally, the universally accepted idea of diversification is, in part at least, the negation of the ambitious pretensions of selectivity. If one could select the best stocks unerringly, one would only lose by diversifying. Yet within the limits of the four most general rules of common-stock selection suggested for the defensive investor (on pp. 114–115) there is room for a rather considerable freedom of preference. At the worst the indulgence of such preferences should do no harm; beyond that, it may add something worthwhile to the results. With the increasing impact of technological developments on long-term corporate results, the investor cannot leave them out of his calculations. Here, as elsewhere, he must seek a mean between neglect and overemphasis.
Commentary on Chapter 14
He that resteth upon gains certain, shall hardly grow to great riches; and he that puts all upon adventures, doth oftentimes break and come to poverty: it is good therefore to guard adventures with certainties that may uphold losses.
—Sir Francis Bacon
Getting Started
How should you tackle the nitty-gritty work of stock selection? Graham suggests that the defensive investor can, “most simply,” buy every stock in the DowJones Industrial Average. Today’s defensive investor can do even better—by buying a total stock-market index fund that holds essentially every stock worth having. A low-cost index fund is the best tool ever created for low-maintenance stock investing—and any effort to improve on it takes more work (and incurs more risk and higher costs) than a truly defensive investor can justify.
Researching and selecting your own stocks is not necessary; for most people, it is not even advisable. However, some defensive investors do enjoy the diversion and intellectual challenge of picking individual stocks—and, if you have survived a bear market and still enjoy stock picking, then nothing that Graham or I could say will dissuade you. In that case, instead of making a total stock market index fund your complete portfolio, make it the foundation of your portfolio. Once you have that foundation in place, you can experiment around the edges with your own stock choices. Keep 90% of your stock money in an index fund, leaving 10% with which to try picking your own stocks. Only after you build that solid core should you explore. (To learn why such broad diversification is so important, please see the sidebar on the following page.)
WHY DIVERSIFY?
During the bull market of the 1990s, one of the most common criticisms of diversification was that it lowers your potential for high returns. After all, if you could identify the next Microsoft, wouldn’t it make sense for you to put all your eggs into that one basket?
Well, sure. As the humorist Will Rogers once said, “Don’t gamble. Take all your savings and buy some good stock and hold it till it goes up, then sell it. If it don’t go up, don’t buy it.”
However, as Rogers knew, 20/20 foresight is not a gift granted to most investors. No matter how confident we feel, there’s no way to find out whether a stock will go up until after we buy it. Therefore, the stock you think is “the next Microsoft” may well turn out to be the next MicroStrategy instead. (That former market star went from $3,130 per share in March 2000 to $15.10 at year-end 2002, an apocalyptic loss of 99.5%).1 Keeping your money spread across many stocks and industries is the only reliable insurance against the risk of being wrong.
But diversification doesn’t just minimize your odds of being wrong. It also maximizes your chances of being right. Over long periods of time, a handful of stocks turn into “superstocks” that go up 10,000% or more. Money Magazine identified the 30 best-performing stocks over the 30 years ending in 2002—and, even with 20/20 hindsight, the list is startlingly unpredictable. Rather than lots of technology or health-care stocks, it includes Southwest Airlines, Worthington Steel, Dollar General discount stores, and snuff-tobacco maker UST Inc.2 If you think you would have been willing to bet big on any of those stocks back in 1972, you are kidding yourself.
Think of it this way: In the huge market haystack, only a few needles ever go on to generate truly gigantic gains. The more of the haystack you own, the higher the odds go that you will end up finding at least one of those needles. By owning the entire haystack (ideally through an index fund that tracks the total U.S. stock market) you can be sure to find every needle, thus capturing the returns of all the superstocks. Especially if you are a defensive investor, why look for the needles when you can own the whole haystack?
Testing, Testing
Let’s briefly update Graham’s criteria for stock selection.
Adequate size. Nowadays, “to exclude small companies,” most defensive investors should steer clear of stocks with a total market value of less than $2 billion. In early 2003, that still left you with 437 of the companies in the Standard & Poor’s 500-stock index to choose from.
However, today’s defensive investors—unlike those in Graham’s day—can conveniently own small companies by buying a mutual fund specializing in small stocks. Again, an index fund like Vanguard Small-Cap Index is the first choice, although active funds are available at reasonable cost from such firms as Ariel, T. Rowe Price, Royce, and Third Avenue.
Strong financial condition. According to market strategists Steve Galbraith and Jay Lasus of Morgan Stanley, at the beginning of 2003 about 120 of the companies in the S & P 500 index met Graham’s test of a 2-to-1 current ratio. With current assets at least twice their current liabilities, these firms had a sizeable cushion of working capital that—on average—should sustain them through hard times.
Wall Street has always abounded in bitter ironies, and the bursting of the growth-stock bubble has created a doozy: In 1999 and 2000, high-tech, bio-tech, and telecommunications stocks were supposed to provide “aggressive growth” and ended up giving most of their investors aggressive shrinkage instead. But, by early 2003, the wheel had come full circle, and many of those aggressive growth stocks had become financially conservative—loaded with working capital, rich in cash, and often debt-free. This table provides a sampler:
FIGURE 14-1 Everything New Is Old Again
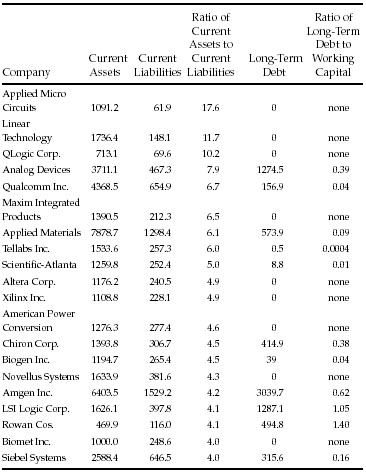
All figures in millions of dollars from latest available financial statements as of 12/31/02. Working capital is current assets minus current liabilities. Long-term debt includes preferred stock, excludes deferred tax liabilities. Sources: Morgan Stanley; Baseline; EDGAR database at www.sec.gov.
In 1999, most of these companies were among the hottest of the market’s darlings, offering the promise of high potential growth. By early 2003, they offered hard evidence of true value.
The lesson here is not that these stocks were “a sure thing,” or that you should rush out and buy everything (or anything) in this table.1 Instead, you should realize that a defensive investor can always prosper by looking patiently and calmly through the wreckage of a bear market. Graham’s criterion of financial strength still works: If you build a diversified basket of stocks whose current assets are at least double their current liabilities, and whose long-term debt does not exceed working capital, you should end up with a group of conservatively financed companies with plenty of staying power. The best values today are often found in the stocks that were once hot and have since gone cold. Throughout history, such stocks have often provided the margin of safety that a defensive investor demands.
Earnings stability. According to Morgan Stanley, 86% of all the companies in the S & P 500 index have had positive earnings in every year from 1993 through 2002. So Graham’s insistence on “some earnings for the common stock in each of the past ten years” remains a valid test—tough enough to eliminate chronic losers, but not so restrictive as to limit your choices to an unrealistically small sample.
Dividend record. As of early 2003, according to Standard & Poor’s, 354 companies in the S & P 500 (or 71% of the total) paid a dividend. No fewer than 255 companies have paid a dividend for at least 20 years in a row. And, according to S & P, 57 companies in the index have raised their dividends for at least 25 consecutive years. That’s no guarantee that they will do so forever, but it’s a comforting sign.
Earnings growth. How many companies in the S & P 500 increased their earnings per share by “at least one third,” as Graham requires, over the 10 years ending in 2002? (We’ll average each company’s earnings from 1991 through 1993, and then determine whether the average earnings from 2000 through 2002 were at least 33% higher.) According to Morgan Stanley, 264 companies in the S & P 500 met that test. But here, it seems, Graham set a very low hurdle; 33% cumulative growth over a decade is less than a 3% average annual increase. Cumulative growth in earnings per share of at least 50%—or a 4% average annual rise—is a bit less conservative. No fewer than 245 companies in the S & P 500 index met that criterion as of early 2003, leaving the defensive investor an ample list to choose from. (If you double the cumulative growth hurdle to 100%, or 7% average annual growth, then 198 companies make the cutoff.)
FIGURE 14-2 Steady Eddies
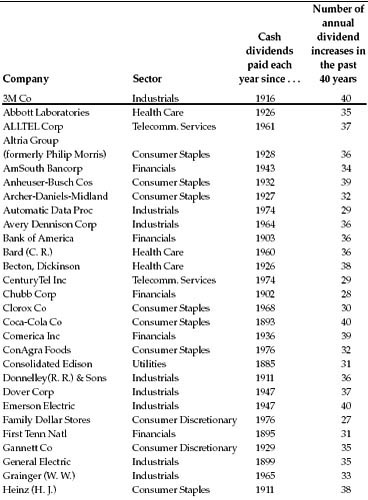

Source: Standard & Poor’s Corp.
Data as of 12/31/2002.
Moderate P/E ratio. Graham recommends limiting yourself to stocks whose current price is no more than 15 times average earnings over the past three years. Incredibly, the prevailing practice on Wall Street today is to value stocks by dividing their current price by something called “next year’s earnings.” That gives what is sometimes called “the forward P/E ratio.” But it’s nonsensical to derive a price/earnings ratio by dividing the known current price by unknown future earnings. Over the long run, money manager David Dreman has shown, 59% of Wall Street’s “consensus” earnings forecasts miss the mark by a mortifyingly wide margin—either underestimating or overestimating the actual reported earnings by at least 15%.2 Investing your money on the basis of what these myopic soothsayers predict for the coming year is as risky as volunteering to hold up the bulls-eye at an archery tournament for the legally blind. Instead, calculate a stock’s price/earnings ratio yourself, using Graham’s formula of current price divided by average earnings over the past three years.3
As of early 2003, how many stocks in the Standard & Poor’s 500 index were valued at no more than 15 times their average earnings of 2000 through 2002? According to Morgan Stanley, a generous total of 185 companies passed Graham’s test.
Moderate price-to-book ratio. Graham recommends a “ratio of price to assets” (or price-to-book-value ratio) of no more than 1.5. In recent years, an increasing proportion of the value of companies has come from intangible assets like franchises, brand names, and patents and trademarks. Since these factors (along with goodwill from acquisitions) are excluded from the standard definition of book value, most companies today are priced at higher price-to-book multiples than in Graham’s day. According to Morgan Stanley, 123 of the companies in the S & P 500 (or one in four) are priced below 1.5 times book value. All told, 273 companies (or 55% of the index) have price-to-book ratios of less than 2.5.
What about Graham’s suggestion that you multiply the P/E ratio by the price-to-book ratio and see whether the resulting number is below 22.5? Based on data from Morgan Stanley, at least 142 stocks in the S & P 500 could pass that test as of early 2003, including Dana Corp., Electronic Data Systems, Sun Microsystems, and Washington Mutual. So Graham’s “blended multiplier” still works as an initial screen to identify reasonably-priced stocks.
Due Diligence
No matter how defensive an investor you are—in Graham’s sense of wishing to minimize the work you put into picking stocks—there are a couple of steps you cannot afford to skip:
Do your homework. Through the EDGAR database at www.sec. gov, you get instant access to a company’s annual and quarterly reports, along with the proxy statement that discloses the managers’ compensation, ownership, and potential conflicts of interest. Read at least five years’ worth.4
Check out the neighborhood. Websites like http://quicktake. morningstar.com, http://finance.yahoo.com and www.quicken.com can readily tell you what percentage of a company’s shares are owned by institutions. Anything over 60% suggests that a stock is scarcely undiscovered and probably “overowned.” (When big institutions sell, they tend to move in lockstep, with disastrous results for the stock. Imagine all the Radio City Rockettes toppling off the front edge of the stage at once and you get the idea.) Those websites will also tell you who the largest owners of the stock are. If they are money-management firms that invest in a style similar to your own, that’s a good sign.