
Chapter 3
Debt Instruments
Companies, banks, central governments (such as the United Kingdom, Republic of France, etc.); local governments (such as the city of Manchester, province of Quebec, State of California, etc.) and supranational institutions (such as the World Bank, European Union, etc.) also raise cash by issuing debt instruments, also known as bonds and bills.
A debt instrument is effectively an “IOU” – a promise to pay the investor periodic amounts of interest (known as the coupon) on a loan and also the promise to return the amount borrowed to the investor at a date in the future. Unlike equities, debt instruments are usually (but not exclusively) issued for a defined period of time, after which they are said to mature. Upon maturity date the amount borrowed is returned to the investors together with the final coupon payment. As with equities, debt instruments are traded on a secondary market so that investors may buy and sell them without the involvement of the issuer.
The main differences between debt and equity finance are as follows:
- Only companies can issue equity shares, as companies can be owned by others. Central and local governments belong to society as a whole; by definition they cannot be owned by others, so when governments need to raise capital they have to use the debt markets.
- Debt instruments provide a predictable, guaranteed form of income – the interest on the bond – which is known as the coupon. The coupon is paid at regular intervals at a guaranteed rate of return; unlike dividends which are dependent upon the fortunes of the company that issued the shares. For this reason, debt instruments are also known as fixed income securities.
- Debt instruments provide very restricted opportunities for capital growth compared with equities.
Like listed equities, bonds are issued on the primary market and may be bought and sold by investors in the secondary market. They are sometimes listed on stock exchanges, but more often they are traded by investment banks outside of the stock exchange, on what is known at the over-the-counter market, or OTC market. An investor that wishes to buy or sell a particular bond contacts a number of investment banks to ask them at what price they are willing to buy or sell a given quantity of a given bond. As with equities, secondary market bond prices vary according to supply and demand, and the factors that affect those prices are discussed in section 3.4.
3.1 TYPES OF DEBT INSTRUMENTS
3.1.1 Straight bonds
Straight bonds, also known as “plain vanilla” bonds, are the simplest type of debt instrument, because the amount of the coupon to be paid by the borrower is fixed for the entire life of the bond. Consider the following example:
National Grid plc EUR 500 million 4.375% fixed rate instruments due 2020
On 10 March 2006 the UK utility National Grid plc issued bonds with a total value of EUR 500 million (the principal amount or face value of the bond), which pay an annual coupon of 4.375% on 10 March each year (the coupon date), until 10 March 2020 (the maturity date) when National Grid will repay the proceeds of the bond to the investors.
When the bond was issued it was sold on the primary market at an issue price of 98.935% of face value to a large number of investors in smaller quantities, who may then sell all or part of their holding on the secondary market in the future.
From the bond issuer’s perspective:
1. Because the issue price was 98.935% National Grid therefore raised EUR 494 675 000 – 98.395% of face value.
2. The total cost to National Grid of issuing this bond is therefore EUR 21 875 000 per annum (4.375% of EUR 500 million) each year for 14 years, plus EUR 5 325 000 (the difference between the issue price of 98.935% and the face value).
From the investor’s perspective
1. The total annual coupon income that an investor who has purchased bonds with a face value of EUR 1 000 000 is EUR 43 750.
2. In addition, an investor who purchased face value of EUR 1 000 000 bonds on issue date would earn a capital gain of EUR 16050.00 (the difference between the issue price of 98.935% and the face value).
3.1.2 Floating rate notes (FRNs)
FRNs are more complicated than straight bonds because the amount of the coupon to be paid by the borrower will vary during the life of the bond. Consider the following example:
National Grid plc EUR 750 million floating rate instruments due 2012
On 18 September 2006 the UK utility National Grid plc issued bonds with a total value of EUR 750 million (the principal amount of the bond), which pay quarterly coupons of EURIBOR + 35 basis points (one basis point is 1/100 of 1%) on 18 January, 18 April, 18 July and 18 October) each year (the coupon dates), until 18 January 2012 (the maturity date) when National Grid will repay the proceeds of the bond to the investors. On the primary market the bond was sold to a large number of investors in smaller quantities at an issue price of 99.853% of face value.
The difference between this bond and the fixed rate bond is that the interest rate that is payable by the borrower, and therefore received by the investor, is not a fixed percentage of the principal amount. Instead, its coupon rate is usually linked to a specified benchmark interest rate (in this case EURIBOR, the European InterBank Offered Rate).1
Two working days before the end of each coupon period (the interval between the two semi-annual coupon dates) the coupon rate of the bond is reset according to the current value of EURIBOR. For example, if EURIBOR is 5.0% on 16 January then the interest rate for the coupon period starting 18 January will be 5.35%. If six months later the value of LIBOR is 5.5% then the coupon rate of this bond will increase to 5.85%.
From the bond issuer’s perspective
Because the bond was sold to investors at an issue price of 99.853% of face value, National Grid raised EUR 748 897 500.00. They will have to repay EUR 750 000.00 in January 2012.
There is less certainty regarding the interest amounts payable or receivable, the annual interest cost will be whatever EURIBOR is at the time +0.35%. FRNs are often issued with guaranteed minimum and/or maximum interest rates. The total cost to National Grid of issuing this bond is the annual coupon payment of EURIBOR +35 basis points each year for six years, plus EUR 1102 500.00 (the difference between the issue price of 99.835% and the face value of the bond).
From the investor’s perspective
Like the issuer, the investor has no certainty as to the value of future coupon payments. An investor who purchased face value 1 000 000 of the bond on the primary market will receive coupon payments of EURIBOR +35 basis points each year for six years, and will earn a capital gain of EUR 1470.00 (the difference between the issue price of 99.853% and face value).
Other features of FRNs
Some FRNs are issued with guaranteed minimum and/or maximum coupon rates. The minimum rate is known as a floor, and the maximum rate is known as a cap. Where there is both a floor and a cap, then this is known as a collar. Some issuers have also issued perpetual floating rate notes which have no maturity date.
3.1.3 Zero coupon bonds
As the name implies, these bonds do not pay a regular coupon to the investors. Instead, the investors purchase the bonds on the primary market at a discount to their face value, and will be rewarded at maturity date when the issuer will repay them with the face value of the bonds. Consider the following example.
British Transco International Finance BV USD 1500 million zero coupon bond due 2021
On 4 November 1991, British Transco (then an independent company but now a subsidiary of National Grid plc) issued these bonds with a total repayment value at maturity date of USD 1500 million. The bonds do not pay a coupon, instead they were issued at an issue price of 8.77% of face value, and all the income comes at the maturity date (4 November 2021) when the bonds will be redeemed at 100% of face value.
From the bond issuer’s perspective
The total amount paid to the issuer by the investors on 4 November 1991 was USD 131 550 million; and the amount that the issuer has to repay to them on 4 November 2021 (30 years later) is the face value of EUR 1500 million.
The investors of course do not receive any regular income payments in the form of coupons, but the issuer has to put aside the funds to repay them at face value. This amounts to USD 45 615 000 per year calculated as follows:
Face value – Amount received on issue date/30 years = Annual interest cost
i.e.
1500 000 000 – 131 550 000/30 = 45 615 000
As we have already explained, this interest is not paid to the investors until maturity date.
From the investor’s perspective
There are no regular coupon payments. All the income comes to the investor at maturity date. An investor that purchased face value 1,000,000 of the bond on issue date would have paid USD 87 700 for it, and will receive USD 1000 000 on maturity date.
3.1.4 Asset-backed securities
Asset-backed securities are types of bond or notes that are based on pools of assets, or collateralised by the cash flows from a specified pool of underlying assets such as receivables from credit card payments, auto loans, and mortgages, or more esoteric cash flows such as aircraft leases, royalty payments and movie revenues.
Assets are pooled to make otherwise minor and uneconomical investments worthwhile, while also reducing risk by diversifying the underlying assets. Asset backed securities may be issued in the form of straight bonds, floating rate notes or zero coupon bonds.
Securitisation makes these assets available for investment to a broader set of investors. Typically, the securitised assets might be highly illiquid and private in nature, and sometimes difficult to value. Difficulty in valuing instruments of this kind led to the difficulties’ in the market place in 2007 that have become known as the credit crunch.
Case study: The 2007 credit crunch and Northern Rock plc
In 2007, after 15 interest rate rises in 18 months, house prices in the USA began to fall and many homeowners on lower incomes were unable or unwilling to keep up their mortgage repayments. Lenders began to foreclose these mortgages that were in default. Many of these mortgages had been repackaged as asset-backed securities and sold on. Market participants became concerned that a significant number of asset-backed bonds might include subprime mortgages, and that there was insufficient information as to which securities issuers and individual instruments might be affected. As a result, trading in such instruments virtually ceased in August 2007, creating what is popularly known as the “credit crunch” but is more technically known as liquidity risk. In the UK, the highest profile corporate casualty of the credit crunch was Northern Rock Bank, a mortgage lender that had grown rapidly in the previous 10 years despite having a relatively small retail deposit base. The company had repackaged many of its mortgages in the form of asset-backed securities, and as these matured it could not refinance them. As a result, it was forced to borrow (ultimately) over £20 billion from the Bank of England, acting in its capacity as the lender of last resort. When news of the fact that the central bank had been forced to rescue Northern Rock reached the general public on 13 September, television viewers saw queues of several hundred people outside Northern Rock branches attempting to withdraw their savings. Several attempts were then made to find a commercial buyer to purchase Northern Rock’s assets, but these proved unsuccessful. As a result, Northern Rock was nationalised by the UK government in February 2008.
3.1.5 Index linked bonds
An index linked bond is a bond whose interest rate and/or redemption proceeds are linked to an index, such as the Retail Price Index in the United Kingdom. Consider the following example.
National Grid Electricity Transmission plc GBP 50 million 1.6574% RPI-linked instruments due 2056
On 28 July 2006 the UK utility National Grid plc issued bonds with a total value of GBP 50 million (the principal amount of the bond), which pay semi-annual coupons on 28 January and 28 July each year (the coupon dates), until 28 July 2056 (the maturity date). The issue price of these bonds was 100%, i.e. the issue price was the same as the face value.
The amount of each coupon is 1.6574% of face value plus the amount by which the UK Retail Price Index has changed since the last coupon payment. On maturity date (28 July 2056) National Grid will repay the proceeds of the bond, adjusted for changes in RPI since issue date to the investors. The key feature of these types of bonds is that both the semi-annual coupon payments and the redemption proceeds are adjusted for inflation in the period before the new coupon is fixed.
This means that neither the coupon payments nor the redemption proceeds are easily predictable. Organisations that are contemplating either issuing or investing in such securities need software applications that are capable of modelling a number of inflation predictions. Simplistically, if we assume that UK inflation is consistently 3% per annum for the life of this bond, then the coupon rates will be affected as follows:
- The first coupon payment on 28 January 2007 will be 101.5% of the quoted coupon rate of 1.6574% – i.e. 1.682261%.
- The second coupon payment on 28 July 2007 will be 101.5% of the coupon rate for the previous period (1.682261%) – i.e. 1.707495%.
- Each further semi-annual coupon payment (expressed as a percentage of face value) will increment by 1.5% of the quoted rate (compounded) on each payment date. This means that the final coupon payment will be equivalent to 4.180419% of face value.
Using the same assumption, we can predict the maturity proceeds as GBP 224 926 316.71 – the original amount borrowed plus 3% compounded for 50 years.
From the issuer’s perspective
The issuer raised GBP 50000.00 and needs to repay this amount adjusted for inflation 50 years later. It also needs to pay interest of 1.6754% adjusted for inflation, paid semi-annually.
From the investor’s perspective
An investor who purchased GBP 1 000 000 face value will receive this amount, adjusted for inflation on maturity date 50 years later. It will also receive interest of 1.6754% adjusted for inflation, paid semi-annually.
3.1.6 Convertible bonds
A convertible bond is (usually) a straight bond that offers the investor the opportunity to surrender the bond in exchange for equity securities at a fixed price per share. The equity securities are usually issued by the same company that issued the bond. Consider the following example.
Cable and Wireless plc GBP 258 million 4% senior unsecured convertible bonds due 2010 which allow the holder to convert the bonds into Cable and Wireless ordinary shares, 145 pence per share, which represents a 48% premium over the reference price of 98 pence
On 16 July 2003 the UK telecoms company Cable and Wireless plc issued bonds with a total value of GBP 258 million (the principal amount of the bond), which pay semi-annual coupons of 4% on 16 January and 16 July each year (the coupon date), until 16 July 2010 (the maturity date) when Cable and Wireless will repay the proceeds of the bond to the investors. The bonds were issued at a price of 100%, i.e. at face value.
Alternatively, at any time during the life of the bond the investors can convert the bonds into equities issued by Cable and Wireless at a price of £1.45 per share. Therefore if the investor has bonds with a face value of GBP 10 000 it will be able to exchange these bonds for 6 896.55 shares in Cable and Wireless plc. At the time that these bonds were issued, Cable and Wireless shares were trading at 98 pence per share, so obviously conversion is only worthwhile when and if the price of Cable and Wireless shares has risen to more than £1.45.
This type of bond offers the benefit to the borrower that it can pay a lower coupon rate, and is attractive to an investor who thinks that the price of Cable and Wireless shares is likely to rise during the lifetime of the bond, but in the meantime wants to have the benefit of the coupon income.
From the issuer’s perspective
1. If none of the bonds were converted: Cable and Wireless raised GBP 258 000 000 on issue date, and, assuming that no bonds are converted, will need to repay this amount to investors at maturity date. It also needs to pay investors semi-annual coupons of 4%, so its annual interest cost will be GBP 10 320 000.
2. The effect of conversion: Each GBP 1 000 000 face value that is converted reduces the amount to be repaid on maturity date by the same amount, and reduces the annual interest cost to the issuer by GBP 40 000.00.
From the investor’s perspective
1. If none of the bonds were converted: This bond is behaving like any other straight bond. Because the bonds were not issued at a discount to face value there is no opportunity for capital growth, but the investor will receive GBP 40 000 in interest each year for every GBP 1000000.00 purchased.
2. The effect of conversion: If bonds with a face value of GBP 1000000 are converted, the investor ceases to receive coupon payments and is not entitled to any repayment at maturity. Instead, it will receive 689,655 shares in Cable and Wireless plc and become entitled to any dividends paid by that company. If the shares are trading at GBP 1.50 each then it might choose to sell them, realising trade proceeds of GBP 1 034 482.50; and thereby making a profit of GBP 34 482.50 on its original investment in the bond.
3.1.7 Bonds with warrants attached
A warrant is a security that entitles the holder to buy stock of the company that issued it at a specified price, which is much higher than the stock price at time of issue.
Warrants are much like call options (see section 5.1) but the money goes to the issuer, not an option writer, and it initially has a lifespan of many years. When the warrant is exercised the company issues new shares of stock, so the number of outstanding shares increases.
Warrants are frequently attached to bonds as a sweetener, allowing the issuer to pay lower interest rates or dividends. A bond with warrants attached is also known as a cum-warrant bond. These warrants are detachable, and can be sold independently of the cum-warrant bond. If they are detached, then in effect the security is split into two new securities:
- The warrants – which can now be traded as an independent security, or exercised in the same way that a call option is exercised
- The underlying bond, known as the ex-warrant bond, which can continue to be traded as if it were a straight bond. Naturally the price of the ex-warrant bond will be lower than that of the cum-warrant bond.
3.1.8 Bills
Straight bonds that have an original maturity of less than one year are known as bills.
3.2 ACCRUED INTEREST ON BONDS IN THE SECONDARY MARKET
Bond issuers usually pay coupons annually or semi-annually, but sometimes at more frequent intervals. The coupon is paid to the investor that holds the bond on record date, which is usually one business day before the coupon date. Even if that investor only bought the bond a few days before record date, it will receive the coupon for the entire coupon period, and the investor that held the bond for the earlier part of the coupon period will receive nothing. For this reason, when bonds are bought and sold on the secondary market, the accrued interest on the bond for the coupon period is also bought and sold at the same time.
Example
The Cable and Wireless 4% convertible bond maturing 16 July 2010 last paid a coupon on 16 January 2008. On trade date 5 February 2008, for value date 8 February 2008, Investor A sells £100 000 face value of this bond to Investor B at a trade price of 96% of face value. Assuming that there are no commissions or fees, then the consideration that B has to pay A will be calculated as follows:
| Principal amount: £100 000 face value @ trade price 96% | £96 000.00 |
| Accrued interest £100 000 face value * 4% for 23 days | £252.75 |
| Consideration | £96 252.75 |
In this way Investor A receives the coupon (£252.75) that it is entitled to from Investor B on 8 February 2008. Investor B, in turn, will receive a semi-annual coupon payment of £2000.00 from Cable and Wireless on 16 July 2008.
Investor B had agreed to pay Investor A a trade price of 96% of face value, but because of the affect of accrued interest, it is actually paying a price of 96.25275% of face value. These two prices are known as the clean price (96%) and the dirty price (96.25275%), respectively. Clean and dirty prices are used in the bond market analytics which are examined in the section 3.4 and in Appendix 1.
There are a number of commonly used methods of calculating the accrued interest on bond trades. The most commonly used methods are:
- 30/360: There are deemed to be 360 days in a year, and all months are deemed to be 30 days long. This method was used for many straight bonds that were issued before 1 January 1999. For example:
We sell 100 000 of a bond bearing a 5% coupon for value date 7 April 2008. The bond last paid a coupon on 5 January 2008.
The calculation of accrued interest is:

where
t = number of calendar days from, and including, the last interest payment date to and including the value date, assuming that each month is 30 days long
c = the annual rate of interest
This is extended as:

Rounded to two decimal places of the currency this comes to 1277.77.
The 92 days of T are comprised of 25 days in January, 30 days in February and March, and 7 days in April.
- Actual/360: There are deemed to be 360 days in a year, and we follow the conventional calendar for determining the days in a month. This method is used for most FRNs – except those denominated in pounds sterling and Japanese yen, which use the next method.
- Actual/365: We follow the actual calendar. Although this rule is usually expressed as “over 365”, if there are 366 days in a year then 366 is used as the divisor.
- Actual/actual: The number of days in the coupon period – as distinct from the number of days in the year – is used for all calculations.
Nearly all straight and convertible bonds that have been issued since the advent of Economic and Monetary Union on 1 January 1999 use the actual/actual method.
The formula for calculating interest using actual/actual is:
![]()
where
t = the actual number of calendar days from, and including, the last interest payment date to and including the value date
s = the actual number of calendar days in the current interest period
c = the annual rate of interest
n = the number of interest payments per annum
In the example of the Cable and Wireless bond above, the formula is therefore extended as
![]()
This formula is modified in the situation where there is an abnormally long or short first coupon period. Such a situation occurs when an issuer issues a bond for an irregular period of, say, 10 years and two months. In such a case the first coupon period (if coupons are to be paid semi-annually) would be for eight months. The modifications are:
- The first coupon period is deemed to start on the date which would have been the normal coupon date on or before the date on which interest starts accruing (i.e. four months before issue date in the example).
- If the date on which interest starts accruing is before the date that would have been the coupon date, then the period shall be split into two quasi interest periods for the purpose of the calculation.
3.3 MORE TRADE TERMINOLOGY
Looking at the issue of accrued interest on bond trades has introduced us to more trade terminology (Table 3.1) to add to that listed Table 2.1.
Table 3.1 Additional debt instrument trade terminology
| Term | Explanation |
| Accrued interest | In this context, the amount of interest that a bond purchaser pays a bond seller for the coupon income that the seller is entitled to for the period from the previous coupon date to trade value date |
| Benchmark rate | A rate such as LIBOR or EURIBOR that is used to determine the coupon rate on a floating rate note |
| Clean price | The price of a bond trade excluding accrued interest |
| Dirty price | The price of a bond trade including accrued interest |
| Coupon date | The dates on which the issuer pays interest on the bond |
| Next coupon date | The next date on which the issuer will pay interest on the bond |
| Previous coupon date | The previous date on which the issuer paid interest on the bond |
| Fixing date | The date on which the coupon rate on a floating rate note is fixed for the next coupon period. This is normally two working days before the next coupon date; i.e. the coupon date at the start of the coupon period |
| Coupon rate | The rate of interest on the bond |
| Coupon frequency | The number of times in the year that the issue pays interest |
| Coupon period | The difference (in days) between the last coupon date and the next coupon date |
| Accrued interest days | The difference (in days) between the previous coupon date and the value date of a bond trade |
3.4 HOW PRICES ARE FORMED IN THE SECONDARY MARKET
Bond prices fluctuate according to supply and demand. This is affected by investor sentiment as to the ability of an individual investor to continue to pay coupons and redemption proceeds, but to a larger extent bond prices vary according to the current level of short-term interest rates in the money markets as a whole. Simplistically, if a bond carries a 5% coupon at a time when short-term interest rates are less than 5%, then its price (quoted as a percentage of face value) will be greater than 100%, but if short-term interest rates rise to more than 5%, then its market price will be less than 5%. Bond market analytics is a complex subject.
3.4.1 The yield curve
The yield curve is the relation between the interest rate (or cost of borrowing) and the time to original maturity of the debt for a given borrower in a given currency. Normally, the longer the time to maturity of the debt instrument, the higher the yield to the investor, and the higher the interest rate cost to the borrower. Yield curves are commonly plotted on a graph such as the one in Figure 3.1, and typically show a gentle upward sloping pattern.
Figure 3.1 Example of a yield curve
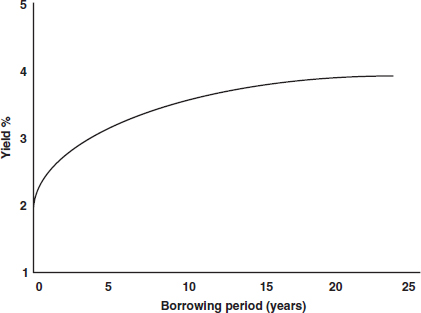
However, a positively sloped yield curve is not always the norm. A steep yield curve indicates the beginning of an economic expansion or the end of a recession. Economic stagnation will have depressed short-term interest rates; however, rates begin to rise once the demand for capital is re-established by growing economic activity. A flat yield curve is observed when all maturities have similar yields, whereas a humped curve results when short-term and long-term yields are equal and medium-term yields are higher than those of the short term and long term. A flat curve signals uncertainty in the economy.
An inverted yield curve occurs when long-term yields fall below short-term yields. This implies that long-term investors will settle for lower yields now if they think the economy will slow or even decline in the future. An inverted curve may indicate a worsening economic situation in the future.
In order to value and compare the prices of bonds issued by a wide range of issuers in a wide range of currencies, a number of valuation methodologies have been developed, and these are described in Appendix 1.
3.4.2 The importance of a credit rating and the role of the rating agencies
In order for a bond issuer to be able to issue a bond, the issuer must obtain a credit rating from a credit rating agency. A credit rating measures the ability to pay back a loan, and affects the interest rate applied to loans. Interest rates are not the same for everyone, but instead are based on risk-based pricing, a form of price discrimination based on the different expected costs of different borrowers, as set out in their credit rating. There are more than 100 rating agencies worldwide, including:
- A.M. Best (US)
- Baycorp Advantage (Australia)
- Dominion Bond Rating Service (Canada)
- Fitch Ratings (Worldwide)
- Moody’s (Worldwide)
- Standard & Poor’s (Worldwide).
Issuers rely on credit ratings as an independent verification of their own creditworthiness. In most cases, a significant bond issuance must have at least one rating from a respected CRA for the issuance to be successful (without such a rating, the issuance may be undersubscribed or the price offered by investors too low for the issuer’s purposes). Many institutional investors now prefer that a debt issuance has at least three ratings. Investment banks and broker/dealers also use credit ratings in calculating their own risk portfolios (i.e. the collective risk of all of their investments). Larger banks and broker/dealers conduct their own risk calculations, but rely on CRA ratings as a “check” (and double-check or triple-check) against their own analyses. Regulators use credit ratings as well, or permit these ratings to be used for regulatory purposes. For example, under the Basel II agreement of the Basel Committee on Banking Supervision, banking regulators can allow banks to use credit ratings from certain approved CRAs (called “ECAIs” or “External Credit Assessment Institutions”) when calculating their net capital reserve requirements.
Credit ratings are expressed as a series of alphanumeric characters, and the exact codes that are used vary from agency to agency. Table 3.2 explains the codes that are used by Moody’s.
Table 3.2 Moody’s debt ratings
| Rating | Explanation |
| Aaa | These bonds carry the smallest degree of investment risk. Interest payments are protected by a large or an exceptionally stable margin and principal is secure. While the various protective elements are likely to change, such changes as can be visualised are most unlikely to impair the fundamentally strong position of such issues |
| Aa | These bonds are judged to be of high quality by all standards. Together with the Aaa group they comprise what are generally known as high grade bonds. They are rated lower than the best bonds because margins of protection may not be as large as in Aaa securities or there may be other elements present which make the long-term risk appear somewhat larger than the Aaa securities |
| A | These bonds possess many favourable investment attributes and are considered as upper-medium-grade obligations. Factors giving security to principal and interest are considered adequate, but elements may be present which suggest a susceptibility to impairment some time in the future |
| Baa | These bonds are considered as medium-grade obligations (i.e. they are neither highly protected nor poorly secured). Interest payments and principal security appear adequate for the present but certain protective elements may be lacking or may be characteristically unreliable over any great length of time. Such bonds lack outstanding investment characteristics and in fact have speculative characteristics as well |
| Ba | These bonds are judged to have speculative elements; their future cannot be considered as well assured. Often the protection of interest and principal payments may be very moderate and thereby not well safeguarded during both good and bad times over the future. Uncertainty of position characterises bonds in this class |
| B | These bonds generally lack characteristics of the desirable investment. Assurance of interest and principal payments or of other terms of the contract over any long period of time may be small |
| Ca | These bonds are speculative in a high degree. Such issues are often in default or have other marked shortcomings |
| C | These bonds are the lowest rated class of bonds, and issues so rated can be regarded as having extremely poor prospects of ever attaining any real investment standing |
These ratings are in fact further refined, so that there are three classes of each rating, i.e. Aaa1, Aaa2, Aaa3, etc.
The affect of ratings on bond prices is that the lower the credit rating, the higher the coupon rate that the borrower will need to pay. If two bonds with an identical original maturity and coupon rate are issued by two borrowers with different credit ratings, then the market price of the bond issued by the borrower with the lower rating will have lower market prices than the bond issued with the higher credit rating.
1 EURIBOR (Euro Interbank Offered Rate) is the benchmark rate at which Euro Interbank term deposits within the Eurozone are offered by one prime bank to another prime bank. It is one of the two benchmarks for the money and capital markets in the Eurozone (the other one being Eonia). EURIBOR is sponsored by the European Banking Federation (FBE), which represents the interests of 3000 banks in the 25 member states of the European Union and in Iceland, Norway and Switzerland. Some of the other commonly used benchmark interest rates include LIBOR (London Interbank Offered Rate), TIBOR (Tokyo) and Federal Funds (USA).