
Assessment of durability and accelerated aging methodology of solar reflectors
F. Sutter*; A. Fernández-García†; J. Wette*; F. Wiesinger* * German Aerospace Center (DLR), Cologne, Germany
† CIEMAT-PSA, Almería, Spain
Abstract
The degradation of optical surfaces can be very cost-intensive. For example, an annual degradation rate of 0.3% (pp) in specular reflectance of the used reflectors in a 200 MWel power plant with an annual capacity factor of 40% may account for a loss up to 88 million US$ per year. Therefore the proper assessment of durability of key components is crucial to minimize the investment risk. This chapter gives an overview on the used standards for accelerated aging testing of solar reflectors. Analysis methods of degradation processes are described and a methodology to estimate the expected service life-time based on accelerated test results is presented.
Keywords
Durability; Accelerated aging; Outdoor exposure; Performance loss; Corrosion; Erosion; Optical performance
6.1 Introduction
Accelerated aging testing is used in several industries to estimate the lifetime of products and components. Manufacturers of solar materials and components usually test the durability of their products following standards from the automotive, photovoltaic, and building industries. The testing time and the “pass” or “fail” criteria are not well established for most products at the current state of the art. This makes it hard for customers to compare the expected durability of available products on the market.
In order to develop correlations between accelerated aging and outdoor exposure, a lot of research is required. Firstly, it needs to be confirmed that the accelerated aging test excites the same degradation mechanism as outdoors. For this reason, outdoor exposure testing is necessary to obtain reference data. The appearing degradation mechanisms between outdoors and under accelerated testing conditions shall be compared microscopically. Often, accelerated aging tests lead to unrealistic effects (e.g., glass corrosion due to extreme humidity, copper diffusion due to increased temperatures [1], unrealistic pitting corrosion in acid environments), which makes it impossible to derive useful correlations to outdoors. Once a suited accelerated aging test has been found, the rates of degradation growth outdoors and under accelerated conditions can be used to derive correlations. In order to obtain this data, several periodic measurements are required. It is recommended to measure outdoor tested solar materials exposed to the environment at 6-month intervals for 3–5 consecutive years or more, depending on the material and testing site. If prototypes are to be studied, more frequent analysis is useful as degradation may appear more quickly. If very durable products are to be tested, analysis at 1-year intervals is appropriate. The analysis intervals during accelerated testing will depend on the aggressiveness of each individual test.
Once the correlation has been validated through sufficient outdoor data, appropriate testing conditions can be defined. The correlation is only valid for the material type for which it has been originally derived. However, the general idea is that the derived accelerated aging conditions are used to estimate the lifetime of slightly modified products, e.g., by optimizing the manufacturing processes or modifying the chemical composition of the coatings. The testing conditions cannot be used to estimate the lifetime of a different material class which suffers from different degradation mechanisms. For example, concerning mirrors, three different accelerated aging testing procedures are being developed for silvered-glass, aluminum, and polymer-film mirrors.
This chapter focuses on the durability analysis and accelerated aging of solar reflectors. Research activity of other components such as evacuated receiver tubes (including their selective and antireflective coatings) or volumetric air receivers has been conducted over the last years and first preliminary guidelines have been established. Details on these components are described in Chapter 7 “New methods.”
The following terminology will be used in this chapter:
• degradation mechanism: physical and/or chemical processes that lead to a performance loss of the material;
• degradation rate: growth of degradation mechanism (amount of degradation mechanism over time);
• natural degradation mechanism: degradation mechanism caused by environmental stresses during outdoor exposure and human interference in operation (e.g., periodical maintenance, cleaning);
• accelerated degradation mechanism: degradation mechanism caused by climate simulation chambers in laboratory tests; and
• acceleration factor: ratio of accelerated to natural degradation rate.
6.2 Outdoor testing for yield of reference data
6.2.1 Sample exposure
General requirements for atmospheric corrosion testing can be found in ISO 8565:2011 [2] or DIN 55665:2007-01 [3].
The selected outdoor exposure sites should be representative for the operating conditions of the tested product, e.g., if the material is to be employed in a solar power plant located in the desert, the samples should be tested at a site which is representative for desert environments. When designing an outdoor exposure testing campaign, it is useful to cover a broad range of climates in order to quantify the influence of environmental parameters on the degradation processes. A typical outdoor exposure campaign for solar materials (non-irradiated) could cover:
• location at elevation with high levels of UV irradiation;
• location with high wind speeds and dust levels;
• location in industry surroundings (e.g., a coal plant, copper mine, etc.);
• coastal and humid climate;
• urban climate; and
• combinations of previous environments.
Usually it is sufficient to expose small material samples (e.g., 10×10 cm2), which can easily be shipped and measured. If samples are shipped, special care needs to be taken to avoid degradation due to handling. Each sample should be well cushioned and separated from the rest.
The samples are mounted on an exposure rack, which should allow easy mounting and unmounting of the samples and provide a secure attachment over the testing time of several years. Samples falling on the ground at some point during the exposure time are lost to the analysis.
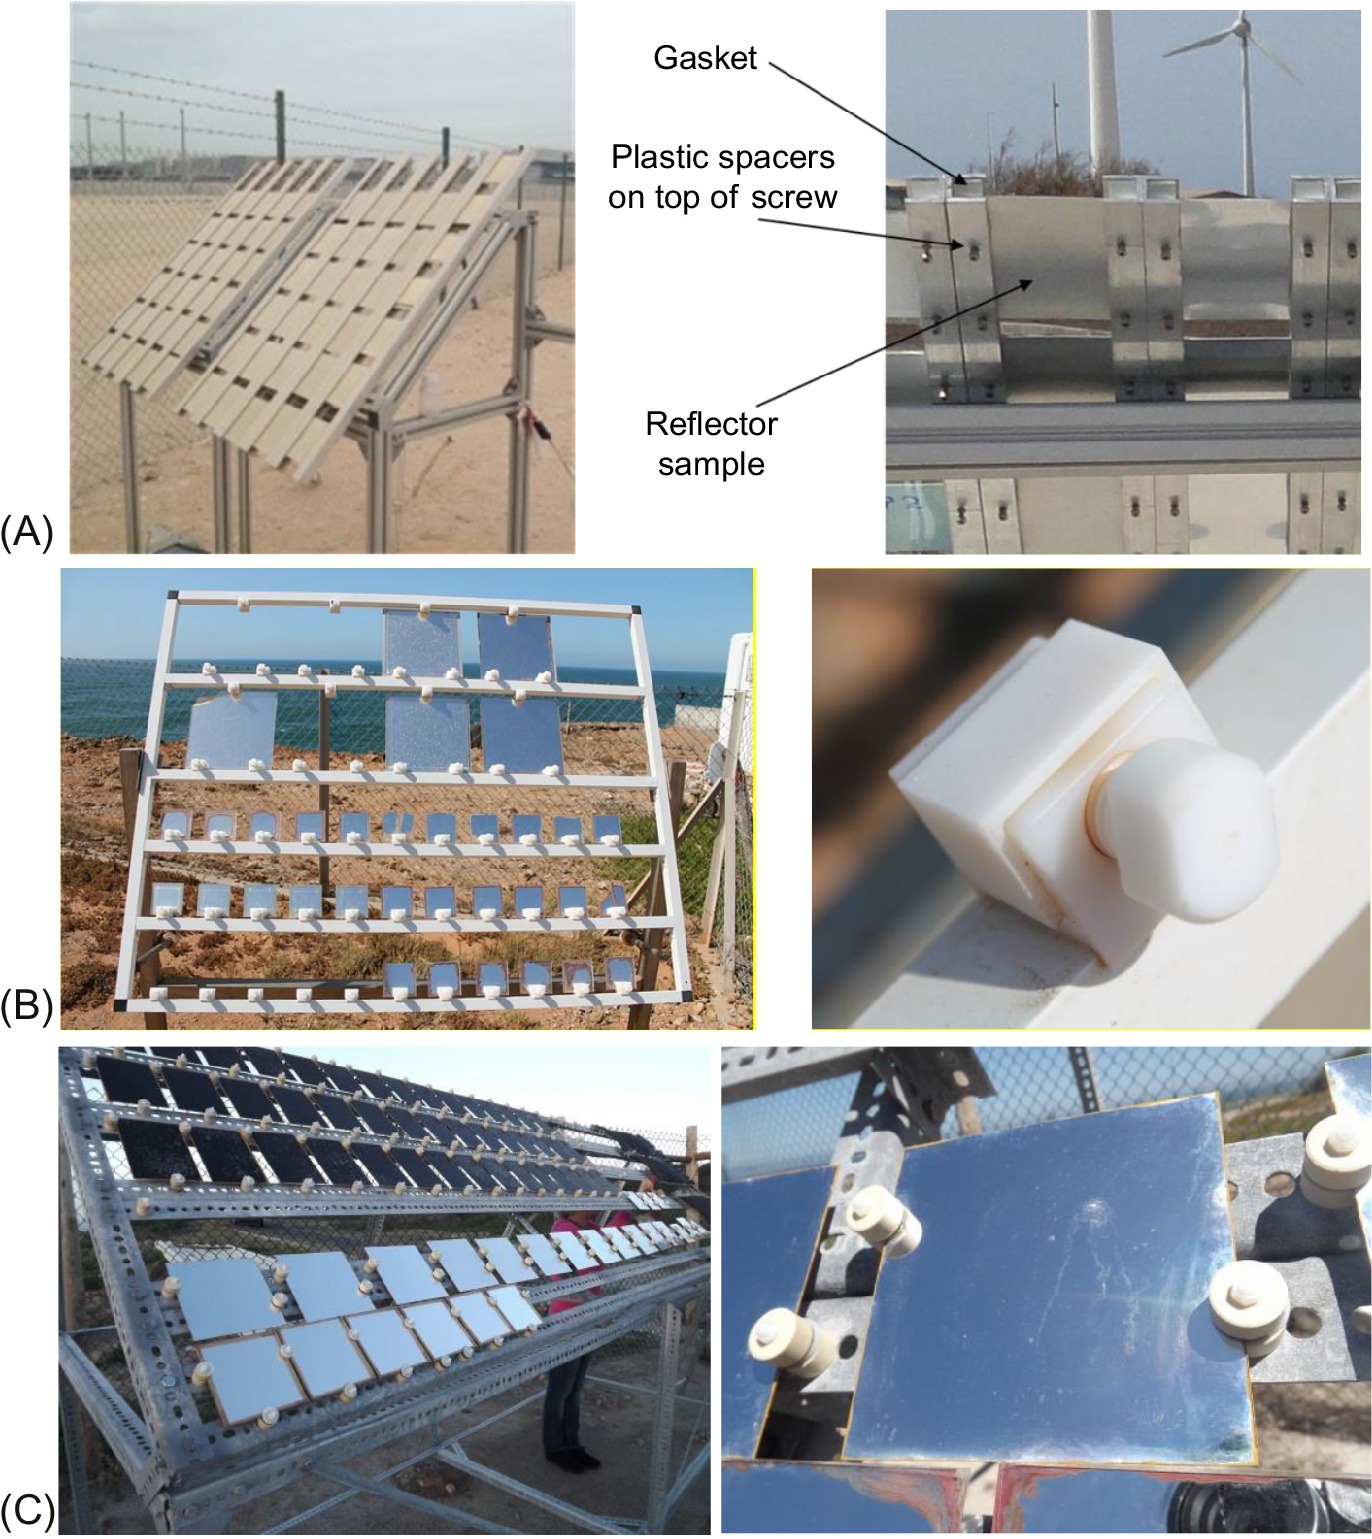
The sample rack should be oriented in a southern direction within the northern hemisphere, and in a northern direction in the southern hemisphere, to ensure the highest possible amount of solar irradiance on the front side of the sample. The rack should not be shadowed by surrounding obstacles or plants at any time of the year. The inclination angle should be 45 degrees. The material of the exposure rack should be corrosion resistant (aluminum or stainless steel), and special care should be taken to prevent eventual corrosion products from the exposure rack contaminating the samples. Rain or condensation water should not be retained by the sample holder as this will lead to increased corrosion on the sample. The sample should not be in direct contact with the supporting metal structure to prevent galvanic corrosion. Examples of different mounting systems can be found in Fig. 6.1, where plastic or ceramic holders are used to fix the samples.
6.2.2 Monitoring of climatic parameters
It is convenient to expose the samples near to meteorological stations to have information on the environmental stresses that act on the material (e.g., see Fig. 6.2B). In addition to the classically monitored parameters such as temperature, wind velocity and direction, relative humidity, rainfall, and solar irradiance (DNI, GHI, DHI), additional parameters such as atmospheric chlorides, windblown sand and dust particles, chemical composition of settled soil on the surface, amount of condensation, and concentration of environmental pollutants play an important role in the aging of the material.

Depending on the severity of the environmental stresses, the exposure site is classified in different corrosivity classes from 1 to 5 (1=insignificant corrosion, 5=very strong, and X=extreme) [4–7]. The corrosivity class of the exposure site can also be determined by exposure of reference materials (such as steel, aluminum, copper, or zinc) and evaluating their corrosion rates.
Atmospheric chlorides can be measured according to the wet candle method [8] (see Fig. 6.2A) in which a wet gauze is exposed to the environment and connected to a flask. After a certain exposure time, the gauze is rinsed with demineralized water. The rinsing water and the water in the flask are collected in a beaker. The chloride ion content of the beaker is then analyzed by titration of chloride with silver nitrate or by ion chromatography.
A variety of measurement equipment exists to characterize windblown dust or sand particles. Passive collection systems (“sand traps” or “sticky poles”) do not allow the dust concentration to be measured, but can be useful to analyze shape, particle diameter, or chemical composition of the particles microscopically. The dust concentration can be measured with optical or filter particle sensors (see Fig. 6.2C). These sensors contain a vacuum pump and monitor the volume of air sucked through the sensor head. The optical sensors determine the amount and size distribution of particles by measuring the scattered light in the airstream. The filter particle sensor stores the particles in the filter, so that the concentration can be determined by measuring the weight gain of the filter. Capturing the particles at different heights from the ground is recommended.
In order to evaluate the possible influence of corrosive gases on the degradation of the exposed mirror samples, it is also recommended to install gas detectors at the test sites. The most important feature to take into consideration when selecting the detection unit is the gases that are present in the specific location (due to the proximity to industrial areas or cities), as long as it is suspected that these gases could affect the mirror samples. Typical gases under consideration are SO2, NOx, CO, H2S, and Cl2. In addition, the detection range of each gas and the detection accuracy are crucial parameters which will determine the unit cost. These detectors are commonly installed in a cabinet sufficiently insulated from other environmental effects and should include a data acquisition system.
6.2.3 Analysis methods of degradation processes
6.2.3.1 Microscopic analysis
Light microscopy can be useful to get a general overview on the appearing degradation mechanisms. In the case of transparent coatings, the degradation on both the transparent top coating and the nontransparent coating underneath can be examined by moving the sample in z-direction towards the microscope objective. As Fig. 6.3 shows, the degradation on the glass surface and corrosion in the silver layer underneath can be made visible by adjusting the focus.

Confocal microscopy allows measuring the depth of pinholes in paint layers, pitting corrosion craters or erosion effects (see Fig. 6.3: glass erosion) by analyzing the obtained three-dimensional images.
Analysis with the scanning electron microscope (SEM) has the advantage of achieving a higher resolution compared to light microscopy. However, optically transparent coatings are not transparent to the scanning electron beam, therefore e.g., the silver layer underneath the glass cannot be examined unless a cross section of the sample is prepared. Special care must be taken when preparing cross sections through degraded areas to avoid additional damage due to the sample preparation tool. Glass samples may be prepared with a glass cutter and breaking them. With this method it is difficult to reach the area of interest where the degradation occurred (often only in the range of a few microns). The sample may then be polished carefully until a convenient cross section through the degradation area is reached (see Fig. 6.4).

A further improvement in resolution can be achieved with transmission electron microscopy (TEM), which typically has a resolution of <1 nm. This technique is suited to the analysis of materials with thin coatings in the nanometer scale (e.g., the physical vapor deposition (PVD) coating stack of enhanced aluminum reflectors, see Fig. 6.5). The thickness of the samples to be viewed in TEM need to be smaller than 100 nm and the preparation can be a complex procedure. Focused ion beam is a technique suited for sample preparation of aluminum reflectors, introducing much less additional degradation than other sample preparation methods like polishing.

SEM and TEM are often combined with energy-dispersive X-ray spectroscopy (EDX). It is possible to perform elemental analysis of the sample at a narrow spot of interest, along a line (line-scan), or by creating maps (EDX-mapping, see Fig. 6.6). This technique helps to identify the chemical composition of coating stacks or to detect eventual environmental contaminants. In Fig. 6.6, EDX-mapping is performed at the cross section of a local silver corrosion spot. It was identified that the remaining silver reacted to silver chloride and that the copper layer diffused into the prime coating.

6.2.3.2 Optical analysis
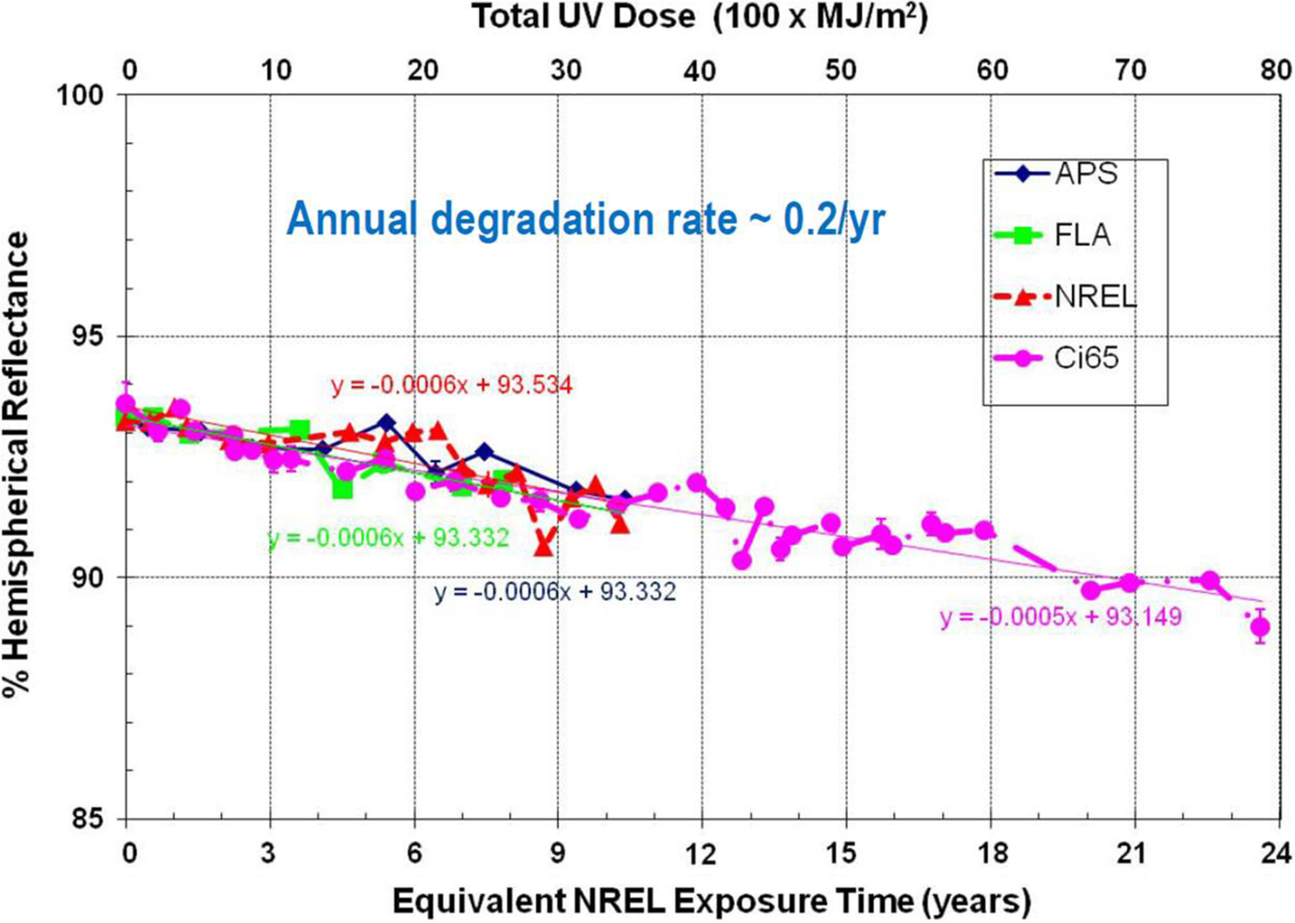
Optical analysis is performed to measure the actual performance loss (e.g., changes in reflectance for a solar mirror material) over the exposure time. The samples are periodically measured. The measurement frequency for outdoor exposed samples is typically 6 months. Fig. 6.7 shows the measured annual degradation rate in solar-weighted hemispherical reflectance △ρs(300–2500 nm, 8 degrees, h)=0.2%/year by NREL [11]. This parameter is usually measured with double beam spectrophotometers with an integrating sphere of diameter ≥150 mm.
In addition to hemispherical measurements, the specular reflectance shall be measured at defined acceptance angles in the range of φ=[3,20]mrad. Commercial reflectometers do not allow for spectral measurements at the current state of the art. Monochromatic measurements are performed at near-normal incidence (incidence angle θi≤15 degrees). Usually, the measurement spot is no larger than 10 mm in diameter. If possible, the measurements should be performed for several wavelengths. If measurements at larger incidence angles are to be taken, then the reflectance needs to be measured separately for s- and p-polarized light, and the final result consists of the average of both measurements. The most frequent incidence angles regarded over the timeframe of an entire year at parabolic trough and solar tower plants is between 30 and 40 degrees. Therefore, measurement at off-normal incident angles is encouraged.
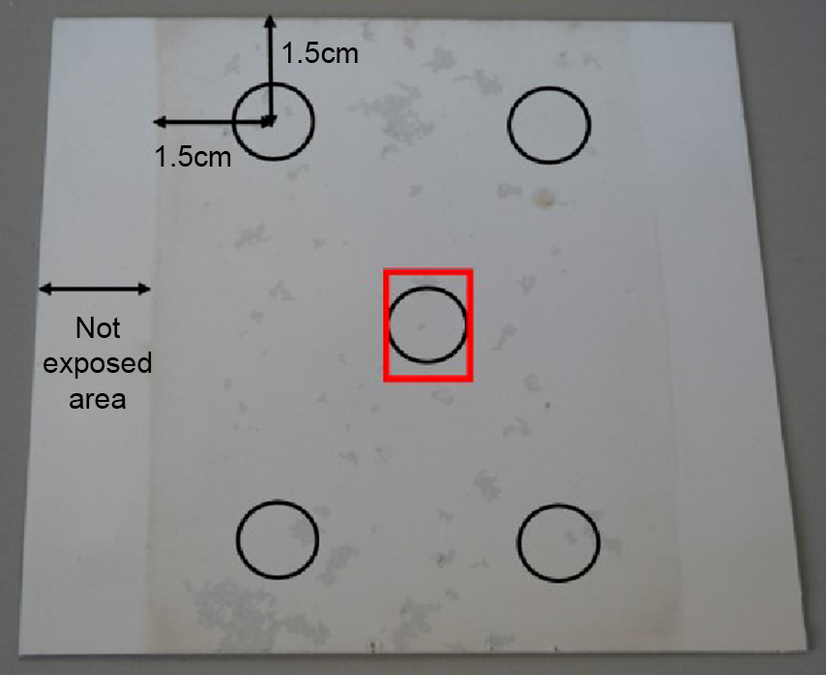
Especially when characterizing samples with localized degradation effects or inhomogeneous behavior across the surface (see Fig. 6.8), several measurements should be taken for statistical reasons. It is recommended to measure always at the exact same spots throughout the exposure test for proper monitoring of the optical properties. A mask, where the measurement position of the reflectometer is marked, can help to reallocate the correct measurement spot. The measurements should be taken with sufficient distance from the sample edge to prevent measuring edge degradation effects. It is recommended to take at least five specular and three hemispherical reflectance measurements on a 10×10 cm2 sample.
6.3 Standards for accelerated aging
6.3.1 Accelerated aging tests
The most widely used accelerated aging tests for materials used in concentrating solar power plants that are not exposed to the concentrated radiation are briefly described in the following paragraphs [12].
The tests are usually carried out on small samples (e.g., 10×10 cm2) due to size limitations of accelerated aging chambers or analysis equipment. However, it is still very important that the tested samples are representative of the actual manufacturing line. If possible, small pieces should be cut out of the final product from production. Some materials like silvered-glass or silvered-polymer film mirrors require edge sealing in operation. The tested sample should contain at least one original edge to study corrosion penetration from the edges. It is recommended to seal nonoriginal edges with proper edge tape or paint. If corrosion penetration from scratches or protective coating damage is to be analyzed, a suitable cutting tool should be used in order to generate well-defined scratches with reproducible geometry (e.g., ISO 4623, ISO 4628-8) [13,14].
6.3.1.1 Damp heat test IEC 62108 (10.7a, b), or IEC 61215 (10.13)
The damp heat test is used to test the resistance against penetration of humidity through the paint coatings at relatively high temperatures. There are two options to perform the test. In both cases, the samples are subjected to a constant climate of 85±5% relative humidity in a climatic chamber. In Test 10.7a, the operating temperature is 85±2°C and the testing time is 1000 h. Test 10.7b operates at a lower temperature of 65±2°C, but the testing time is higher (2000 h) [15]. Test 10.7a is similar to Test 10.13 from IEC 61215 [16].
6.3.1.2 Condensation test ISO 6270-2
The resistance to condensation water is tested by exposing the samples to constant conditions of 40±3°C with 100% relative humidity provoking condensation on the sample surface [17]. Several climatic chambers are available on the market to perform this test.
6.3.1.3 UV and humidity test ISO 16474-3
The UV and humidity test according to the standard ISO 16474-3 [18] replaces the previously commonly used ISO 11507. It consists of the following cycle: in the beginning, samples are exposed during 4 h at 60±3°C to UV-radiation in a specific testing chamber (see Fig. 6.9A). For solar reflectors, the lamp type 1A (UVA-340) is recommended. It emits radiation in the wavelength-range of 290–400 nm with a peak emission at 340 nm. The lamp intensity at 340 nm is 0.83 W/m2/nm. The total intensity in the entire lamp spectrum of 290–400 nm is around 45 W/m2. Fig. 6.10 shows a typical spectrum of the UVA-340 lamp compared to daylight solar spectral irradiance according to Ref. [20]. After the radiation phase of 4 h, the samples are exposed during 4 h at 50±3°C to condensation (100% relative humidity without irradiation). The total duration of one cycle is 8 h (see Fig. 6.9B). For second surface mirrors with protective lacquers from the back side (such as silvered-glass mirrors), it is recommended to expose both the front and back side of the sample towards the interior of the testing chamber, beginning with the exposure of the glass side towards the UV-lamps for at least 1000 h, and then turning the sample around to the back side for at least 1000 h, meaning the total testing time in this case is at least 2000 h. First surface mirrors (such as silvered-polymer films or aluminum reflectors) should only be tested with the front side facing the interior of the chamber, since the backside will be protected in operation by a substrate material. The commonly performed testing time is at least 1000 h.


6.3.1.4 Neutral salt spray (NSS) test ISO 9227
The NSS test is a widely used corrosion test to simulate coastal environments. Samples are exposed to constant conditions of 35±2°C with a spray of a NaCl solution (50±5 g/L, pH 6.5–7.2) at 100% humidity. The samples should be positioned with a tilt angle of 20±5 degrees respect to the vertical within the salt spray chamber (see Fig. 6.11). The amount of the sprayed solution should be adjusted to obtain a condensation rate of 1.5±0.5 mL/h on a surface of 80 cm2 [21]. The condensation rates should be checked at various locations within the chamber to ensure homogeneous distribution of the salt fog. A circular chamber design usually leads to higher reproducibility of test results of samples tested in different positions within the chamber.

6.3.1.5 Copper accelerated salt spray (CASS) test ISO 9227
Further acceleration compared to NSS can be achieved with the CASS test. Samples are exposed to 50±2°C and 100% relative humidity with a constant spray of demineralized water containing 50±5 g/L NaCl. Additionally, the solution contains 0.26±0.02 g/L of copper chloride (CuCl2). The pH of the sprayed solution lies between 3.1 and 3.3, and is adjusted using hydrochloric acid (HCl), sodium hydroxide (NaOH), or sodium bicarbonate (NaHCO3) [21]. The salt spray chamber can be used for both NSS and CASS. However, once a CASS test has been performed within the chamber, it is not recommended to perform later NSS experiments due to the chemical contamination of the chamber interior, as this will lead to modified test results. The commonly performed testing time is 120 h.
6.3.1.6 Kesternich test DIN 50018 or ISO 6988
The Kesternich test is used to simulate aggressive industrially polluted environments. During the first 8 h of this cyclic test, the samples are exposed in a climatic chamber to 40±3°C and 100% relative humidity. Additionally, in the DIN 50018 [22] standard, 0.33% or 0.67% of the volume of the testing chamber is charged with sulfur dioxide gas (SO2). During the following dry phase of 16 h, the samples are exposed to the ambient conditions of temperature and humidity. The duration of one cycle is 24 h (see Fig. 6.12). The testing conditions in ISO 6988 [23] are identical, except that the sulfur dioxide gas concentration is reduced to 0.067% of the volume of the testing chamber.

6.3.1.7 Thermal cycling test IEC 61215 (10.11) or IEC 62108 (10.6)
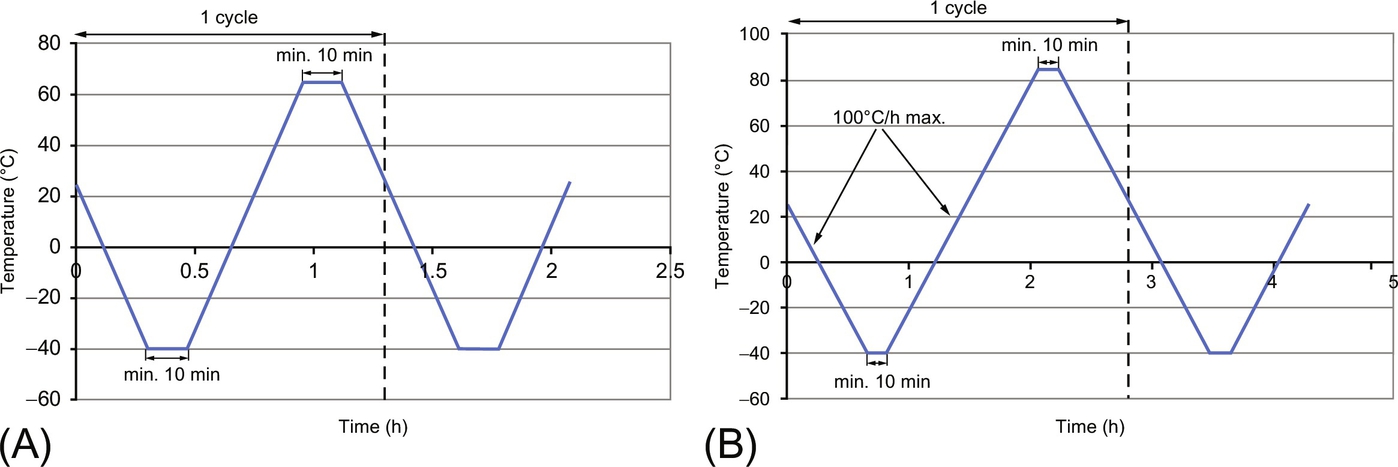
The resistance to formation of cracks or delamination due to thermal influence is tested with thermal cycling tests. In IEC 62108, Test 10.6 (Option TCA 3) [15], the samples are subjected to 2000 cycles from −40°C to 65°C. A dwell time of at least 10 min within ±3°C of the high and low temperatures is required (see Fig. 6.13A) [15]. The procedure defined in IEC 62108, Test 10.6 (Option TCA 1) works in the exact same manner, but the maximum temperature is increased up to 85°C (see Fig. 6.13B). The number of cycles is 1000. The thermal cycling test defined in IEC 61215, Test 10.11 is identical to IEC 62108 Test 10.6 (Option TCA 1), but the cycle number is reduced to 200 cycles [16] and the heating and cooling rates are limited to a maximum of 100°C/h. The cycling frequency in IEC 62108 is defined between 10 and 18 cycles per day.
6.3.1.8 Combined thermal cycling and humidity test
The following test combines thermal cycling and exposure to humidity. This seems reasonable because gradually cracks appearing in the paint system due to different thermal expansion coefficients of the layers will allow the penetration of humidity during the condensation phase and eventually lead to corrosion. The test is currently under standardization in the Spanish AENOR (AEN/CTN 206/SC 117/GT 2 “Components of solar thermal plants”) standardization committee [24]. The test consists of a 4-h phase at 85°C, followed by 4 h at −40°C. Three options are possible to perform the following humidity cycle. Method A defines the same conditions as in to ISO 6270-2, with 40°C and 97±3% relative humidity (see Section 6.3.1.2, Fig. 6.14). Method B consists of the damp heat test (see Section 6.3.1.1), for which two options are given: either at 85°C or at 65°C with increased exposure time of 40 h. Tables 6.1–6.3 summarize the operating conditions of this test.

Table 6.1
Method A
| Step | Duration (h) | Temperature (°C) | Relative humidity (%) |
| 1 | 4 | 85 | Not controlled |
| 2 | 4 | −40 | Not controlled |
| 3 | 16 | 40 | 97±3 |


6.3.1.9 Humidity freeze test IEC 62108 (10.8)
A similar test to the one described in Section 6.3.1.8 is the humidity freeze test. It is used to check the coating resistance to formation of cracks or delamination due to thermal influence in combination with humidity. In difference to the previously described test, the humidity freeze is performed in two steps. At first, the samples are subjected to 400 cycles from −40°C to 65°C. A dwell time of at least 10 min within ±3°C of the high and low temperatures is required (see Fig. 6.15A and Section 6.3.1.7). In the second step, the samples are subjected 40 times to the humidity freeze cycle shown in Fig. 6.15B [15]. The total duration of the test is approximately 1500 h.

6.3.1.10 Abrasion and erosion tests
We differentiate between abrasion effects, caused by occasional contact with other media such as pressurized water or brushes for cleaning, and erosion effects, caused naturally by the environment, e.g., by windblown particles.
Several standards are used to test the abrasion resistance of paints and varnishes. For example, ISO 11998 defines a procedure to determine the wet-scrub resistance and cleanability of coatings [25]. Alternative accelerated abrasion tests involve testing with the Taber Abrasor scrub resistance tester or a similar device, according to ISO 9211-4, in which the surface is exposed to repetitive wiping with a defined abrader [26]. The normal force of the abrader on the sample can be controlled and modified, which leads to more reproducible results compared to other abrasion tests.
MIL-STD-810G defines a dust and sand test to determine the resistance against particle erosion in desert regions [27]. Such tests need to be carried out in elaborated sandstorm-simulating chambers able to control wind velocities and particle concentrations. The tests defined in MIL-STD-810G and also in other available standards like ASTM-D968-05 or ASTM-F1864-05 are too aggressive for reflective materials and are not suited for CSP applications [28,29]. Advanced standards with modified testing conditions are required.
Recent preliminary analysis has identified that more reasonable parameters to simulate the effect of sandstorms can be as follows: Arizona test dust according to ISO 12103-1 A4 coarse with a particle diameter range of 1–180 μm [30], constant wind velocity of 12.5 m/s, normal impact angle, constant particle concentration of 100 mg/m3, testing time of 10 min. Five cycles can be performed, while the changes of the optical properties should be measured after each cycle. Those parameters have been selected based on the available meteorological data at Moroccan desert sites. The research on how to correlate these parameters with different outdoor exposure sites is still ongoing (see Section 6.4.3).
A simpler sand erosion test is defined in DIN 52348 [31]. It consists of a sand trickling method, where particles acted by gravity from a height of 1.65 m impinge on a rotating sample. This method achieves small impact velocities (2.5–4.0 m/s) and uses larger particles (0.5–0.71 mm). Therefore this test reproduces the natural effects only to a certain extent. However it is easy to perform and highly reproducible, and for this reason it is useful to compare the erosion resistance of different materials.
6.3.1.11 Corrosive gases tests
Some gases present in the ambient as trace substances may promote and accelerate the corrosion process of most metallic materials. The main gases that have been pointed out as corrosive pollutants are chlorides, sulfates, nitrates, and hydroxides. These substances are detected with noteworthy concentrations in the ambient at those areas close to industries and cities. Several tests may be conducted to simulate and enhance the influence of corrosion-promoting gases:
• ISO 21207 [32] is an accelerated corrosion test used in assessing the corrosion resistance of products with metals (e.g., electronic components) in environments where there is a significant influence of chloride ions and of corrosion promoting gases from industrial or traffic air pollution. The test involves alternate exposure to NO2 and SO2 at 95±3% RH and 25±1°C, and neutral salt spray test, according to ISO 9227. Method A simulates moderately aggressive traffic, while Method B simulates a more severe traffic or industrial environment.
• ISO 10062 [33] is intended to determine the influence of one or more pollutant gases at very low concentrations on metals and alloys with and without protection against corrosion, under specific conditions of temperature and humidity. Six different test methods are covered, in which two temperature and humidity levels (which could be 40±1°C/80±5% RH or 25±1°C/75±3% RH) and several combinations of NO2, SO2, Cl2, and H2S are possible.
• EN 60068-2-42 [34] is a test of SO2 for contacts and connections or for precious metal compounds, excluding silver. The test is done under 25±2°C/75±5% RH, with 25 ppm of SO2.
• EN 60068-2-43 [35] is similar to the previous test, but with H2S as the promoting corrosion gas. The goal is to check the effect of the gas on silver and silver alloys used in contacts and connections. The test is done under 25±2°C/75±5% RH, with 10–15 ppm of H2S.
• EN 60068-2-60 [36] is a corrosion test to determine the influence of corrosive ambient on electrotechnical components, devices, and materials. Four methods are possible, combining temperature (25±1°C or 30±1°C) and humidity (70±3°C or 75±3 RH) and different gases mixtures among NO2, SO2, Cl2, and H2S.
6.3.1.12 Testing programs
Usually several samples of the same material type (and preferably of the same manufacturing batch) are tested simultaneously in accelerated aging testing programs to check their stability against a variety of possible environmental stresses. Table 6.4 shows a “basic” testing program, which can be used for initial screening of a material's durability. The basic program is a list of minimum requirements that the material needs to withstand for potential use outdoors. Solar mirrors, regardless of their type, should not show degradation effects larger than 200 μm and reflectance losses in any test of the basic program.
Table 6.4
Basic and advanced accelerated aging testing program
| Test | Standard | Testing conditions | “Basic” program | “Advanced” program |
| Neutral salt spray (NSS) | ISO 9227 | T: 35±2°C pH: 6.5–7.2 at 25°C | 480 h | 3000 h |
| Copper accelerated acetic acid salt spray (CASS) | ISO 9227 | T: 50±2°C pH: 3.1–3.3 at 25°C | 120 h | 480 h |
| Condensation | ISO 6270-2 | T: 40±3°C RH: 100% | 480 h | 1000 h |
| Combined thermal cycling and humidity test | AENOR draft | 4 h 85°C, 4 h −40°C, Method A: 16 h T: 40°C and 97±3% RH | 10 cycles (240 h) | 20 cycles (480 h) |
| UV radiation exposure | ISO 16474-3 | 4 h UV exposure at 60±3°C; 4 h 100% RH at 50±3°C | 1000 h (for second surface: 1000 h on both sides) | |
| Thermal cycling | IEC 62108 (Test 10.6 TCA3) | T: 65°C to −40°C | – | 150 cycles (~280 h) |
| Damp heat | IEC 62108 (Test 10.7b) | T: 65±2°C RH=85±5% | – | 2000 h |
| Combined thermal cycling and damp heat | IEC 62108 (Test 10.6 TCA3+Test 10.7b) | First step: thermal cycling as above, second step: damp heat test | – | 150 cycles+2000 h |
| Combined thermal cycling and NSS | IEC 62108 (Test 10.6 TCA3)+ISO 9227 | First step: thermal cycling as above, second step: NSS | – | 150 cycles+3000 h |
| Kesternich test | DIN 50018 | 8 h: 0.33–0.67% (V/V) SO2, 40±3°C, 100% RH 16 h: RT | – | 50 cycles (1200 h) |
| Sand erosion test | Test dust ISO 12103-1 A4 coarse | v=12.5 m/s, c=100 mg/m3 | – | 4 cycles (10, 20, 40, and 60 min) |

c, concentration; RH, relative humidity; RT, room temperature; T, temperature; v, velocity.
The “advanced” testing program consists of similar tests, with the difference that the testing times are highly increased. The total duration of this testing campaign including sample analysis is up to 7 months. The main purpose of the advanced testing program is to compare different materials under different stresses, e.g., by evaluating which of the tested materials fails first under certain conditions.
6.3.2 Sample analysis
The samples should be analyzed with the same techniques as outdoor exposed samples as described in Section 6.2.3. It is useful to perform intermediate measurements (e.g., every 500 h), especially during the long-term accelerated aging tests, to monitor the evolution of the degradation and to derive the degradation rate (see Fig. 6.16).

The parameters to be reported after an accelerated aging test of solar reflectors should be:
• the solar-weighted hemispherical reflectance ρs (300–2500 nm, 8 degrees, h);
• the near normal specular reflectance at least at one wavelength in the visible range with an acceptance angle ≤12.5 mrad, e.g., ρλ (660 nm,15 degrees,12.5 mrad);
• the near normal hemispherical reflectance at the same wavelength as above for comparison, e.g., ρλ (660 nm, 8 degrees, h);
• a graph of the hemispherical spectrum in the wavelength range 300–2500 nm;
• type, number, and size of damage appearing on the protective layers or glass side including delamination, peeling, bubbles, discontinuities, discoloration, glass corrosion, etc.;
• edge corrosion length of edges (protected edges and eventually nonprotected edges); and
• density of degradation spots in the reflective surface with a diameter larger than 200 μm.
All reflectance values shall be reported before and after the aging test, including standard deviation of the measurements. In addition, a photograph of the sample after completion of the accelerated aging test and microscopic images of the appearing defects should be included (Fig. 6.17).

6.4 Correlating accelerated aging tests with outdoor tests
6.4.1 Methodology
Correlating accelerated aging tests with outdoor exposure permits to derive service life time estimations and to optimize materials to certain outdoor environments. Fig. 6.18 shows a possible methodology to derive an accelerated testing sequence that correlates with outdoor exposure.
Reference data of outdoor exposed samples of at least 3 years is required to be able to detect degradation tendencies. For durable material candidates (e.g., silvered glass mirrors) longer outdoor exposure periods are necessary (at least 5 years). The outdoor exposed samples need to be inspected microscopically to detect the appearing degradation mechanisms. Several independent mechanisms may appear (e.g., for aluminum mirrors, five different mechanisms were detected as described in the next section). The severity of degradation needs to be quantified, which may require different techniques. In addition to the analysis methods described in Section 6.2.3, digital image analysis tools can be useful to automatically count localized corrosion spots.
In parallel to outdoor exposure, samples from the same material type (and preferably also from the same manufacturing batch) are tested empirically in the described accelerated aging tests from Section 6.3.1. The degradation caused by the accelerated test is monitored at different points of time. The accelerated degradation mechanism is compared to the natural degradation mechanisms. If the mechanisms do not match, a different accelerated aging test needs to be chosen or the testing conditions need to be modified.
Sometimes, an accelerated aging test may excite several natural mechanisms at the same time. Preferably, accelerated aging tests which excite only one single natural mechanism should be selected. The reproduction of the distinct natural mechanisms is achieved by testing the same sample subsequently in a selected set of accelerated tests, in which each test is carried out for the necessary amount of time to excite one mechanism. If no test conditions can be found to simulate each mechanism independently, the test cannot be used to simulate a certain outdoor exposure time, unless the excited mechanisms happen to have the same acceleration factor. In practical applications, humidity tests often excite several corrosion processes (e.g., filiform corrosion and pitting corrosion) which makes it difficult to derive useful correlations. However, if the acceleration factors of the accelerated mechanisms are in the same order of magnitude, the test may still be used to derive approximate estimations, which still represents a significant improvement compared to the state of the art.
The correlation itself is derived by measuring time series of parameters which describe the degradation mechanism under investigation. For example, if pitting corrosion is examined, the number, diameter, and depth of the pits can be measured outdoors and related to the growth under accelerated aging.
The finally derived testing sequence ideally reproduces all natural degradation mechanisms by combining different accelerated aging tests. To reproduce e.g., 10 years outdoors at the reference site, the derived correlations of the individual degradation mechanism are used to determine the required accelerated testing times. Sequential testing may alter the derived correlations due to pre-aging of the samples, e.g., if an erosion test is carried out before a corrosion test, the corrosion rate will be significantly increased due to the coating defects. This needs to be taken into account and the correlations need to be updated if there is an influence of the pre-aging.
6.4.2 Exemplary results: Accelerated aging methodology for aluminum reflectors
The described methodology in the previous section is illustrated with the example of aluminum reflectors. An extensive outdoor exposure testing campaign has been conducted over 3 years at nine exposure sites (including coastal, desertic, and sandstorm environments) with nine differently coated aluminum reflector types. The detected five natural degradation mechanisms are as follows [37]:
• Pitting corrosion: only present at coastal regions, with typical diameters of around 200 μm and depths up to 70 μm after 3 years of exposure.
• Top coating erosion: present at two desertic sites, of which one exhibits severe signs of erosion. The erosion is caused by windblown sand and dust particles (the samples have not been contact-cleaned during exposure).
• PVD-layer corrosion: present at all sites, especially at coastal and desertic sites where the top coating has been damaged due to sandstorms. The aluminum layer underneath the protective coating suffers from corrosion, starting at coating damages.
• Micropitting of PVD-layer: present at all sites, with higher intensity at sites of high humidity. Diffusing humidity through the protective layer causes microscopically small pinholes of <1 μm in diameter.
• Deposits: present at all sites. Local dust particles stick to the protective coating and cannot be removed using conventional cleaning methods.
A high number of accelerated testing conditions have been examined and the most suited tests to reproduce the individual natural degradation mechanisms have been selected based on a microscopic analysis (see Fig. 6.19).

For each of the five mechanisms, a correlation between the selected accelerated aging test and reference outdoor exposure sites was developed except for the degradation through surface deposits. It is considered that this degradation mechanism would not happen in power plant operation because the surface will be cleaned regularly, while during the outdoor exposure campaign, the surface has not been cleaned at all.
To establish a correlation for the pitting corrosion mechanism, the CASS test (see Section 6.3.1.5) was conducted for the different materials. The defect density was analyzed under accelerated aging as well as for the coastal outdoor sites. The data for two sites compared to the CASS test can be seen in Fig. 6.20. Two different time-axes were chosen because of the strong difference in the duration outdoors compared to CASS. Supposing a linear development of the pitting density, δ, the corresponding trend lines can be calculated. The pitting density for each experiment is then
with k being the pitting velocity. The acceleration factor, a, for the laboratory tests compared to the outdoor exposure is then
The testing time to simulate a certain outdoor exposure duration is
The resulting average acceleration factor for the CASS test to simulate the pitting is ![]() , which means a test duration of around 98 h corresponds to a exposure of 3 years at a coastal site.
, which means a test duration of around 98 h corresponds to a exposure of 3 years at a coastal site.
The correlation for the sand trickling test (see Section 6.3.1.10) to simulate the top coating erosion is based on tests with different amounts of sand and the analysis of the defect density for outdoor and laboratory testing. In Fig. 6.21, the defect size distribution for the exposure site Zagora, Morocco is compared to a test with 100 and 400 g of sand, respectively. It was found that the use of 100 g of sand corresponds to an exposure of 20 months on the site. Again, a linear development of the defect density was supposed and thus the sand mass that has to be used to simulate outdoor exposure of a specified duration can be calculated according to

with am being the acceleration factor regarding the employed sand mass. The exposure of 3 years can be simulated with 180 g of sand in this case.
The reproduction of the PVD layer corrosion is achieved by a combination of the aforementioned sand trickling method followed by a short-term CASS test. The correlations are based on the analysis of a test with 100 g of sand followed by CASS. The corroded area was determined by the analysis of microscope pictures in the cases of minor degradation and with a spatially resolved reflectometer in the case of stronger degradation. The percentage of corroded area for the accelerated test and two outdoor sites over time is displayed in Fig. 6.22. Equivalent to the pitting mechanisms, acceleration factors have been determined for the three outdoor site types: aexdesert=6260; adesert=2200; and acostal=2200. To reproduce 3 years outdoors at the extreme desert site, a CASS duration of 4 h is needed, and for the desert and coastal sites 12 h in the CASS are necessary.

The micropitting is reproduced by the UV/humidity test (see Section 6.3.1.3). In this case the defect density stabilizes after a relatively short time both for the laboratory and the outdoor testing (see Fig. 6.23). The stabilization is reached after less than 6 months at all outdoor sites. In the accelerated test, 480 h are enough to reach the stabilization.

Based on the individual correlations, a four-step testing sequence has been defined. It consists of the CASS test in the first step to reproduce pitting corrosion at coastal sites. In the second step, the sand trickling method according to DIN52348 is carried out to simulate protective coating damage due to sand erosion. In the third step, the CASS test is carried out again. After the protective coating has been damaged, the CASS test will now quickly reproduce the PVD-layer corrosion. In the last step, the UV/humidity test is carried out until the micropitting reaches a stabilization state. The parameters for the final sequence are adapted to take into account the serial execution of four tests instead of just one, and considering practical durations for every day laboratory use. For example, the durations of the second CASS test were lowered to 2 and 8 h, respectively, to simulate 3 years of exposure, because it was detected that the degradation in the sequential test procedure was stronger than expected from the outdoor values.
Table 6.5 shows the derived testing parameters to correlate the accelerated testing sequence to three outdoor reference sites after 3 and 10 years of exposure [38].
Table 6.5
Accelerated aging testing sequence for aluminum mirrors, correlated to three outdoor reference scenarios
| Simulated years | CASS ISO9227 Time (h) | Sand trickling test DIN52348 Sand mass (g) | CASS ISO9227 Time (h) | UV/humidity ISO16474-3 Time (h) | |
| Extreme desert | 3 | – | 180 | 2 | 480 |
| 10 | – | 600 | 8 | 480 | |
| Desert | 3 | – | 5 | 8 | 480 |
| 10 | – | 15 | 24 | 480 | |
| Coastal | 3 | 96 | 5 | 8 | 480 |
| 10 | 312 | 15 | 24 | 480 |

6.4.3 Exemplary results: Accelerated erosion testing
In order to develop a representative accelerated erosion test, parameters like wind velocity and airborne particle properties need to be considered. For the development of correlations between outdoor exposure and accelerated sand erosion chambers, it is necessary to gather field data about sandstorms. The following sections describe available field data and accelerated erosion setups to simulate outdoor exposure.
6.4.3.1 Field data about sandstorms
Sandstorms and duststorms should be distinguished as two separate categories. This differentiation is connected to the size of the particles involved in the event. The term dust storm is usually related to winds carrying huge quantities of loose soil and dust particles (dmean<10 μm) to air layers some hundred meters high above the ground. The visibility can be reduced below 100 m and the particles can travel more than 1000 km [39,40].
Sandstorms, on the other hand, contain particles bigger than 10 μm that move in a low-flying cloud with a clearly marked upper surface usually not higher than 2 m above the ground [41]. Since neither phenomenon occurs exclusively, in the following text the term sandstorm addresses wind-blown particles in the air.
Aeolian particles can lead to serious effects on health, traffic, and communication systems. Furthermore, negative influences on the agriculture due to soil loss, coverage of important structures with significant amounts of sand, and the mechanical erosion of constructions are the consequence. For more details and examples on the natural and socioeconomic effects of these weather phenomena, see Refs. [39,42–45].
As stated in Ref. [46], sandstorms are expected to increase in number and severity over the next decades. Therefore there is a growing demand to understand the cause and the characteristics of such events. Especially for CSP plant operators, the early detection of sandstorm events and possible protection from them is a critical factor to assure the efficient plant performance over a lifetime range of 20–25 years [47]. Erosion-sensitive CSP components are in particular optical parts that play a role in the solar concentration process, e.g., absorber tubes and reflectors. However, the standards available are not suited to predict the optical degradation of these components during such natural events. One reason for the so far unsuccessful simulation in the laboratory is the insufficient data about physical parameters during natural sandstorms. The wind velocity v, the sand concentration c, and the sand properties (particle size distribution (PSD), particle hardness, and roundness) during these events are crucial factors [48].
There are many works dealing with the topic of sandstorms from various regions in the world with most of them from China, being a country severely plagued by desertification. From the literature review it is quite obvious that sandstorms exhibit very different behavior in the various arid or semiarid areas of the world (see Table 6.6).
Table 6.6
Measured sandstorm parameters at various sites around the world
| Location | References | Maximum particle concentration c (mg/m3) | Mean particle diameter dmean (μm) | Maximum wind velocity v (m/s) | Duration t (h) |
| Sahel/West Africa | [49] | 13.7 | 3 | 5.3 | 3.5 |
| Minquin/China | [50] | 104.5 | – | 8.9 | – |
| Zagora/Morocco | [51] | 300 | <200 | 11 | – |
| Big Spring/Texas (United States) | [52] | 1300 | 40 | 13 | 4 |
| Mangyshlak/Kazakhstan | [53] | 40 | 10–250 | 11 | – |
| Khartoum/Sudan | [40,54] | <40 | 10–50 | 9 | 6.5 max |
| Syracuse/Kansas (United States) | [55] | 1327.4 | 50 | 11.5 | – |
| Gansu/China | [46] | 1016 | – | 34 | 2 days |
| Kuwait | [56] | 9.6 | – | 11 | 4 |

To achieve a realistic erosion simulation of the components of a CSP plant, a field campaign at the specific site of the plant is recommended. The wind velocity at respective heights above the floor is the least problematic parameter to determine.
Furthermore, studies carried out by Schütz and Jaenicke [57] and d'Almeida and Schütz [58] demonstrate that the particle properties of Aeolian sand and the sand samples taken from the soil exhibit very coinciding characteristics. However, the direct sampling of wind-blown sand is necessary to determine reliably the sand concentration at a certain height. Most commonly, passive sand traps like the big spring number eight—BSNE—(see Fig. 6.24A), a rotating wedge-shaped chamber developed by Fryrear in 1986 [48], are used. They have a major disadvantage in that no in situ values can be acquired and their sampling efficiency is not always known at the distinct outdoor conditions. The sampling efficiency is a value that stands for the percentage of particles that are actually collected within the sampler opening area/volume. For passive systems, this value is highly dependent on wind velocities and particle characteristics.

Therefore it is advisable to use an active dust sampler. These devices are equipped with a high-volume pump and sample a precise air volume. The suspended particles are stored on filter disks that can be evaluated later on in the laboratory in terms of their above-mentioned properties. A general construction scheme is shown in Fig. 6.24B (see also Fig. 6.2C). With these devices it is possible to record only specific time intervals of interest. By changing the sample heads properties, e.g., by applying a PM10 filter head, it is possible to collect particles up to a certain diameter only. Additionally, the defined blower volume flow allows the deducing of the mean concentration of particles in the air during the event.
The sand collected with active or passive samplers needs to be investigated in the laboratory in terms of its above-mentioned properties.
6.4.3.2 Accelerated erosion setups for laboratory experiments
Having acquired all the important parameters by field measurements, the natural erosion process can be simulated under controlled laboratory conditions. The current state-of-the-art approaches can be subdivided into three different methods:
• sand blasting or open loop wind tunnel [61,62]; and
• closed loop wind tunnel [63].
Each one offers advantages and disadvantages. The trickling setup is quite easy to operate, but is limited in the applied particle velocity, since the test sand is only accelerated due to the force of gravitation. While the sand trickling and open loop wind tunnel setups facilitate very good control mechanisms in terms of particle concentration, the closed loop wind tunnel does not consume that much test sand material. Yet, since no standard is developed, research is going on with all these three devices. The overall results from literature review in this topic are as follows:
• The loss of specular reflectivity increases with the wind velocity [62,63].
• Longer test times or higher sand concentrations lead to a linear increase in reflectance loss [59,60,64].
• Larger grain sizes and harder sands also promote the erosion severity [61].
Furthermore, to give a clearer impression on the effects on mirrors and the capability of erosion setups already in operation mode, an aluminum reflector is shown in Fig. 6.25 after natural and artificial erosion. The sand trickling test has been stopped when the same reflectivity decrease of the mirror as in the outdoor sample was reached. In the microscope images at the bottom of Fig. 6.25, it can be observed that the PSD of the laboratory tests does not completely correspond to the outdoor distribution (see also Fig. 6.21). However, the reflectance decrease due to particle erosion during 20 months of outdoor aging could be simulated by a laboratory treatment that only lasted some seconds. Additionally, focusing on the damage of one large particle in both outdoor and laboratory tests (see Fig. 6.25 top), similar damage is seen.

In order to improve the achieved erosion pattern towards a more realistic appearance, further research is being carried out. One approach is to combine different erosion tests in a testing sequence. For example, as a first step, the sample could be tested in the closed or open loop wind tunnel. Here small particles in combination with high wind velocities reproduce the numerous small impacts detected outdoors. In a second step, the same sample could be tested using the sand trickling method to reproduce the larger impacts.
Additional research activities are accelerated erosion testing with different sand types and further field data acquisition of real sandstorm events. An accelerated erosion guideline to simulate relevant North African exposure sites is expected to be published in 2017.
6.5 Summary and outlook
This chapter described standards and methods for accelerated aging testing and degradation analysis techniques for solar reflector materials. Most of the accelerated aging testing conditions were arbitrarily chosen or have been adapted from other industries. Testing programs, which cover a wide range of environmental stresses, have been established with the aim to provide a defined tool to compare different materials among each other. However, the accelerated tests often lead to unrealistic degradation mechanisms compared to outdoors and are therefore not representative. A systematic comparison between the natural degradation happening during outdoor exposure and the accelerated degradation happening in climatic chambers allows selecting appropriate and meaningful testing conditions which can be correlated to outdoor reference sites. The so-defined accelerated aging testing sequence can be used as a valuable quality control tool in mirror manufacturing lines or to optimize the material durability, e.g., by testing slightly modified products with optimized manufacturing processes or chemical compositions of the coatings. So far, a service life-time prediction methodology based on accelerated aging tests has been developed only for aluminum reflectors.
Current research is being conducted to apply this methodology for the development of a testing guideline for silvered-glass mirrors and silvered-polymer films. A first guideline which correlates outdoor exposure with accelerated aging for silvered-glass mirrors is expected for 2019.
The publication of the solar reflector standard developed by the Spanish AENOR (AEN/CTN 206/SC 117/GT 2, “Components of solar thermal plants”) standardization committee is expected for 2017. However, this standard will not allow the performance of life-time estimations. It will rather define a set of minimum requirements that reflector panels need to fulfill in order to be considered promising candidates for outdoor use. In particular, standardization of the test conditions will allow comparing materials from different manufacturers under equal conditions. An accelerated aging round robin test among five different laboratories is currently being carried out to evaluate the experimental deviation of the results among the labs.
Current research regarding sand erosion testing under desert environment in the EU FP7 project STAGE-STE will lead to an erosion testing guideline that simulates North African exposure sites. The guideline is expected to be published in 2017.