Home Page Icon
Home Page
Table of Contents for
The Say It with Charts Complete Toolkit
Close
The Say It with Charts Complete Toolkit
by Gene Zelazny
The Say It with Charts Complete Toolkit
Cover Page
The Say It with Charts Complete Toolkit
Copyright Page
Contents
Introduction: Say It With Charts
Section I: Choosing Charts
A. Determine Your Message
B. Identify the Comparison
1. Component Comparison
2. Item Comparison
3. Time Series Comparison
4. Frequency Distribution Comparison
5. Correlation Comparison
C. Select the Chart Form
1. Pie Chart
2. Bar Chart
3. Column Chart
4. Line Chart
5. Dot Chart
Section II: Using Charts
Component Comparison
Item Comparison
Time Series Comparison
Frequency Distribution Comparison
Correlation Comparison
Section III: Say It with Concepts and Metaphors
Visual Concepts
Linear Flows
Vertical Flows
Circular Flows
Interaction
Forces at Work
Changing Course
Leverage/Balance
Penetration/Barriers
Filters/Screens
Interrelationships
Processes
Segmentations
Visual Metaphors
Games
Sports
Puzzles/Mazes
Optical Confusion
Steps and Stairs
Strings and Things
Punctuation
Words, Words
Drips and Drops
Office Stuff
Going and Coming
Coming and Going
Far Out
Etc.
Section IV: Play It With Charts
Index
Footnotes
Chapter 1
Chapter 2
Search in book...
Toggle Font Controls
Playlists
Add To
Create new playlist
Name your new playlist
Playlist description (optional)
Cancel
Create playlist
Sign In
Email address
Password
Forgot Password?
Create account
Login
or
Continue with Facebook
Continue with Google
Sign Up
Full Name
Email address
Confirm Email Address
Password
Login
Create account
or
Continue with Facebook
Continue with Google
Prev
Previous Chapter
Contents
Next
Next Chapter
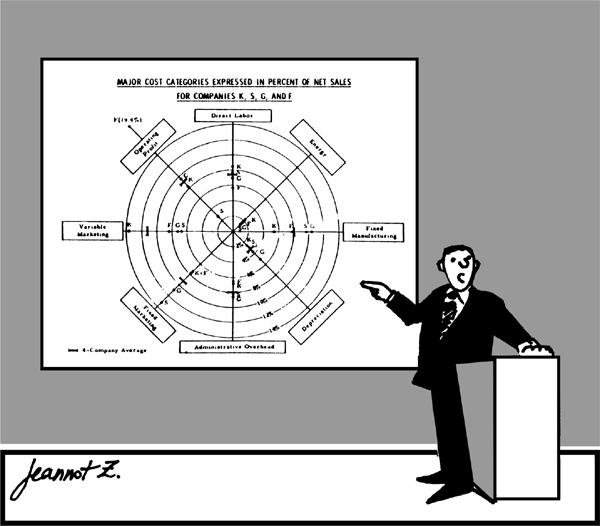
Introduction: Say It With Charts
“What do you mean, what does it mean?”
Add Highlight
No Comment
..................Content has been hidden....................
You can't read the all page of ebook, please click
here
login for view all page.
Day Mode
Cloud Mode
Night Mode
Reset