
Air Pollution Control
Air pollution occurs when chemicals, fumes, particulate matter, odor, or biological materials introduced into the air exceed safe limits. Air pollutants can be in the form of solid particles, liquid droplets, or gases. They are dispersed throughout the world’s atmosphere. Air pollutants released from fossil fuel power plants are particulate matter, carbon dioxide, sulfur dioxide, and nitrogen oxides. Suspended particulate matter in a gas stream may be separated by either an ESP or a bag filter. Carbon dioxide is one of the greenhouse gases. To achieve lower CO2 emissions, the trend of coal-fired utility power plants is to adopt supercritical technology. SO2 emission may be controlled by installing FGD. To control NOx emissions from fossil-fuel-fired plants alternative techniques that are available include low-NOx burners, fuel biasing, limiting the excess-air, application of over-fire air, injecting steam or water into the flame, or recirculating flue gases.
Keywords
pollutant; health hazard; acid rain; SPM; GHG; SOx; NOx
14.1 Introduction
The problem of air pollution may be the worst curse of modern civilization. With the advent of industrialization human beings started to release more effluent into the atmosphere than nature could handle. Air pollution occurs when chemicals, fumes, particulate matter, odor, or biological materials introduced into air exceed safe limits and cause harm to the health of humans, animals, and other living organisms or damage to plants and inanimate objects. These materials can be in the form of solid particles, liquid droplets, or gases and are called pollutants. Pollutants, which are directly emitted from a plant or motor vehicles to atmosphere, e.g., ash, particulate matter, sulfur dioxide, or carbon monoxide, are called primary pollutants, while secondary pollutants result from interaction or chemical reaction of primary pollutants, e.g., formation of smog or depletion of stratospheric ozone layer.
Air pollutants are dispersed throughout the world’s atmosphere in concentrations high enough to gradually cause serious health problems. Sulfur dioxide, nitrogen dioxide, and droplets containing solutions of sulfuric acid, sulphate, and nitrate salts descend to the earth’s surface in wet form as rain or snow and in dry form as fog, dew, or solid particles. This phenomenon is generally called acid rain.
Air pollutants released from fossil fuel power plants include:
Particulate matter
Particulate matter (PM) or more precisely suspended particulate matter (SPM) are fine solid particles suspended in a gas. Particulate matter is either naturally available in the atmosphere or can be manmade. Combustion of fossil fuels in power plants generates significant amounts of particulate matter.
When the presence of these fine particles in air exceeds a safe limit (Table 14.1 and Table 14.2) these particles cause health hazards. Long-term exposure to particulate matter results in heart disease, risk of decreased lung function, exacerbation of asthma, lung cancer, etc.
Table 14.1
Clean air act of the United States,1990
| Pollutant | Primary standards | Secondary standards | ||
| Level | Averaging time | Level | Averaging time | |
| Carbon Monoxide | 9 ppm (10 mg/m3) | 8-hour(1) | None | |
| 35 ppm (40 mg/m3) | 1-hour(1) | |||
| Lead | 0.15 µg/m3 (2) | Rolling 3-Month Average | Same as Primary | |
| 1.5 µg/m3 | Quarterly Average | Same as Primary | ||
| Nitrogen Dioxide | 0.053 ppm (100 µg/m3) | Annual (Arithmetic Mean) | Same as Primary | |
| Particulate Matter (PM10) | 150 µg/m3 | 24-hour(3) | Same as Primary | |
| Particulate Matter (PM2.5) | 15.0 µg/m3 | Annual(4) (Arithmetic Mean) | Same as Primary | |
| 35 µg/m3 | 24-hour(5) | Same as Primary | ||
| Ozone | 0.075 ppm (2008 std) | 8-hour(6) | Same as Primary | |
| 0.08 ppm (1997 std) | 8-hour(7) | Same as Primary | ||
| 0.12 ppm | 1-hour(8) | Same as Primary | ||
| Sulfur Dioxide | 0.03 ppm | Annual (Arithmetic Mean) | 0.5 ppm (1300 µg/m3) | 3-hour(1) |
| 0.14 ppm | 24-hour(1) | |||

(1)Not to be exceeded more than once per year.
(2)Final rule signed October 15, 2008.
(3)Not to be exceeded more than once per year on average over 3 years.
(4)To attain this standard, the 3-year average of the weighted annual mean PM2.5 concentrations from single or multiple community-oriented monitors must not exceed 15.0 µg/m3.
(5)To attain this standard, the 3-year average of the 98th percentile of 24-hour concentrations at each population-oriented monitor within an area must not exceed 35 µg/m3 (effective December 17, 2006).
(6)To attain this standard, the 3-year average of the fourth-highest daily maximum 8-hour average ozone concentrations measured at each monitor within an area over each year must not exceed 0.075 ppm. (effective May 27, 2008)
(a) To attain this standard, the 3-year average of the fourth-highest daily maximum 8-hour average ozone concentrations measured at each monitor within an area over each year must not exceed 0.08 ppm.
(b) The 1997 standard–and the implementation rules for that standard – will remain in place for implementation purposes as EPA undertakes rulemaking to address the transition from the 1997 ozone standard to the 2008 ozone standard.
(a) The standard is attained when the expected number of days per calendar year with maximum hourly average concentrations above 0.12 ppm is <1.
(b) As of June 15, 2005 EPA has revoked the 1-hour ozone standard in all areas except the fourteen 8-hour ozone non-attainment Early Action Compact (EAC) Areas. For one of the 14 EAC areas (Denver, CO), the 1-hour standard was revoked on November 20, 2008. For the other 13 EAC areas, the 1-hour standard was revoked on April 15, 2009.
Table 14.2
Central pollution control board notification 2009, INDIA
| Pollutants | Time weighted | Concentration In ambient air, μg/m3 | |
| Industrial, residential, rural, and other areas | Ecologically sensitive areas (notified by Central Government) | ||
| Sulfur Dioxide SO2 | Annual average* | 50 | 20 |
| 24 hours** | 80 | 80 | |
| Nitrogen Dioxide NO2 | Annual average* | 40 | 30 |
| 24 hours** | 80 | 80 | |
| Particulate Matter (size less than 10 μm) or PM10 | Annual average* | 60 | 60 |
| 24 hours** | 100 | 100 | |
| Particulate Matter (size less than 2.5 μm) or PM2.5 | Annual average* | 40 | 40 |
| 24 hours** | 60 | 60 | |
| Ozone, O3 | 8 hours** | 100 | 100 |
| 1 hour | 180 | 180 | |
| Lead | Annual average* | 0.5 | 0.5 |
| 24 hours** | 1.0 | 1.0 | |
| Carbon Monoxide CO, mg/m3 | 8 hours** | 2.0 | 2.0 |
| 1 hour | 4.0 | 4.0 | |
| Ammonia NH3 | Annual average* | 100 | 100 |
| 24 hours** | 400 | 400 | |

*Annual Arithmetic Mean of minimum 104 measurements in a year taken twice a week 24 hourly at uniform interval.
**24 hourly or 8 hourly or 1 hourly monitored values, as applicable, shall be complied with 98% of the time in a year. 2% of the time, they may exceed the limits but not on two consecutive days of monitoring.
Carbon dioxide (CO2)
Carbon dioxide (CO2) is one of the major pollutants in the atmosphere, but it is vital to living organisms. The major source of CO2 into the atmosphere is combustion of fossil fuels.
Carbon dioxide is one of the “greenhouse” gases (other greenhouse gases in the earth’s atmosphere are water vapor, methane, nitrous oxide, ozone, sulfur hexafluoride, hydrofluorocarbons, perfluorocarbons, nitrogen trifluoride, etc.) that cause global warming. Global warming is the term that refers to the increase in the average surface air temperature of the planet as a result of build-up of these gases in the atmosphere. Greenhouse gases absorb and emit radiation from the atmosphere within the thermal infrared range.
Carbon dioxide is a good transmitter of sunlight, but partially restricts infrared radiation going back from the earth into space. This produces the so-called greenhouse effect that prevents cooling of the earth during the night and keeps the earth warm enough to support human, plant, and animal life. However, incessant release of manmade CO2 to the atmosphere is so alarming that the concentration of CO2 since the beginning of the Industrial Revolution (taken as the year 1750) has increased by about 43%, from 280 ppm in 1750 to 400 ppm in 2015 [1], in spite of continuous reduction of atmospheric concentration of CO2 by photosynthesis. This in turn has reinforced the warming of the earth’s surface further beyond the tolerable limit of earthly objects, both animate and inanimate. The Intergovernmental Panel on Climate Change (IPCC) has predicted an average global increase in temperature of 1.4 K to 5.8 K between 1990 and 2100.
Carbon monoxide (CO)
Carbon monoxide is generated when there is incomplete combustion of fuel. It is colorless and odorless, but is a very poisonous gas. However, due to the high efficiency of present-day steam generators, emission of carbon monoxide from power plants is not of much of a concern.
When inhaled, carbon monoxide enters the bloodstream and disrupts the supply of oxygen to the body’s tissues, the results of which may become fatal if the CO concentration becomes 1000 ppm or more.
Sulfur oxides (SOx)
All fossil fuels, i.e., coal, oil, and natural gas, contain sulfur, and/or sulfur compounds. Sulfur in coal exists in three forms: organic, pyritic and sulfate. Sulfur that is an inherent constituent of coal is organic sulfur, which is considered as a non-removable impurity. Pyritic sulfur, also known as inorganic sulfur, occurs primarily as pyrite or mercasite. Sulfate sulfur usually exists in the form of calcium sulfate or iron sulfate. The sulfates represent a small fraction of the total sulfur in coal and have no significant role in the combustion process itself or in contributing to emissions. During combustion, both organic sulfur and pyrite are oxidized to sulfur dioxide (SO2). Depending on combustion conditions, a small amount of sulfur trioxide (SO3) may also be formed. Sulfur oxides in combination with moisture content of flue gas form acids (sulfuric acid: H2SO4) that may get deposited when combustion gas is cooled below its dew-point temperature, resulting in corrosion of air heaters, economizers, downstream flue-gas path, and stacks. Sulfur also contributes to clinkering and slagging and to spontaneous combustion of stored coal.
In the absence of a suitable emission control process SOx, mainly SO2, escapes to the atmosphere. Sulfur oxides emitted from the stack cause acid rain. Sufficiently high concentrations (10 ppm) of sulfur dioxide in the atmosphere irritates the upper respiratory tract of human beings and causes wheezing, breathing problems, exacerbation of asthma, etc. Hence, the use of sulfur-bearing fuels as a power source is a concern.
Nitrogen oxides (NOX)
Oxides of nitrogen are major air pollutants that have a significant detrimental effect on the atmosphere. During combustion of fossil fuels at high temperature, nitrogen present in coal as well as combustion air is converted to nitric oxide (NO) and nitrogen dioxide (NO2) (together commonly referred to as NOX). In the atmosphere, NO in the presence of sunlight oxidizes to NO2. Nitrogen dioxide is toxic and is one of the major air pollutants. NOX emissions are of concern because they are associated with acid rain, causing damage to aquatic ecosystems, corrosion of building materials, etc.
Exposure to high levels of NO2 may lead to lung damage, asthma, respiratory problems, etc. NO2 can enter into bloodstream, causing damage to tissues of the body due to disruption of oxygen supply much like carbon monoxide.
The effects of these air pollutants is increasing continuously since the number and unit capacity of thermal power plants are increasing every day. Figure 14.1 shows how the primary energy demand is growing year after year. Therefore, with the growth of the industry, it is essential to take measures to help prevent air pollution.

Air pollution is so critical today that the feasibility of installing any new industry depends on the findings of an Environmental Impact Assessment (EIA) study along with any remedial measures proposed. Even at the bidding stage of a new project emission levels get the same priority if not more as price, efficiency, reliability, etc.
Thus, to prevent critical polluting environment, clean air legislation is now in force in many countries and often imposes severe restrictions on allowable emissions from stack. The permitted emission varies from country to country. Table 14.3, Table 14.4, and Table 14.5 present the emission guidelines of fossil fuel-fired steam power plants boiler as determined by the IFC–WB (International Finance Corporation-World Bank) and other countries.
Table 14.3
Emission guidelines for particulate matter (mg/Nm3)
| FUEL | IFC-WBa,b/Plant capacity, MWth | United States | EUa/Plant capacity, MWth | CHINAa | INDIA/plant capacity, MW | ||
| NDA | DA | ||||||
| Natural Gas | NA | NA | |||||
| Other Gaseous Fuels | 50 | 30 | |||||
| Liquid Fuels | 50/>50 to <600 | 30/>50 to <600 | |||||
| Liquid Fuels | 50/≥600 | 30/≥600 | |||||
| Solid Fuels | 50/>50 to <600 | 30/>50 to <600 | 6.4 gm/GJ | 50/50 to 100 | 50 | 100–150a/200 to <500 | |
| Solid Fuels | 50/≥600 | 30/≥600 | 30/>100 | 45c (maximum) with design coal and all fields in service/sub-critical ≥500 | 80c (maximum) with maximum ash coal and one field of each pass of ESP out of service)/sub-critical ≥500 | ||
| Solid Fuels | 50d (maximum or as per MOEF”s requirement, whichever is more stringent with design coal and one field of each pass of ESP out of service)/ supercritical 660/800 MW | 80d (maximum or as per MOEF”s requirement, whichever is more stringent with maximum ash coal and one field of each pass of ESP out of service)/ supercritical 660/800 MW | |||||

Notes: NDA=Non-Degraded Airshed, DA=Degraded Airshed (poor air quality), NA=Not Applicable.
MOEF=Ministry of Environment and Forests, India.
aIFC-WB (International Finance Corporation-World Bank) Environmental, Health and Safety (EHS) Guidelines THERMAL POWER PLANTS (December 19, 2008) [3].
bDry Gas Excess O2 Content for gaseous and liquid fuels is 3% and for solid fuels is 6%.
cCEA (Central Electricity Authority, India) Standard Technical Specification Main Plant Package of Sub-critical Thermal Power Project ≥500 MW (September 2008).
dCEA Standard Technical Features of BTG System for Supercritical 660/800 MW Thermal Units (July 2013).
Table 14.4
Emission guidelines for SO2 (mg/Nm3)
| FUEL | IFC-WBa,b/Plant capacity, MWth | United Statesa | EUa/Plant capacity, MWth | CHINAa | INDIA/Plant Capacity, MW | |
| NDA | DA | |||||
| Natural Gas | NA | NA | ||||
| Other Gaseous Fuels | 400 | 400 | ||||
| Liquid Fuels | 900–1500/>50 to <600 | 400/>50 to <600 | ||||
| Liquid Fuels | 200–850/≥600 | 200/≥600 | ||||
| Solid Fuels | 900–1500/>50 to <600 | 400/>50 to <600 | 640 gm/MWH (or 200 at 6% O2 assuming 38% HHV Efficiency | 850/50 to 100 | 400 (general) | Stack Height, mc |
| 800 for coal GCV <12,550 kJ/kg | H=14 (Q)0.3 | |||||
| 1200 with mine-mouth plant burning | Q=Emission rate of SO2, kg/h/<200 | |||||
| Solid Fuels | 200–850/≥600 | 200/≥600 | 200/>100 | S <0.5% coal | Stack Height 220 mc/200 to <500 | |
| Solid Fuels | Stack Height 275 mc/≥500 | |||||

Notes: NDA=Non-Degraded Airshed, DA=Degraded Airshed (poor air quality), NA=Not Applicable.
MOEF=Ministry of Environment and Forests, India.
aIFC-WB (International Finance Corporation-World Bank) Environmental, Health and Safety (EHS) Guidelines THERMAL POWER PLANTS (December 19, 2008) [3].
bDry Gas Excess O2 Content for gaseous and liquid fuels is 3% and for solid fuels is 6%.
cGovernment of India’s Extra Ordinary Gazette No. G.S.R. 801(E) dated December 31, 1993. General Standards for discharge of environmental pollutants Part-A: Effluents.
Table 14.5
Emission guidelines for NOx (mg/Nm3)
| FUEL | IFC-WBa,b/Plant capacity, MWth | United States | EUa/Plant capacity, MWth | CHINAa | INDIA/Plant capacity, MW | |
| NDA | DA | |||||
| Natural Gas | 240 | 240 | ||||
| Other Gaseous Fuels | 240 | 240 | ||||
| Liquid Fuels | 400/>50 to <600 | 200/>50 to <600 | ||||
| Liquid Fuels | 400/≥600 | 200/≥600 | ||||
| Solid Fuels | 510 or up to 1100 If volatile matter of fuel <10%/>50 |
200/>50 | 450 gm/MWH | 150/50 to 300 | ||
| Solid Fuels | 200/>300 | |||||

Notes: NDA=Non-Degraded Airshed, DA=Degraded Airshed (poor air quality), NA=Not Applicable.
MOEF=Ministry of Environment and Forests, India.
aIFC-WB (International Finance Corporation-World Bank) Environmental, Health and Safety (EHS) Guidelines THERMAL POWER PLANTS (December 19, 2008) [3].
bDry Gas Excess O2 Content for gaseous and liquid fuels is 3% and for solid fuels is 6%.
In addition to stack emission limits discussed above, ambient air emission limits in various countries are more stringent to safeguard health of human beings, animals, plants, etc., as is evident from Table 14.1 that reflects emission limits in the United States and Table 14.2 which presents National Ambient Air Quality Standard of emission limits in India.
14.2 Control of Suspended Particulate Emission
Suspended PM in a gas stream may be separated by either a mechanical separating device or an electrical separating device. The mechanical separating device includes gravity settling, cyclone separation, scrubbers, fabric filters, etc. The electric separating device refers to electrostatic precipitation. An electrostatic precipitator (ESP) is one of the most widely used air pollution control devices since mechanical separating devices, barring bag filter, are unable to collect fine particles.
Both ESP and bag filters are capable of collecting very fine particles from 10 μ down to 0.05 μ size, with the highest collection efficiency over a wide range of contaminants as is evident from Figure 14.2. They can be used in applications where there is a large volume of contaminants. The performance of a bag filter is as reliable as an ESP and provides almost identical collection efficiency.

An ESP has relatively constant pressure drop and is a constant efficiency (as measured by the percentage removal of the inlet dust loading) device, depending on inlet loading and dust properties. Figure 14.3 shows a general view with part of a sectional arrangement of a typical ESP.

Bag filters are constant emission (as measured by the mass of the particulate emitted per unit of fuel fired) device and exhibit a varying pressure drop, depending on dust properties and the degree of cake thickness at any point of reference. A general view with a sectional arrangement of a typical bag filter is shown in Figure 14.4.

14.2.1 Control of suspended particulate matter (SPM) using ESP
Electrostatic precipitators depend on static electricity to do their work. The main components of an ESP are two sets of electrodes (Figure 14.5). The first is comprised of rows of electrically grounded vertical parallel plates, called collecting electrodes, between which the gas to be cleaned flows. The second set of electrodes is wires, called discharge electrodes, are centrally located between each pair of parallel plates. These electrodes may be of different shape and design. Figure 14.6 shows different types of collecting electrodes, while Figure 14.7 presents various types of discharge electrodes.


The wires carry a unidirectional, negatively charged, high-voltage DC current from an external source that generates unidirectional, non-uniform electric field. In a non-uniform electric field, the field intensity near the conductor is considerably higher than that on the periphery or on the plate. Therefore, as the voltage increases, the ionization takes place about the conductor. No ionization takes place near the periphery or on the plate. When the voltage is high enough, a blue luminous glow, called a corona, is produced around them. The corona is an indication of generation of negatively charged gas ions that travel from wires to the grounded collecting electrodes as a result of strong electric field between them. The field intensity that causes the corona to start may be calculated using the following formula [6]:
(14.1)
 (14.1)
β = Ratio of density of gas under the working conditions to that under standard conditions (pressure: 101.3 kPa and temperature 298 K)
(14.2)
14.2.2 Fundamentals
It is known from basic physics that all bodies fall into two categories, i.e., conductors and dielectrics. A body in which electric charges may move freely throughout its volume is called a conductor. While a body that does not possess any such property and acts as an insulator is called dielectric. Gases under normal condition are insulators (dielectric), since they comprise electrically neutral atoms and molecules. However, when subjected to the influence of various artificial methods, i.e., X-rays, radioactive emissions, cosmic rays, strong heating, bombardment of gas molecules by rapidly moving electrons or ions, etc., these gases get ionized, i.e., split into electrons (negative ions) and positive ions, and become conductors. A combination of some of the free electrons of gases with their neutral gas molecules also results in the formation of negative ions.
Out of all artificial methods of ionization just described, the high-voltage direct-current corona is by far the most effective to ionize gas particles. In this method electrodes are connected to a voltage source and produce a non-uniform electric field. When gases are passed between these electrodes, the free charges within gases move along lines of forces of the non-uniform electric field. Thus under the influence of strong electric field suspended particles in gas stream migrate toward collecting electrodes. On reaching the electrodes, particles release part of their charge and get collected. The collected dust is then discharged periodically by rapping and gets collected in storage hoppers. The whole process includes the following steps:
a. Charging of suspended particles
b. Collection of charged particles in an electric field
c. Removal of precipitated matters from collecting electrodes
The separation force acting on a particle is given by Coulomb’s law, which states that force is proportional to the product of particle charge and the intensity of the collecting field. Hence,
(14.3)
Although the Coulomb force steers particles to accelerate toward the collecting electrodes, inertial and viscous forces counteract the Coulomb force and oppose the motion of particles. For suspended particles, inertial forces are negligibly small and may be ignored. The viscous force of the gas is governed by Stokes’ law and is expressed by Eq. 14.4. The resultant of the Coulomb force and Stokes (viscous) force determines velocities to be attained by a particle in the precipitation field. The velocity at which the particles move in the gas streams toward the collecting electrodes is called the migration velocity of the particle.
Thus, the viscous force,
(14.4)
w=Migration or drift velocity of a charged particle in an electric field and is given by Eq. 14.5 and Eq. 14.6
(14.5)
(14.6)
For Eo=Ep=E, and if w is expressed in cm/s, E in V/m, r in m, and μ in N.s/m2, Eq. 14.5 and Eq. 14.6 change as follows [6]:
(14.7)
(14.8)
Equation 14.7 shows that the migration velocity of particles greater than 1 μ in diameter is determined by the particle size as well as by the product of field intensities and inversely by the gas viscosity. While from Eq. 14.8 it follows that sub-micron particles travel at velocities directly proportional to the field intensity and inversely proportional to the gas viscosity, but independent of their size. Since the migration velocity is dictated by gas viscosity, which in turn is directly proportional to gas temperature, it may be concluded that the migration velocity is sensitive to changes in gas temperature.
14.2.3 Factors to consider for sizing an ESP
Sizing of an ESP is determined by various factors or parameters, discussed in the following sections. The more accurate the values of these parameters can be predicted during the design stage the better performance of an ESP is expected in the field. Hence, the more the field feedback data available on the performance of a particular design of ESP, the more accurate these parameters can be predicted at the design stage that will ensure better performance of similar design of ESPs in future. Eventually the design of an ESP is more of an art than a science.
A single parameter, which is to be judiciously assumed prior to sizing an ESP, is effective migration velocity (EMV), which influences the collection efficiency of an ESP. Deutsch–Anderson in 1922 developed the following formula for predicting the collection efficiency of an ESP,
(14.9)
η=Collection efficiency of ESP, %
w=Effective migration or drift velocity (EMV), cm/s
f=Specific collection area (SCA), m2/m3/s
(=collecting electrode surface area, m2, divided by actual volumetric wet gas flow, m3/s)
From Eq. 14.9 it is evident that the factors that affect the performance of an ESP are EMV and SCA.
In the 1970s, a modified version of the Deutsch–Anderson equation, known as the Matts–Ohnfeldt equation, was developed to predicting better performance of an ESP. The modified equation is
(14.10)
η=Collection efficiency of ESP, %
wk=Apparent migration velocity, cm/s
f=Specific collection area (SCA), m2/m3/s, (as in Eq. 14.9)
k=Constant (the value of power “k” varies from 0.4 to 0.6, but is normally 0.5)
14.2.4 Effective migration velocity (EMV), w
From field experience it has been established that it is easier to collect larger particles than smaller particles, and the collection efficiency of an ESP decreases with a drop in particle size. Therefore, based on experimental studies the collection efficiency of an ESP at various operating conditions as well as for particle sizes ranging larger than 1 μ to sub-micron an overall effective migration velocity is estimated. The value of effective migration velocity is a measure of ease or difficulty of collection.
As explained earlier, the migration velocity is determined by the magnitude of particle size, the strength of electric field and the viscous force or drag of the particle. This theoretical value may become excessively high compared to actual value due to uneven gas flow, particle diffusion, electric wind, particle charging time, and re-entrainment.
Hence, during design stage, some characteristics/values of these factors are assumed to arrive at an acceptable effective migration velocity, which may get reduced significantly during actual operation. In practice actual migration velocity may deviate considerably from that estimated at design stage, which is usually based on empirical observations. In view of this, it is safe to select a low value of effective migration velocity, and even more so, for handling high resistivity fly ash (Table 14.6), since the migration velocity declines as resistivity increases (Figure 14.8).
Table 14.6
| SI. no. | Resistivity of fly ash, ohm-cm | Effective migration velocity, cm/s | |
| Electrode spacing (gap between two consecutive parallel collecting electrodes), mm | |||
| 300 | 400 | ||
| 1. | 1013 (Generally encountered while firing Indian coal). | 3 | 4 |
| 2. | 1010 | 12 | 16 |


14.2.5 Specific collection area (SCA), f
The SCA is determined by dividing the total effective collecting electrode surface area by the actual volume flow rate of wet gas to be treated. The value of the SCA depends on physical, chemical, and electrical characteristics of the dust. Table 14.7 summarizes some typical values of SCA for different resistivity of fly ash.
Table 14.7
| Sl. No. | Resistivity of fly ash, ohm-cm | Specific collection area, m2/m3/s | |
| Electrode spacing (gap between two consecutive parallel collecting electrodes), mm | |||
| 300 | 400 | ||
| 1. | 1013 (Generally encountered while firing Indian coal). | 200 | 150 |
| 2. | 1010 | 50 | 38 |

In addition to the EMV and SCA other factors that influence ESP sizing are:
14.2.6 Aspect ratio
This is the ratio of total collecting length to the collecting height of an electrode. If the length of collecting zone is too short compared with its height, some of the falling dust will be carried out of the precipitator before it reaches the hopper, resulting in re-entrainment of dust particles. As a result dust carryover to stack will increase. For good design, a designer should be comfortable with an aspect ratio of ESP of 2.5 or more.
14.2.7 Number of fields in series
To enhance the reliability of ESP performance, the longitudinal electrical section of gas flow path is divided into a number of independent electric fields. In practice a number of electric fields in series should be no less than 7, in case ash resistivity is too high number of fields in series can be even 9. With this arrangement, the ESP performance would not be impaired much, even with the loss of one electric field, particularly in the case of handling high resistivity ash.
The more the number of fields within a given longitudinal section, the smaller the size of each section, which in turn will provide the following advantages:
14.2.8 Length of a field
The time required by each particle to migrate to collecting electrode from discharge electrode determines the length of a field of precipitator passage in the direction of gas flow. This migration time has to be less than the passage time of each particle while passing through a field of precipitator with the same velocity as gas for ensuring effective removal of PM in a field vis-à-vis and ESP. The length of a field of precipitator thus is ensured by [7]:
(14.10)
or
(14.11)
14.2.9 Treatment time
The time taken by a particle to pass through the total length of the precipitator is known as the treatment time. For a good design the value of treatment time varies between 25 and 35 s for low-sulfur, low-sodium coals and between 7 and 20 s for high-sulfur, high-sodium coals [8].
14.2.10 Electrode spacing
Electrode spacing is double the gap between discharge electrodes and collecting electrodes, which means the gap between two parallel collecting electrodes. The electrode spacing considerably influences the migration velocity. For constant current density and field strength, an increase in electrode spacing facilitates choosing a higher migration velocity as is clear from Table 14.6. As a result, the total collection area is reduced substantially to achieve the desired collection efficiency, which is obvious from Eq. 14.9; thus the total capital expenditure gets reduced. A decrease in electrode spacing would result in lower migration velocity, resulting in higher capital expenditure.
To meet today’s stringent pollution control regulations, the efficiency of an ESP has to be very high, about 99.98% or more, for handling high resistivity ash. Thus, from an economical perspective industry practice is to provide electrode spacing of the order of 300/350/400/450/500 mm [9].
14.2.11 Automatic voltage control
The collection efficiency of an ESP is determined by the precipitation voltage potential between the discharge electrode and collecting plate. The maximum precipitator efficiency may be achieved by maintaining the operating voltage in the individual field of the precipitator below, but close to the flashover limit (the point of sparking between discharge electrodes and collecting plates that switches off the plant). Further, as the flashover voltage varies with operating conditions of the precipitator, such as gas volume, dust content, gas composition, gas temperature, humidity, etc., continuous adjustment of precipitation voltage according to prevailing operating conditions is needed. Therefore, in order to avoid the frequent readjustment and possible trip-outs on manually operated sets, operating personnel often reduce the voltage and current to much lower than the flashover limit.
Automatic voltage control works in two steps: first, the voltage is gradually raised at a pre-set rate until flashover takes place and switches off the system. Then after a pre-set time delay, the system switches on automatically and the voltage is raised to slightly reduced level than the flashover limit. Thereafter, this mode of cycle gets repeated continuously.
14.2.12 Transformer rectifier (T/R) set
The high-voltage power needed to discharge the electrode system is supplied by a transformer rectifier set along with a controller. Two transformer rectifier sets are normally needed to power each precipitator field. In practice a medium voltage AC supply is regulated and transformed into a nominal voltage of 50–120 kV, rectified to a negative DC output then supplied to the discharge electrode system.
The current density usually is maintained over a range of 0.25–0.45 mA/m2, from which the capacity of transformer rectifier set can be determined, since the collecting area of each field is already known.
14.2.13 Hopper heating and storage volume
In practice, dust collected near hopper walls will agglomerate and plug the dust-removing system. Hopper heating arrangement prevents formation of dust cakes and gets rid of the hopper plugging problem. Additionally, the bottom part of the hopper is sometimes provided with a stainless steel liner that ensures satisfactory flow of dust from it. Fluidizing pads are also fitted inside hoppers to ensure smooth flow of dust.
The dust hoppers must have adequate storage capacity to hold all the collected dust at a boiler maximum generating condition of the unit while firing the worst coal. An overfill hopper may result in loss of an electrical section. Therefore, the hopper storage volume should be adequate enough such that during the interval between two consecutive steps of removal of dust from the hopper usually (6–8 hrs) as per the industry practice, dust build-up will not bridge the high voltage frame.
14.2.14 Rapping mechanism
When dust builds up on plates, it deposits in a layer of increasing thickness with possible re-entry into the gas flow path, hence build-up ash needs to be removed periodically by hitting/rapping collecting electrodes with hammers. Based on the changing characteristics and collection rates of dust the intensity and frequency of rapping of individual collection plates varies from inlet to outlet of precipitator. Rapping should be carried out sequentially so that only a fraction of accumulated dust is disturbed at any one time.
There are two types of hammers: drop hammer and tumbling hammer. Drop hammers are either pneumatically driven or electrically driven. Each drop hammer is connected with a number of electrodes and is used to rap from the top of electrodes. Tumbling hammers are basically side hammers where a set of hammers is mounted on a horizontal shaft in a staggered fashion. As the shaft rotates one hammer at a time tumbles and hit a shock bar.
Excessive rapping of collecting electrodes is detrimental to the performance of an ESP as it causes re-entrainment of collected dust and reduces the life of internal components. In contrast, inadequate rapping results in build-up of a dielectric dust layer on the collecting plates, which is penetrated by corona current. As a result the dust layer reaches a level of resistivity that generates ionization or back-corona and causes dust particles to become positively charged and move toward negative high voltage discharge electrodes. Thus, localized excessive sparking occurs, reducing power input to the ESP, which in turn lowers the collection efficiency.
14.2.15 Factors that affect performance of ESP
The factors that determine the type, size, and efficiency of the electrostatic precipitator are discussed in following sections. During normal running if any of these factors varies substantially from the design, the performance of the ESP will be jeopardized, which may lead to violating a local SPM emission regulation.
14.2.16 Volume of gas flow
The volume of gas to be treated is usually determined at the design stage of any project. Subsequently, if it is found that the actual volume of gas to be handled is much higher than the specified volume of gas, the following detrimental effects on ESP performance could be encountered:
• Achieved efficiency would reduce (Figure 14.9)
• Re-entrainment loss would increase

14.2.17 Velocity of gas flow
This is a critical design parameter and is calculated by dividing the actual volume flow rate of gas by the cross-sectional area of the precipitator. For low-sulfur, low-sodium coals, the gas velocity may be in the range of 0.5–1 m/s, and for high-sulfur, high-sodium coals, the gas velocity could be as high as 1.5 m/s [8]. At velocities greater than that, problems of re-entrainment of suspended particles are aggravated.
14.2.18 Temperature of flue gas
Temperature of flue gases passing through precipitator will affect the collectability of ash and removal of collected ash from collecting plates. When this temperature reaches the dew-point temperature moisture will form and cause dust particles to solidify into cakes. Further build up of these cakes may result in short-circuits or wire failures. In contrast, if the flue-gas temperature exceeds a high limit, then the gas volume will increase, leading to a reduction in collection efficiency. At higher temperature, the viscosity of the gas also increases, resulting in high viscous drag with an additional reduction in collection efficiency.
14.2.19 Gas distribution
While flowing through the precipitator the distribution of gas must be uniform all along its path, from the inlet up to its outlet. In sections where velocity is high, ash may be swept off collector plates and can show up in the stack as a visible plume, while at low velocity sections, although gas is more efficiently cleaned, the effect will be a reduction in overall collection efficiency. Hence, proper devices, e.g., perforated distribution plates, turning vanes, and baffles in the precipitator inlet and duct work, should be installed to prevent uneven gas distribution.
14.2.20 Dust resistivity
The electrostatic precipitator is very sensitive to the resistivity of ash or dust deposited on collecting plates. Experience has shown that coal ashes with resistivity between 108 and 2×10¹⁰ ohm-cm is normal for satisfactory and predictable precipitator design. Resistivity of ash that exceeds this limit becomes highly resistive to dust collection. The presence of constituents, such as SiO2, Al2O3, CaO, etc., in fly ash causes high resistivity of ash that does not readily lose its charge when collected on plates, and the agglomerated ash is very difficult to get removed. When deep-enough deposits collect on the plate, back-corona (local sparking on dust layer) develops, causing the collection rate to reduce (Figure 14.10). A corona discharge occurs only in an inhomogeneous electric field with the electrodes definitely shaped and located [6].

The resistivity of ash is lowered by cooling the inlet gas to the ESP while simultaneously increasing the water vapor content or by introducing SO3, NH3, etc., into the flue gas. These additives are adsorbed onto fly ash particles and produce an electrically conductive surface condition, improving precipitation. The resistivity may be lowered by “hot” precipitation as well. Experimental results reveal that resistivity of ash is maximum at around 423 K (Figure 14.11).

14.2.21 Inlet dust concentration
At the time of design certain dust concentration at inlet to the ESP is determined. If this concentration changes during operation, there will be consequent change in dust collection efficiency (Figure 14.12).
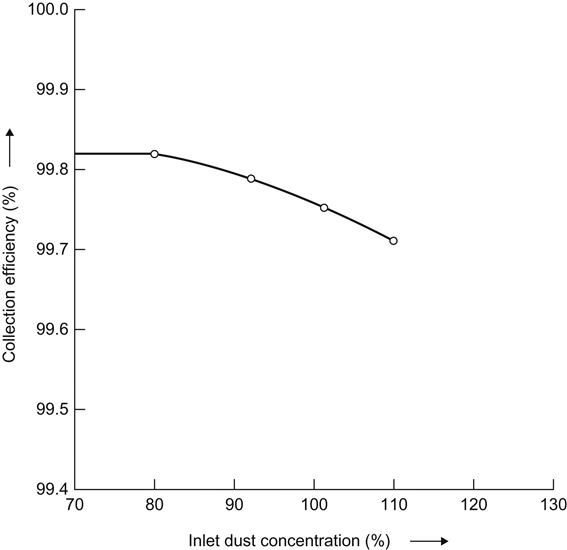
14.2.22 Weight of dust per unit volume of gas
During the design stage the expected weight of fly ash per unit time may be calculated, considering analysis of a worst coal. If at a later stage it is found that the as-received coal has much higher ash content than a precipitator is designed to handle, then the ESP inlet dust concentration would increase, causing a fall in collection efficiency as shown in Figure 14.12.
14.2.23 Basic properties of the gas and dust particles
A precipitator is designed specifically for an ash produced by coal containing a certain amount of sulfur; if coal with different sulfur content is burned, the efficiency will vary. A coal with lower sulfur content may give satisfactory separation when the flue-gas temperature is increased. For corrosive gases and particles, the shell interior must be made of corrosion-resistant materials, such as lead for sulfuric acid mist and tile block for paper mill salt cake.
The particle size also affects the settling rate. Particles larger than about 1 μ will settle too rapidly. Sub-micron particles (within the range of 0.1–0.5 μ) will settle very slowly and exhibit Brownian motions. The settling rate again becomes rapid for particle size less than 0.1 μ [8].
The optical properties of particles are of great importance in connection with gas cleaning and air pollution, because the degree of pollution is commonly judged by visual appearance of stack discharge.
14.2.24 Disposal of collected gas
An ESP is enclosed and insulated. If the hoppers are not insulated, ash near hopper walls will agglomerate as it cools. There is a tendency for the agglomerated mass to form cakes, which may plug the ash conveying system. If ash is not removed regularly from hoppers, it can build up to a point where it will bridge high voltage frame, causing a short-circuit and loss of an electrical section. Prolonged accumulation of ash may endanger ESP structure and cause catastrophic failures.
14.2.25 Control of SPM using a bag filter
A bag filter, also known as a fabric filter or baghouse, comprises multiple compartments (similar to ESP fields), each housing several vertical (2–10 m high) small diameter (120–400 mm dia) cloth or fabric bags (in place of electrodes in ESP) [11]. Depending on the temperature of the entering flue-gas the type of fabric material may be any one of Polypropylene (PP), Polyester (PES), Draylon T (PAC), Ryton (PPS), Nomex (APA), P84 (PI), Teflon (PTFE), Fiber glass (GLS), etc [4]. Of these materials, from an economical perspective, the most suitable one for handling fossil fuel-fired flue gas is Ryton, which can withstand a flue-gas temperature up to 453 K.
14.2.25.1 Principle of operation of a bag filter
On entering the baghouse, dust-burdened flue gas strikes a baffle plate, where larger dust particles fall by gravity (Figure 14.4). This partially cleaned dirty gas then enters each bag and leaves as clean gas from the top of the bag. PM adheres to the surface of cloth as cake and gets accumulated. These accumulated cakes are cleaned periodically by applying pulse-jet or reverse-jet air flow and get collected in hoppers. Dust particles collected in hoppers are removed periodically by a fly ash-handling system. The cakes may also be cleaned by shaking or rapping of bags.
14.2.26 Factors to consider for sizing a bag filter
Three factors that affect the sizing of bag filters are:
i. Air/Cloth Ratio (m3/s/m2): This is the ratio of flue-gas flow rate, m3/s, to the total exposed surface area of clothes to flue gas, m2. For pulse-jet bag filters the air/cloth ratio typically varies from 0.015 to 0.020 m3/s/m2, while for reverse-jet bag filters the value ranges between 0.0075 and 0.01167 m3/s/m2 [4].
ii. Pressure Drop: The pressure drop is the sum of pressure drop across clean filter bags, pressure drop that occurs across collected cakes, and that which takes place across the baghouse internals.
iii. Emission Rate: This is the emission limit that is to be complied with in line with the recommendation of local environmental control authority.
14.2.27 Factors that affect the performance of the bag filter
In addition to the air/cloth ratio other factors that may affect the efficiency of a bag filter are as follows:
i. Material of Fabric: Material selected should be capable of withstanding the maximum flue-gas temperature during operation, of resisting abrasion and of withstanding any chemical attack
ii. Temperature: Flue-gas temperature if exceeds the maximum withstand limit of the material chosen will cause detrimental effect on cloth to get damaged
iii. Re-entrainment: If the selected air/cloth ratio is too high or if the fabric open up for any reason the finer particles will get carried away along with the flue gas through the stack.
14.2.28 Comparison between ESP and bag filter
Table 14.8 summarizes comparative analysis of ESP and bag filter.
Table 14.8
Differences between ESP and bag filter [11]
| Sl. no. | Parameter | ESP | Bag filter |
| 1. | Pressure Drop | About 25 mmwc | 100–200 mmwc |
| 2. | Removal Efficiency | Constant | Variable |
| 3. | Removal Emission | Variable | Constant |
| 4. | High Temperature | Tolerant | Highly Sensitive |
| 5. | Chemical Attack | Tolerant | Highly Sensitive |
| 6. | Erosion | Tolerant | Highly Sensitive |
| 7. | Abrasion | Tolerant | Highly Sensitive |
| 8. | Ash Resistivity | Highly Sensitive | Tolerant |
| 9. | Energy Consumption | Low | Extremely High |
| 10. | Operation | Simple | Complex |
| 11. | Maintenance | Easy | Difficult |
| 12. | Service Life of Elements | Service life of electrodes is very long | Service life of fabric (Ryton) is about 20,000 hrs |
| 13. | Cost of Replacing Elements | Very little | About a million USD every 2.5 years |
| 14. | Capital Cost | Comparable | |
| 15. | O and M Cost | Low | Very High |

14.3 Reduction of Greenhouse Gas Emission
Coal is an abundant fossil-fuel resource in many countries of the world and currently coal-fired stations account for over 40% of power produced globally. Coal will remain as a dominant fuel for power generation in those countries, where availability of coal is abundant. Even in countries where natural gas is abundantly available, coal-fired stations are attractive, since the cost of natural gas is exorbitantly high compared to the cost of coal. This is in spite of the fact that emission of CO2 (which is a major greenhouse gas as explained earlier) per kWh from a coal-fired station is almost twice the amount emitted from a natural-gas-based combined cycle power plant. Therefore, in order to reduce CO2 emissions from coal-fired power plants it is important that these plants produce power more efficiently. A study reveals that in a 660 MW power station, firing typical Indian coal, a gain in plant efficiency by 3% would result in reduction in CO2 emissions by about 6% per kWh [12].
Hence, to achieve lower CO2 emissions, coal-fired utility power plants should choose larger unit sizes and higher steam parameters. Eventually power plants operating with supercritical steam conditions play a vital role over sub-critical plants. In addition to efficient operation and less generation of CO2 the added advantage of using supercritical technology is to emit less SOX and NOX.
Another option to mitigate CO2 emissions is to adopt an “integrated gasification combined cycle” (IGCC) process for power generation. Since the IGCC process does not fall under the discussion of conventional thermal power plant, this chapter refrains from elaborating IGCC further.
(Detailed treatment of supercritical power plants was presented in Section 2.10, Chapter 2, Steam Generators).
14.4 Methods of SOX Emission Control
According to the guidelines laid out in the U.S. “Clean Air Act Amendments (CAAA)” of 1990, SO2 emission from a coal-fired power plant stack to atmosphere is controlled by adopting any one or combination of following two methods [13]:
During the initial stage, coal switching became more attractive to the utilities because of the cost of complying with the CAAA mandate. Subsequently it was realized by utilities that switching to low sulfur coal in existing boilers lead to various problems, as discussed in the following, since by and large low sulfur coals are low-ranking coals with higher ash content and lower heating value:
1. Combustion of low-ranking coal seriously affected heat transfer across various zones resulting in unacceptable generation of steam from boiler
2. Performance of pulverizer got worse
3. Lower heating value coal essentially required more total air to ensure complete combustion, thus capacity of existing ID and FD fans became inadequate
4. Higher flue-gas flow caused higher gas side erosion
5. The capacity of existing ash-handling system was inadequate for complete evacuation of ash generated
Utilities, however, observed that fuel switchover was only amenable for adoption in retrofit projects. Eventually FGD became attractive and continues to control SO2 emission through stacks of pulverized coal-fired boilers to comply with local pollution control regulations in each nation.
SO2 gas is acidic in nature and hence chemicals that may be used to remove SO2 from flue gases must be alkaline, i.e., limestone (CaCO3), hydrated lime {Ca(OH)2}, magnesium hydroxide {Mg(OH)2}, etc. A natural alkaline that may be used to absorb SO2 is seawater.
Based on experience an FGD system can be classified into seven categories as discussed in the following sections.
14.4.1 Wet scrubber
A wet scrubber may be used for boiler applications with high- to low-sulfur coals. This is the most widely used FGD technology for SO2 control. In wet scrubbers flue gas enters at the bottom of an absorber tower and exits as clean gas from the top. Both absorption and oxidation take place within the absorber tower. Water is sprayed at the top of the tower through a series of spray nozzles and air is injected through the tower from the bottom at a point lower than the entry point of flue gas. A slurry mixture of calcium-, sodium-, and ammonium-based sorbents, prepared in an external container, is injected into the tower to react with the SO2 in the flue gas. From a techno-economic consideration sorbent that is widely used in operating wet scrubbers is limestone (CaCO3). Next preferred sorbent is lime (CaO). Figure 14.13 shows the schematic arrangement of a typical wet scrubber system.

Limestone units generally operate in a forced-oxidation mode producing gypsum as a by-product. In this mode limestone reacts with SO2 in flue gas producing calcium sulphite (CaSO3). The injected air along with air contained in flue gas first oxidizes calcium sulphite producing calcium sulphate (CaSO4), which in the next step reacts with incoming sprayed water to produce gypsum (CaSO4·2H2O). The corresponding chemical reactions are:
In a magnesium-enhanced wet lime process, about 4–7% (by weight) of magnesium oxide (MgO) is added to quick lime (CaO). This mixture on reacting with incoming spray water results in a slurry of calcium hydroxide (Ca(OH)2) and magnesium hydroxide (Mg(OH)2). The magnesium-enhanced lime-scrubbing reagent reacts with the SO2 in the flue gas producing hydrated calcium sulfite and hydrated magnesium sulfite. Thus this process would not yield gypsum as the end product as is evident from the following chemical reactions:
All limestone units are capable of removing 90–95% of SO2 from flue gas. Magnesium-enhanced lime systems are considered as the most efficient SO2 removal systems, where up to 98% removal can be ensured.
The advantages of wet scrubbers are:
2. SO2 removal efficiency is high
3. Anticipated to run scale-free
4. Reliability and availability are high
5. May remove certain portion of flue-gas residual particulates downstream of ESP
The disadvantages of this method are:
1. Possibility of nozzle plugging
2. Droplet carryover may cause erosion, corrosion of downstream ducting
3. Flue gas may have to be reheated to improve ID fan performance
4. Due to additional pressure drop across the scrubber ID fans may require more power
14.4.2 Spray dry scrubber
Lime (CaO) is normally used as a sorbent in a spray dry scrubber. Prior to spraying into the absorber CaO is hydrated to Ca(OH)2. Hydrated lime is directly injected as spray into the absorber tower, where moisture is evaporated by the heat of flue gas. SO2 and SO3 in flue gas react with hydrated lime within the absorber tower to form a dry mixture of calcium sulphate/sulphite. SO2 removal efficiency of a spray dry scrubber falls within 90 and 95%. It is the second most widely used process to arrest SO2.
The advantages of this process are:
1. Compared with the wet system, the dry system technique is simpler
2. Disposal of dry, powdery waste material is less complicated
3. Absence of wastewater treatment plant
4. Less expensive than wet scrubber
5. Recycle of spray-dryer solids can partly improve sorbent utilization
1. Operational costs are higher
2. Efficiency of dry scrubber is less than that of wet scrubber
3. Suitable for units firing medium to low sulfur coal
4. Flue-gas volume handling capacity of dry scrubber tower is limited; hence, from techno-economic consideration this process is not viable to be adopted in large coal-fired power plants that would require several modules of such tower
14.4.3 Sorbent injection system
A sorbent injection system is the simplest method of SO2 removal from flue gas. Sorbent generally used in this system are limestone (CaCO3), dolomite (CaCO3·MgCO3), lime (CaO), or hydrated lime (Ca(OH)2). Based on location of injection of sorbent, this system is classified into furnace sorbent injection (FSI), economizer sorbent injection (ESI), duct sorbent injection (DSI) (Figure 14.14), and hybrid sorbent injection (HSI) process. In all these types the effectiveness of SO2 removal depends on how evenly and quickly the sorbent is sprayed across the cross-section of flue-gas stream. The solid waste obtained downstream of each process is removed in the dust-collecting equipment.

In a furnace/post furnace sorbent injection system (FSI) powdered dry sorbent (usually limestone or hydrated lime) is sprayed into the entire cross-section in the upper part of the furnace, where the temperature is maintained above 1023 K but not more than 1523 K. When flue gas passes through this zone the SO2 and O2 content of the flue gas reacts with the sorbent to form CaSO4.
The SO2 removal efficiency that may be attained in FSI is 50% or higher based on even distribution of sorbent, fastness of application, ensuring optimum residence time (1 to 2 seconds), maintaining proper sorbent particle size (not more than 5 μ, but preferably less than 3 μ) and adopting Ca:S ratio between 2 and 3.
Sorbent used in an economizer sorbent injection process (ESI) is hydrated lime. When flue gas flows through the economizer zone its temperature remains between 573 K and 923 K. At this temperature range when sorbent is sprayed into the flue-gas stream Ca(OH)2 reacts with SO2 to produce CaSO3 instead of CaSO4.
In a duct sorbent injection (DSI) process sorbent is sprayed into the flue-gas stream at a temperature around 423 K, located downstream of air pre-heater. Along with the sorbent some water may also be sprayed to humidify the flue gas with the precaution that humidity always remains above the dew point. SO2 removal efficiency of this process could be as high as 80%.
Adopting FSI in combination with DSI is called a hybrid sorbent injection (HSI) process. This combination results in higher sorbent utilization and greater SO2 removal. With humidification SO2 removal efficiency of HSI can be boosted up to 90%.
14.4.4 Dry scrubber
A circulating fluidized bed (CFB) involves a scrubbing technology known as a dry scrubber process. In this process, hydrated lime, limestone, or dolomite and water are intimately mixed with flue gas in a dedicated reaction chamber, which is the fuel-firing bed. Reacted solids get dried completely by the sensible heat of the flue gas. The process is easy to maintain and operate since it does not include high-maintenance mechanical equipment. The process can achieve about 95% SO2 removal efficiency. Because of high SO2 removal efficiency the Ca:S ratio (1.2–1.5) of the dry scrubber process is less than that of the sorbent injection system. (For more information, refer to Section 5.4, in Chapter 5, Fluidized Bed Combustion Boilers.)
14.4.5 Regenerable process
In a regenerable process SO2 removal efficiency is very high (>95%), but the process suffers from high cost and high power consumption. In this process, once SO2 is removed, the sorbent is regenerated for further use. As a result, this process provides an advantage of low sorbent make-up requirement. Another advantage of this process is it produces virtually no residual solid or liquid wastes. The sorbent may be regenerated either thermally by heating it to a temperature of about 923 K or chemically by bringing the sorbent in intimate contact with steam and a reducing gas, i.e., H2S, H2, and natural gas.
The process involves stripping of SO2 from flue gas by scrubbing action of sodium sulfite solution or organic-amine liquid absorbent. Use of other chemical solutions is also possible, but currently this approach is at the research stage.
14.4.6 Combined SO2/NOx removal process
This process involves injection of ammonia in the flue gas upstream of a selective catalytic reduction (SCR) unit for NOX control and injection of sorbent for SO2 control. As a result this process is relatively complex and capital intensive and also requires lot of maintenance. This process still is in the development stage. Nevertheless, some field results show more than 70% SO2 removal and about 90% NOX removal by the combined process.
14.4.7 Seawater FGD
Seawater FGD is attractive to plants that are located near coastlines. Seawater is a source of natural alkalinity that can be used economically to arrest SO2 from flue gas without the use of any other supplemental reagents. Seawater contains significant concentrations of alkaline ions including sodium, magnesium, potassium, calcium, carbonates, and bicarbonates. It also contains significant concentrations of chloride and sulphite ions. Desulfurization is accomplished by seawater scrubbing, and 90% SO2 removal efficiency could be achieved by adopting this process.
Before entering into the seawater scrubber flue gas is cooled to its adiabatic saturation temperature of typically 365 K. The scrubber is packed with certain material proprietary in nature through which flue gas flows from the bottom and seawater is sprayed counter-current to the flow of flue gas in order to achieve effective SO2 mass transfer and chemical absorption into the liquid phase. Thus, SO2 in the flue gas is absorbed and converted to sulphite first. Sulphite is further oxidized to produce sulphate for safe disposal to the sea without jeopardizing the marine environment. For disposal of liquid effluent to sea, it should be ensured that liquid effluent is alkaline with a pH no less than 8.
14.5 Methods of NOx Emission Control
Oxides of nitrogen are generally referred to as NOx, comprising both nitric oxide (NO) and nitrous oxide (NO2). During the combustion of fossil fuel in a conventional boiler NOx is formed of which NO accounts for 90–95% and the remainder is NO2. NOx is formed in the flame-zone vicinity by oxidation of nitrogen content of air (thermal NOx) and nitrogen content of fuel (fuel NOx) as well as by oxidation of intermediate hydrocarbons present in flames (prompt NOx). The average temperature in the vicinity of the flame zone is about 1477 K with a peak temperature as high as about 1922 K.
The direct high-temperature reaction of atmospheric nitrogen with oxygen results in thermal NOx. If the combustion temperature can be reduced by supplying less combustion air production rate of thermal NOx will drop. Fuel NOx formation, however, is not significant near the flame zone, and most fuel NOx is formed in the secondary combustion zone along with the release of volatile matter. For burning natural gas fuel NOx generation is insignificant. In a coal-fired power plant contribution of prompt NOx is negligibly small. However, it is important in gas-turbine power plants where ultra-high level emission is considered.
NOx is harmful in several ways – as a contributor to acid rain, as a destroyer of the ozone layer, and as a heat-trapping compound suspected of increasing atmospheric temperatures. At low elevations, NOx also reacts with sunlight to create smog.
To control NOx emissions from fossil-fuel-fired combustors, in accordance with the US Clean Air Act Amendments of 1990 (CAAA), alternative techniques that are made available to utilities are use of low-NOx burners (LNB), or adopting fuel biasing, or limiting the excess-air (LEA) in the combustion process, or application of over-fire air (OFA), or injecting steam or water into the flame, or recirculating flue gases. All these techniques seek redistribution of air and fuel, causing slow mixing of air and fuel, reduction of O2 level in critical NOx formation zones, and lowering of the amount of fuel burned at peak flame temperature. Other techniques that are available are back-end controls like selective catalytic reduction (SCR) and selective non-catalytic reduction (SNCR) systems [14].
The following sections discuss the techniques that are usually adopted.
14.5.1 Burner replacement
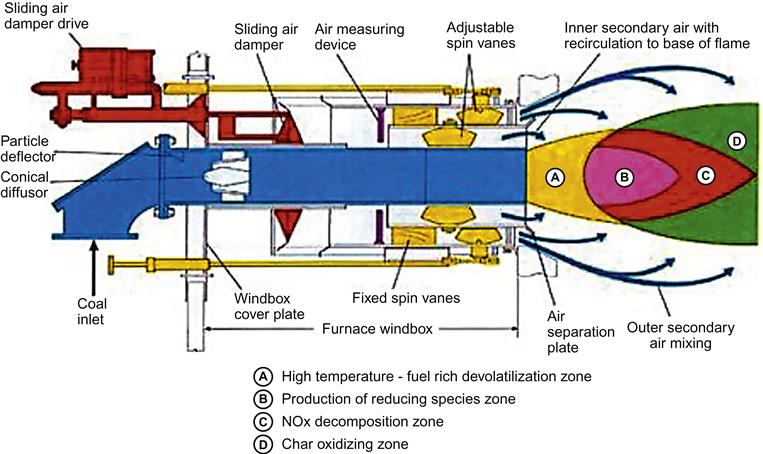
This method is normally adopted for retrofitting purposes. Old burners, which were not designed to meet currents standards for maximum NOX emission, are replaced with low NOx burners (LNBs). Figure 14.15 and Figure 14.16 show the cross-sectional details of typical LNBs from different manufacturers. These burners facilitate mixing of fuel and air in a controlled way to provide larger and more branched flames. As a result, the peak flame temperature is reduced, resulting in less formation of NOx.


Within the flame four different processes take place as follows (Figure 14.17):
i. Initial combustion takes place in a fuel rich zone, where NOx is formed
ii. Second process produces a reducing atmosphere where hydrocarbons are formed, which thereafter react with already formed NOx
iii. Final combustion occurs in an air-lean zone; as a result NOx formation is minimized
Use of LNBs, however, suffers from generating higher carbon loss in ash. The burner replacement method in isolation can not meet present-day emission level norm. To make this method effective LNBs are combined with combustion modification as discussed in the following.
14.5.2 Combustion modification
In order to ensure complete combustion with reduced NOx emission, control of fuel and air supply is very important. This is accomplished at the burner as well as inside the furnace. Supply of secondary air and over-fire air facilitates vertical staged combustion. While supply of air at different points along the flame or introducing tertiary air at the burner ensures horizontal staging of combustion.
In addition to the above replacement of burners, adjustable angle over-fire air (OFA) dampers are also installed to quench flue-gas temperature, minimizing formation of NOx. Furnace over-fire air helps in separating combustion air into primary and secondary air to achieve complete combustion. The primary air combines with fuel that produces a relatively low-temperature fuel-rich zone. Then the secondary air is introduced above the burners to complete the combustion also at a relatively low temperature. Thus, N2 is produced in lieu of NOx. The effectiveness of controlling NOx formation by providing OFA dampers has already been “proven.”
Flue-gas recirculation, like over-fire air, quenches the flame and at the same time reduces oxygen level, thereby NOx formation is minimized.
Use of low excess air in the combustion region and then re-burning fuel-rich mixture above this region provides fuel staging. Fuel staging can also be achieved by taking the burner out of service (BOOS). This technique, however, is seldom practiced in pulverized coal-fired boilers. Fuel biasing is another method of fuel staging. In this method, the fuel supply is shifted from the upper-level burners to the lower levels or from central burners to burners located in the periphery. These types of arrangements create a fuel-rich zone in the lower level and peripheral burners and fuel-lean zone in the upper and central burners. As a result, the flame temperature is reduced, minimizing the formation of NOx, and at the same time, improving the balance of oxygen concentration in the furnace.
NOx formation is inherently minimized in furnaces with large cross-sections. Furnaces that are designed for high heat release rates are susceptible to high NOx emissions, since an air-in leakage can quickly counter weigh low NOx gain. The fundamental concept of low-temperature fluidized bed firing yields low NOx emissions. (For additional information refer to Chapter 5, Fluidized Bed Combustion Boilers.)
14.5.3 Steam or water injection
In oil/gas-fired combustors flame quenching is performed through the use of water or steam injection, resulting in lower peak flame temperatures. This technique is mainly adopted in gas turbines. The added benefit of adopting this technique is a boost in power output as a result of greater mass flow. This technique, however, demands ultra-pure water, since even a minute presence of alkali in the combustor may destruct the gas turbine operating at an inlet temperature of 1423 K or above.
14.5.4 Selective catalytic reduction (SCR)
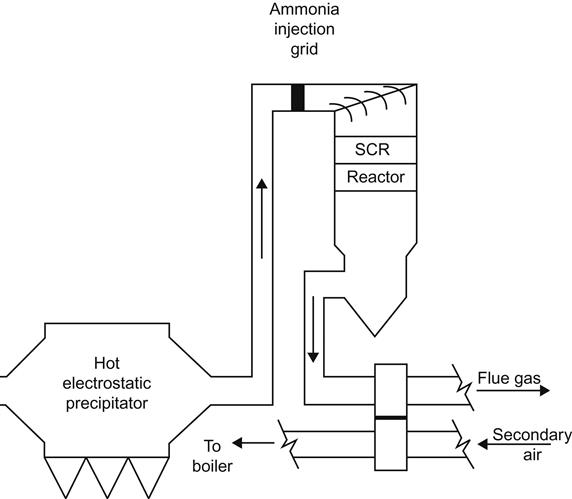
In the SCR process ammonia vapor is used as a reducing agent. This vapor is injected into the flue-gas stream in the presence of a catalyst, thereby converting NOx into H2O and N. In the absence of a catalyst these reactions take place at temperatures between 1143 and 1478 K, but in the presence of a suitable catalyst these reactions may take place at much lower temperatures of 573–673 K, normally prevalent at the economizer outlet. Common catalytic materials are aluminium oxide (Al2O3), vanadium pentoxide (V2O5), titanium dioxide (TiO2), tungsten trioxide (WO3), silicon dioxide (SiO2), zeolites (e.g., alumina silicates), iron oxides, activated carbon, etc. In coal-fired power plants vanadium pentoxide in combination with titanium dioxide is mostly used as a catalyst. SCR system can accomplish over an 80% reduction of NOX from flue gases [14].
In coal-fired power plants, the SCR system is placed in three typical locations: between ESP and FGD in low dust configuration (Figure 14.18) or between economizer and air heater in a high dust system, especially with dry bottom boilers (Figure 14.19), or after the FGD (Figure 14.20), primarily with wet bottom boilers with ash recirculation to avoid catalyst degradation.


14.5.5 Selective non-catalytic reduction (SNCR)
In the SNCR process a reagent, i.e., urea, ammonium hydroxide, anhydrous ammonia, or aqueous ammonia, is injected into flue gases in the furnace within the appropriate temperature zone, typically in the range of 1173–1373 K [14]. The NOx and the reagent (urea, etc.) react to form N2 and H2O and do not require a catalyst. The process is relatively simple, but highly sensitive to ammonia slip. In the event of any ammonia slip it will react with SO3 in flue gas to form ammonium bisulfate, which would tend to precipitate at a temperature generally prevailing at air heater and lead to fouling and plugging of air heater. This process can continuously achieve 40–70% NOx reduction. Generally, it is difficult to use SNCR in larger fossil-fired furnaces and in gas turbines, but it is widely applied to fluidized-bed-boilers in cases where further reduction of NOx from flue gases is needed.
SNCR is an ideal retrofit technology and is compatible with other techniques (i.e., low- NOx burners, OFA, FGR, gas reburning, etc.). Along with combustion modification, SNCR facilitates even higher reduction of NOx.
The major disadvantage of the SNCR process is that it has a tendency to produce nitrous oxide (N2O), which propagates the greenhouse effect.
14.6 Reduction of Mercury Emission
Mercury emission from coal-fired power plants to the environment is a pollutant of concern, since it is toxic and accumulates in the food chain, even though mercury is contained in coal as a trace element. Mercury is emitted from coal-fired power plants in three different forms: mercury oxides, elemental mercury, and mercury in particulate form. Mercury oxides are soluble in water, and thus could be captured in wet scrubbers, and the particulate mercury gets separated from flue gases through the collecting process in ESPs or bag filters. It is the elemental mercury that may escape to the atmosphere through the stack, but could be mitigated by injecting sorbents such as “powdered activated carbon” (PAC) [15].
From this discussion it is evident that conventional techniques that control other air pollutants, discussed above, in combination (Figure 14.21) can reduce emission of mercury from coal-fired power plants to safe airborne limit.

The United States was the first country where federal rule was put in place to reduce emission of “inherent mercury of coal” from new and existing coal-fired power plants.
14.7 Problems
14.1 In a coal-fired plant ultimate analysis of various elements of a sample of coal burned by weight was C=44.2%, H=3.4%, O=7.5%, N=1.5%, S=0.4%, M=8.0%, and A=35%. Considering 8000 hrs of operation per annum determine the reduction in CO2 emission from a 600 MW plant if the plant-operating configuration changes from sub-critical to supercritical. Given:
i. Efficiency of sub-critical unit=38.62%
ii. Efficiency of supercritical unit=41.61%
iii. Economic life of the plant=30 years
(Note: Table 3.4 shows 1 kg of C produces 3.664 kg of CO2)
(Ans.: 8.36×10⁶ ton)
14.2 Products of combustion from a pulverized coal-fired boiler are traveling through an ESP at a temperature of 413 K. If the potential difference between the discharge electrodes and the collecting electrodes is maintained at 70 kV and the spacing between these electrodes is 150 mm, calculate the migration velocity of dust particles flowing through the ESP having a mean diameter of particles as (i) 0.48 μm and (ii) 4.8 µm. Given: viscosity of gas at 413 K is 3.01×10⁻⁵ N.s/m2.
(Ans.: (i) 2.64 cm/s (ii) 17.39 cm/s)
14.3 Ultimate analysis of a sample of coal was found to contain various elements by weight as: C=42.5%, H=2.7%, O=8.0%, N=0.8%, S=0.4%, M=7.9%, and A=37.7%. If the maximum dust concentration downstream of ESP is 100 mg/Nm3, find the required SCA of this ESP using the Deutsch–Anderson equation. Given:
Quantity of coal burned=110.76 kg/s
Quantity of fly ash=80% of total ash generated
Moisture content of air at 60% RH and 300 K=0.013 kg//kg dry air
Effective migration velocity=3.5 cm/s
14.4 In a coal-fired steam generator 60.67 kg of coal is burned per second with excess air of 32%. Flue gas, containing 90% of total ash generated, passes through an ESP at a temperature of 399 K. Emission downstream of the ESP is maintained within 50 mg/Nm3. If the volume of dry flue gas and wet flue at the ESP inlet are 413.33 m3/s and 444.60 m3/s, respectively, determine the inlet dust burden, the Deutsch–Anderson efficiency, SCA, and total collecting area (TCA) of this ESP considering 3.15 cm/s effective migration velocity. Ultimate analysis of coal by weight is given as:
(Ans.: DCI=92.68 gm/Nm3, η=99.95%, SCA=241.3 m2/m3/s, TCA=107282 m2)
14.5 The TCA of an ESP is noted to be 33880 m2. Find the height and length of collecting electrode per field of this ESP if the aspect ratio is 2.5, number of fields in series is 7 and number of parallel collecting electrodes is 31. (Note: Barring two extreme electrodes, dust particles get collected on both sides of all intermediate electrodes.)
(Ans.: Height=15.03 m Length per field: 5.37 m)