The purpose of computing is insight, not numbers.
—R. W. Hamming
I have always wished that my computer would be as easy to use as my telephone. My wish has come true. I no longer know how to use my telephone.
—Bjarne Stroustrup (originator of C++ programming language)
The traditional decision support system /data warehouse (DSS/DW) approach works well with large databases and structured data. However, decision-making often involves more than structured data. It also uses very large databases consisting of considerable amounts of unstructured data—Big Data.
As described in Chapter 13, Big Data refers to the terabytes and petabytes of data collected for trend analysis, among other uses. What is not mentioned in Chapter 13 is that Big Data is almost always unstructured data. Although Big Data and unstructured data are not the same, the two share a considerable overlap in the literature as well as the real world.
Structured, Unstructured, and Semistructured Data—Another Small Digression
What is structured data? That’s an easy question. Go back to Chapter 8 and the punched-card era of data processing. A card (record) might reserve the first 10 columns (positions) for CUSTOMER FIRST NAME, the next 25 positions for CUSTOMER LAST NAME, and the next 8 for ACCOUNT NUMBER. Further, the program or the DBMS might indicate that CUSTOMER FIRST NAME and CUSTOMER LAST NAME are text fields, while ACCOUNT NUMBER is an integer. The system knows each field’s name, its length, its data type, and, if it is in a data dictionary, its definition. This is structured data—the bread and butter of computer processing.
If its structure is known, then systems can easily display it, modify it, and use it in any way its definition allows. It is ideal for application programs as well as information managers. The RDBMS is the poster child for structured data—if it is stored and used in an RDBMS, then it is probably structured.
Unstructured data do not have the well-defined pedigree of structured data. There might not be any distinction between record and field, and the length might be unknown as well as its data type. In addition, unstructured data are also often sparse data, meaning that much of their significance, even their existence, is tenuous. The archetype for unstructured data is text; but pictures, videos, and anything not easily classifiable are often labeled unstructured. Popular belief is that 80 percent of all data are unstructured.
Text is an interesting example of unstructured data because while the values “Y” and “N,” for yes and no, are text, they are easily supported by RDBMS operators. So is CUSTOMER LAST NAME, which can be easily used as a secondary key or in a secondary index. On the other hand, the Bhagavad Gita is not easily supported by a RDBMS and is usually considered unstructured and relegated to BLOB status (a cinematic way, after the movie The Blob, of saying it doesn’t really belong in a DBMS but we will put it here anyway). Where is the line between structured and unstructured? Nobody knows. Then again, maybe it is unimportant, because the previous neat, simple, and clean definition of unstructured is totally wrong.
The newest member of the structured-unstructured trio is semistructured data. Only it isn’t new. Computers entered the newspaper industry in the mid-1960s—more than a decade before that ANSI coffee break conundrum mentioned in the previous sidebar. Printing instructions (i.e., style, size, bold, etc.) were conveyed to the typesetter using a set of markup codes or tags embedded in the text. The tags tell the typesetter where to start new paragraphs, break a line, add italics, bold a name, or underline a word. Tags can also be used to indicate proper names, numerical values, and dates. Is such a document structured or unstructured? The answer is, both.
These structure distinctions took on additional importance with the advent of NoSQL and similar systems. While traditional DBMSs work with structured data, some NoSQL systems were specifically designed, according to their vendors, to store unstructured data. Other NoSQL products are advertised as working with semistructured data. Adding to the confusion, a review of technical magazines, blogs, and advertising literature indicate that there is widespread disagreement about whether a particular product handles unstructured or semistructured data.
The fly in the whole structured-unstructured ointment is semistructured data. If one understands that, then the whole structured-unstructured problem disappears.
Data are semistructured if
They are not structured, meaning that they do not fit the punched card/RDBMS mold.
They are not raw data, where raw means there is no way to look inside the data and discern some meaningful information.
How much raw data is there? If you think about it, you will probably conclude not much. Almost any data item contains some embedded information that can be extracted with a little effort.
An example of semistructured data can be found in the data collected by many supermarket chains. They want to better understand what their customers buy, when and where they buy it, what else they buy, and how often they visit the store. In essence, the chain wants to know who, what, where, when, and how much. All but who is captured by most electronic cash registers—they just don’t all catch it in the same way. The data coming in might be a hodge-podge of who, what, where, when, how much data, varying in size, delimiter, and order, and with missing information scattered about. These data are semistructured because they are not structured, but they do contain analyzable information.
If the pundits are correct and only 20 percent of data are structured and little more than 0 percent are raw, then almost 80 percent of the data are semistructured.
How real is this? There are now companies that market products whose sole purpose is extracting meaningful (structured) information from “unstructured” data.
What should one conclude from all this? Well, there are four possible conclusions.
Structured data exist. An example is customer name. A good name for this is structured data.
There is data that are not structurable. An example consists of the babblings of an infant. A good name for this is nonstructured data, meaning they cannot be structured. Luckily there is not a lot of this kind of data.
There are data that are not yet structured. An example is cash register transaction information. A good name for this is unstructured data, indicating that the data is not structured now but could be sometime in the future after processing.
Finally, there are data that, by their very nature, seem unstructured but, nonetheless, contain structurable components. An example is the CEO’s annual report, which contains, in the text of the introductory statement, annual sales figures, products that will be introduced during the coming year, and new retail outlets. A good name for this is semistructured data.
Conclusion 1 is something IT has been dealing with for more than 100 years. IT understands structured data.
Conclusion 2 is accurate, but given the number of cases of nonstructured data that actually exist, it’s rather useless for database design purposes.
Conclusions 3 and 4, while accurate, present a distinction without much difference. Unstructured and semistructured data are sufficiently similar, particularly from a functional perspective, to be used interchangeably.
Like the words flammable and inflammable, unstructured and semistructured are, from a practical perspective, interchangeable, and either can be used.
DSS and Big Data
Table 14-2 in Chapter 14 showcases some of the differences between transaction processing systems and DSSs. Those distinctions can now be expanded (Table 15-1) to include Big Data.
Table 15-1. Difference Between Transaction Processing System (TPS) and Decision Support System (DSS)
Transaction Processing System (TPS) | Decision Support System (DSS) | |
|---|---|---|
Structured Data/Reasonable Volume | Traditional DBMS - High level of structure - Single processor/cluster - Data: Structured - Example: RDBMS - Common database Classification: production or operational | Traditional DBMS - High level of structure - Single processor/cluster - Data: Structured - Example: RDBMS - Common database Classification: Data warehouse |
Unstructured BigData | Nontraditional DBMS - Distributed processing - Data: Semistructured - Example: NoSQL, ex. Cassandra - Common database Classification: Production or operational | ? |
The traditional DBMS, be it SQL Server or Oracle, is most commonly used for transaction processing systems supporting structured data and reasonable volumes, where a reasonable definition of reasonable data is data that can be supported by a single machine or simple cluster (as represented in the top-left quadrant [quadrant 1] of Table 15-1). The TPS repository is usually referred to as the production or operational database.
The traditional DSS database is designed to support user queries and can store and process a reasonable amount of data (Table 15-1, quadrant 2, top-right). Decision support systems with structured data and reasonable volumes tend to use traditional DBMSs, such as DB2 and Sybase (the same as quadrant 1). The most common and appropriate name for the DSS repository is data warehouse.
Big Data transaction processing systems often require specialized (nontraditional) data managers such as those offered by NoSQL vendors (quadrant 3, bottom-left). These systems tend to use distributed processing to support their high transaction volumes (data and process). However, even here, the repository is usually regarded as a production or operational database.
However, Table 15-1 raises the question about the DSS/Big Data quadrant (quadrant 4). NoSQL systems, such as Cassandra, are designed for rapid access of fat records(consisting of multiple occurrences of multiple entities that can be accessed with a single I/O)—a TPS approach—meaning that Cassandra-like systems are not ideal candidates to support a Big Data DSS.
It doesn’t take a doctorate from Trump University to conclude that none of the solutions for the three quadrants will work for the unstructured Big Data DSS quadrant.
Using U3D to Develop a Big Data Decision Support System
If you are building a DSS for an organization that has petabytes of data, then you will probably need a rather unique storage solution. Not immune to the influence of trade journal articles, you might be thinking of products such as Hadoop as a possibility. Good thinking. However, it is still important to go through the four U3D steps for deciding on a technology dictated by the definition and use of the data—and nothing else. Remember the technology escalation rule presented in Chapter 13: use a nontraditional solution only if you absolutely have to.
The steps to create an unstructured Big Data data warehouse are no different than those to create an operational database or a structured data warehouse. U3D works for all database design, regardless of use. Abiding by the U3D steps helps keep the designer’s mind focused on completely understanding the problem before moving on to a solution. In addition, a structured design approach provides proper documentation for those who will have to support your decision. The following sections demonstrate how the same, now familiar, four U3D steps can help the database designer create a database to support an unstructured Big Data warehouse.
Step 1: Transformation
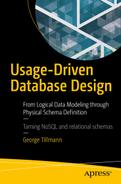
As with any database, the first step in creating an unstructured Big Data warehouse is converting, or transforming, any subject-related logical data models into a physical data model. To build a Big Data employee DSS, the designer needs to scour the data dictionary for any data models incorporating employee-related entities. Figure 15-1 consists of two logical data model fragments showing the Employee entity and its entity neighbors.

Figure 15-1. Employee system and project system logical data model fragments
Not all employee information will be part of existing data models. A look at application programs might turn up some important unmodeled information. Put all of the collected data together and you have a physical data model for the Big Data subject.
Step 2: Utililization
For Big Data, step 2, Utilization, is carried out significantly differently than for an operational database—however, it is identical to the way a designer builds a data warehouse. As described in Chapter 14, the designer should talk to the managers who will be using or feel they will be benefitting from the Big Data DSS to get an idea of what they have planned. The designer should then develop several likely usage scenarios describing how the Big Data will, at least initially, be used. The result should be a set of usage scenarios similar to those created in Chapter 14.
The employee DSS might include the following scenarios:
Usage Scenario 201: What is the average employee salary?
201.1 Enter Employee
201.2 Find Employee History
Usage Scenario 202: What is the average employee tenure?
202.1 Enter Employee
202.2 Find Employee History
Usage Scenario 203: How many projects does the average employee work in a calendar year?
203.1 Enter Employee
203.2 Find Employee Role
203.3 Find Project
Usage Scenario 204: How many roles are unique to a project?
204.1 Enter Role
204.2 Find Employee Role
What is the fact record ? Following the rules presented in Chapter 14, there are two candidates, Employee Role and Employee History. However, because both keep track of an employee’s history, the two can be combined into one record type, called the Employee Detail record type, yielding the rationalized physical data model in Figure 15-2.
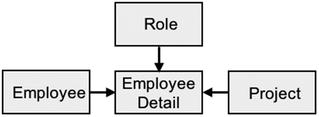
Figure 15-2. Rationalized physical data model
The result is a perfect star, but this is largely because of the simplicity of the example. In most real-world cases, the resulting PDM will look more like a snowflake than a star. The Employee Detail record (a combination of Employee History and Employee Role) is the fact record (or fact table), and the Role, Project, and Employee records are the dimensions.
Step 3: Formalization
Formalization is no different for a Big Data DSS than for any operational or traditional DSS database. The designer should develop a database design to support the DSS. It just might be the case that a traditional DSS/DW approach can support the application. However, given Big Data’s volume and structure, most cases will require a quick trip to step 4, Customization.
Figure 15-3 is the employee data warehouse database design. Note the following:
The fact record is Employee Detail, which is a denormalized combination of the Employee History and Employee Role record types.
A Time dimension is added.
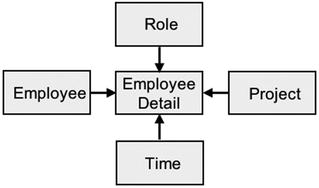
Figure 15-3. The employee Big Data data warehouse
The database design in Figure 15-3 should work with most traditional DBMSs.
One issue might preclude use of some traditional systems. The Employee History and Employee Role record types were combined to form the Employee Detail because both meet a number of fact record requirements. Both are associative or attribute record types, both are at the many end of multiple one-to-many links, and both are the most populace record types in their respective systems. Both also store similar (although not identical) information. However, combining them will mean that the composite record type could have some empty (blank or null) data fields, and in certain situations, one or more of these fields could be part of the primary key. The DBMS for this DSS will need to support sparse and probably semistructured data.
If it is obvious that a traditional system will not handle the required volumes or types of data, then why should the designer go through step 3? Why not skip Formalization and go directly from step 2, Utilization, to step 4, Customization?
The answer is simple. The choice of a nonstandard solution needs to be a conclusion and not a premise. The whole purpose of U3D is to make all decisions demonstrable and justifiably through proper documentation. The designer needs to prove that a standard solution will not work.
An example is useful. Assume that the proposed employee DSS will house multiple terabytes of structured (i.e., name, employee number, etc.) and unstructured data (i.e., annual performance reviews, examples of reports produced by the employee, articles in which the employee is mentioned, photos, etc.). The most economical solution is a traditional data warehouse (one or more of which the organization might already have) if it will support the proposed system. Purchasing a nontraditional system, even one that is open source, can involve hundreds of thousands of dollars in software, hardware, additional staff, and training costs. Not acquiring Hadoop when Oracle can support the proposed DSS could make the designer a corporate hero. Unfortunately, spending 11 months trying to make Oracle handle the new DSS and failing is a poor career move. The designer needs to know—not guess—which architecture and products are the right ones and to be able to defend that decision to colleagues, users, and management. A little U3D effort could be a good career strategy.
Step 4: Customization
It might very well be the case that the traditional DSS/DW approach simply will not work for the proposed system. High data volumes and/or unstructured data will force the designer to look elsewhere for a solution. One possible solution is an architecture similar to that of Hadoop.
A Little About Hadoop
Hadoop is not a product but rather a family of products. The core of Hadoop, both figuratively and literally, is two products, Hadoop Distributed File System (HDFS) and MapReduce. HDFS allows data to be stored in a large number of nodes, collectively called a cluster. A single file might be distributed and replicated across multiple nodes within the cluster. The distribution—one file broken into multiple parts (called blocks)—allows parallel processing of a single file, while replication—storing multiple copies of the same data (blocks) in multiple locations—provides high availability and backup. With HDFS and a sufficient number of inexpensive servers (could be hundreds or even thousands of machines), terabyte files are not only possible but in use today.
MapReduce is the application framework that oversees how files are processed by assigning application programs to various nodes. MapReduce copies and sends computer code to servers where there are data waiting to be processed.
To really understand Hadoop, it pays to look at how conventional data processing—particularly distributed data processing—works. Imagine a distributed environment as a pyramid. At the top of the pyramid is the application program. As the job executes, the data manager finds the data required by the application, copies them to the server where the program is running, and returns them (if there were modifications) to their original location.
Hadoop inverts the pyramid or, perhaps more accurately, places the data at the top of the pyramid. If you look at the typical Big Data job, the size of the application (in bytes) is dwarfed by the size of the data. So why do systems move the data (the larger component) to the application (the smaller-sized component)? Would it not be more efficient to move the smaller application to the larger data? That is what MapReduce does—it moves applications to the nodes where data need to be processed.
Immediately, two advantages are evident. The first, as mentioned earlier, is there is less traffic between nodes. Shipping data between nodes is incredibly expensive. HDFS’s philosophy is that data are stored once and almost never move. The second advantage is that it makes distributed processing more efficient.
For decades, parallel computing has been the great hope and the great disappointment of IT. Being able to process the same data sets on multiple machines simultaneously is an efficient and inexpensive way to improve computing performance. Unfortunately, accomplishing this goal has often required complicated and convoluted code. Getting the right data into the right CPU at the right time is difficult, requiring coordination between the program components running on different machines (what do you do if two machines want to update the same data?). If data are updatable, then cross-machine locking and journaling mechanisms are needed. A simpler, though more disappointing solution, is to have the different nodes do entirely different though related tasks, thus reducing, if not eliminating, the need for process coordination.
The Holy Grail of distributed processing is to have a one-to-one (1:1) relationship between hardware and throughput. Ideally, doubling the hardware doubles the throughput, tripling hardware triples throughput, and so on. Traditional distributed processing is far from attaining the ideal 1:1 relationship. Worse, as hardware is added, the ratio degrades, and as more and more hardware is added, the drop can become precipitous.
Hadoop’s MapReduce comes closer to the sought-after 1:1 ratio than traditional distributed processing, making it a desirable platform for very large data files.
However, there is a case where the MapReduce/HDFS model does not work well—Small Data. Considerable work and execution time is required to set up a MapReduce/HDFS cluster-wide process. This effort makes sense if the data file is very large. It makes no sense if the data file is small. Have a database with 2,000 records? Excel will fetch the desired record faster than Hadoop. Where is the cutoff point—the point where it makes sense to consider Hadoop? Opinions differ, but most agree that if your database fits on four or fewer servers (CPU and disk), then skip Hadoop.
Many IT professionals compare Hadoop to products such as Cassandra, MongoDB, and other NoSQL DBMSs. However, as explained previously, Hadoop is not a DBMS but a family of products, best described as data management middleware, which includes a DBMS. Hadoop’s DBMS, named HBase, shares many similarities with its cousin Cassandra (both are supported by the Apache Software Foundation). If you are a Cassandra expert or an HBase expert, then you are likely convinced that Cassandra and HBase have little in common. For the rest of us, they are very similar. Both are key-value column-family data stores. Both use SQL-like terminology to describe their components (table, column, row, etc.). Both use fat records consisting of multiple occurrences of multiple entities stored contiguously to achieve single I/O retrieval. And the list goes on.
HBase is a viable substitute for Cassandra in the Big Data transaction processing space. However, along with its strong points, HBase shares many of Cassandra’s shortcomings. Neither Cassandra nor HBase is a great candidate for DSSs. Their internals are designed for one I/O retrieval of fat records. Supporting a query by reading thousands or millions of records will require a database scan that could take eons to complete. Both products disdain indices—a DSS mainstay—as expensive substitutes for hashing.
Fortunately, the Hadoop family also includes another product—Hive. Hive is a SQL-like product that can front-end both MapReduce and HDFS . Hive can also create its own relational-like database stored in its own workspace. The Hive users think they are querying a relational database, but the data they are using might be in HDFS, in a native Hive file, or in some third-party database.
Of course, there are some prices to pay for this access. First, because Hive data are often HDFS data, they do not have a normal schema. In fact, they do not have a schema at all until runtime.
Traditional DBMSs bind data to the schema when the data are written to the database. This is called schema on write. As the data are read into the database, the DBMS reads the schema and confirms that the data are as defined (size, data type, etc.). Conforming data are stored in the database while nonconforming data initiate an error procedure.
Hive uses a different technology. The bind takes place when the data are accessed. This approach is called schema on read. Any and all data are entered into HDFS willy-nilly. When the data are accessed, the DBMS compares the data in HDFS with the schema. If the data are acceptable to the schema, they are passed on to the user. If the data are unacceptable, an error routine is initiated.
Schema on read is used for systems in which the DBMS has full control of the data in the database. For example, to insert data into an Oracle database, the application must go through Oracle software that keeps track of all data-related activity.
Hive , on the other hand, has control over only data stored in its own workspace. Data stored in HDFS can be accessed and changed by any application running through HDFS. To accurately reflect what is out there, Hive must review all the data in the HDFS file just before processing them. This runtime bind guarantees that the most recent data, in their most recent state, will be part of the query response. However, binding the data to the schema every time it is accessed requires time and resources that the schema-on-write DBMS need only expend once.
Table 15-2 completes the database 4x4 diagram.
Table 15-2. Difference Between Traditional and Big Data TPS and DSS
Transaction Processing System (TPS) | Decision Support System (DSS) | |
|---|---|---|
Structured Data/Reasonable Volume | Traditional DBMS - High level of structure - Single processor/cluster - Data: Structured - Example: RDBMS - Common database Classification: Production or operational | Traditional DBMS - High level of structure - Single processor/cluster - Data: Structured - Example: RDBMS - Common database Classification: Data warehouse |
Unstructured Big Data | Nontraditional DBMS - Distributed processing - Data: Semistructured - Example: NoSQL, ex. Cassandra - Common database Classification: Production or operational | Nontraditional DBMS - Distributed processing - Data: Semistructured - Example: Hadoop - Common Database Classification: Data warehouse |
Using Hadoop, the DSS user can interact with the database in a SQL-like environment that supports terabytes or petabytes of unstructured data.
Putting It All Together
Using products such as Hadoop, the database designer can create an HDFS file storing Cassandra-like fat records but using Hive’s SQL-like commands. The combined structures allow the application or end user to work with a rather traditional DSS star schema. In fact, to the end user or application, the resulting database design can look similar if not identical to the one created in step 3, Formalization (Figure 15-3).
Done correctly, the convoluted machinations needed to assemble this complex structure can be almost transparent to the end user, who sees a structure and processes similar to the more traditional DSS/data warehouse.
Deliverables
The deliverables for a Big Data DSS are the same as those listed in Chapter 14. The only difference is that the Customization notes are even more important now because future DBAs need to know exactly why certain decisions were made regarding such things as the fact and dimension records, the data warehouse structure, usage scenarios, and so on.
As with all other U3D notes, those for a Big Data DSS should include the answers to these four questions:
Why? This would seem obvious. However, why a decision was made the way it was is often an area of confusion for future system maintainers. If an index was added, or removed, it is important to specify why this was done. If Oracle was rejected for the data warehouse, the reasons should be clearly stated.
Where? The notes should reflect exactly where in the database design new concepts were introduced or existing ones changed.
When? Design changes and test results do not always line up. It is important to document exactly when a change was made to a system so its impact can be properly assessed.
Results? There is a tendency for designers to document successes only. Sometimes documenting “fascinating results” (a Spock-ism to avoid saying failures) is more important than successes. Knowing that an index added little to database performance can save valuable time by avoiding reinventing the wheel months or years later. Knowing that a test using SQL Server for the DSS failed is vital information that needs to be shared.
The answers to these four questions are even more important when dealing with performance issues and nontraditional systems. For example, implementing Hadoop can be quite complex, requiring a team of experts with skills in using HDFS, Hive, and MapReduce. The Customization notes should include input from all of these experts (whether in-house or external consultants) and not just the database designer.