6. Tables
In this chapter, you learn techniques for creating and formatting tables within your document.
If you read Chapter 4, “Designs and Layouts,” recall that I mentioned that calendars were actually nothing more than tables to which some nice visual effects had been applied. Making calendars isn’t the only thing you can do with tables, though. Tables can also be used as a means for importing data from an Excel spreadsheet. In this chapter, I show you everything you need to know about working with tables in Publisher 2010.
What Are Tables?
In case you aren’t familiar with tables, they are simply a grid that you can use to display data. Tables are made up of individual cells (rectangles) that are arranged into rows and columns. You can see an example of a table in Figure 6.1.
Figure 6.1 An example of a table.
It is worth noting that even though a table looks a lot like a spreadsheet, it is not a spreadsheet. So what’s the difference between a table and a spreadsheet? Well, one of the most important differences is that tables do not support the use of formulas. Another difference is that spreadsheets number each cell, whereas table cells are not numbered.
Creating Tables
Creating tables in Publisher couldn’t be any easier. The process is similar to what was used in previous versions of Publisher and in other Microsoft Office applications.
LET ME TRY IT
![]()
Create a Table
To create a table, follow these steps:
- Go to Publisher’s Home tab.
- Click the Table icon (the Table icon located on the Insert tab can also be used).
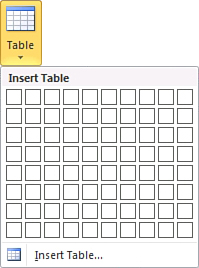
- Use your mouse to select the number of rows and columns you want to include in the table, as shown in Figure 6.2.
Figure 6.2 Select the number of cells you want to include in the table.
Formatting Tables
As you can see, Microsoft makes it really simple to create a table. As you have probably already figured out, though, we aren’t stopping there. There are several different things that we can do to change the table’s appearance. Some of these techniques are identical to things you have already learned in previous chapters. For example, fill effects work similarly for tables as they do for shapes. Other cosmetic effects, such as border art, are unique to tables.
Resizing a Table
At its simplest, resizing a table works the same way as resizing a shape or resizing a text box. All you have to do is select the table that you want to resize, grab the table’s edges, and drag them to the desired location. Likewise, you can click on the lines that make up a cell and drag them to increase or decrease the cell’s size.
I generally recommend making your table the desired size before you begin populating the table’s cells. I say this because when you resize a table, the text within the table’s cells does not automatically increase in size along with the table. It is up to you to manually increase the font size. It is possible, however, to select multiple cells and then increase the font size for the selected cells simultaneously.
LET ME TRY IT
![]()
Resize a Table
As I hinted earlier, although you can grab a table’s edges with the mouse and then drag the edges so that the table grows to the desired size, this isn’t the only way to resize a table. You can achieve a higher degree of control over how large the table becomes. To do so, follow these steps:
- Right click on the table.
- Choose the Format Table command from the shortcut menu.
- When the Format Table properties sheet appears, select the Size tab.
- Set the new table size, and click OK.
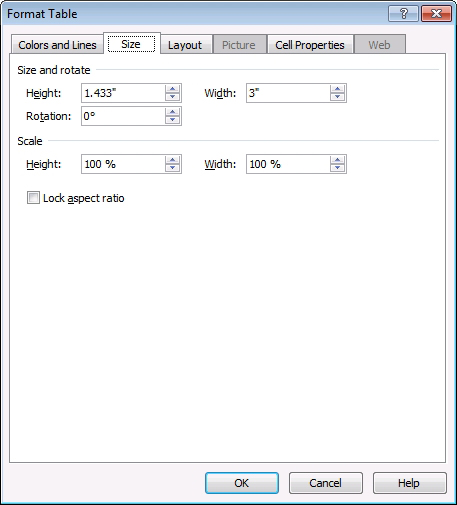
If you look at the Size tab, shown in Figure 6.3, you can see that you can change a table’s size by entering the desired height and width. These values are entered in inches and can include several decimal positions.
Figure 6.3 You can resize a table by entering height and width values.
You might have also noticed in the figure that you can resize a table by scaling it. Rather than entering height and width dimensions, you can simply scale the height and width based on a percentage of the table’s current size. For example, if you wanted to make the table 50% larger, you could set the height and width to 150%.
Sometimes scaling a table can cause the table to become stretched. You can use the Lock Aspect Ratio check box to prevent the table from changing shapes as you change its size.
SHOW ME Media 6.1—Creating a Table
![]()
Access this video file through your registered Web edition at my.safaribooksonline.com/9780132182591/media.
Fill Effects
Fill effects work in exactly the same way for tables that they do for shapes or word art. If you want to change a table’s background, select the Format Table properties sheet’s Color and Lines tab, and click the Fill Effects button. Doing so displays the Fill Effects properties sheet, which gives you the options for filling the table’s background with a solid color, a gradient, a texture, a picture, or a pattern.
Borders
The Colors and Lines tab, which is shown in Figure 6.4, isn’t only used for controlling the table’s background through the use of fill effects. This tab is also used to control the table’s borders.
Figure 6.4 The Color and Lines tab can be used to control the table borders.
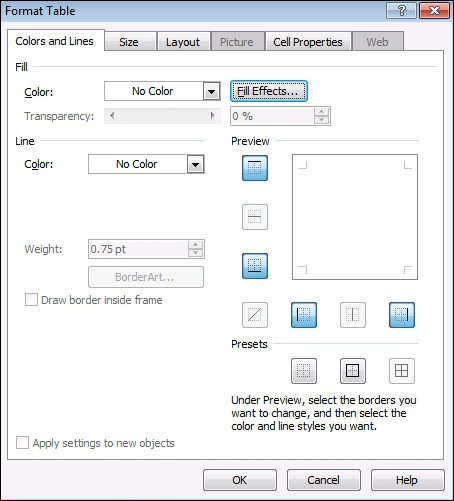
Formatting a table’s borders can actually be a little bit tricky. I have found border formatting to be one of Publisher’s least-intuitive functions.
Although border formatting is a table-level function, the formatting actually is applied to individual cells. With that in mind, the first step in the process is to select the cells for which the border changes should apply. After doing so, right-click on the area that you have selected, and then choose the Format Table command from the shortcut menu. When the Format Table properties sheet appears, select the Colors and Lines tab, shown in Figure 6.4.
As you look at the figure, you will notice a preview area surrounded by a series of smaller squares. These smaller squares act as toggle buttons. Each button represents a portion of the border for the selected cells. You can click a button to enable that portion of the border, and then click the button again to disable it. As you pick border elements, the preview area will remain mostly blank.
Once you have selected the portions of the border that you want to customize, pick a line color and line weight. This causes the preview area to show you what your cells will look like. When you are happy with the preview, click OK and your changes will be applied to the table.
LET ME TRY IT
![]()
Using Border Art
Another thing you can do with table borders is to use border art. I have to confess that I’m not exactly a big fan of this feature, but I wanted to show you how it works. To use border art, follow these steps:
- Right-click on your table’s border.
- Choose the Format Table command from the shortcut menu.
- When the Format Table properties sheet appears, go to the Colors and Lines tab.
- Click the Border Art button. If the Border Art button is grayed out, start over. It can be really tricky to right-click in just the right spot.
- When the Border Art dialog box appears, choose the border you want to use, as shown in Figure 6.5.
- Click OK twice, and then the selected border will be applied to your table, as shown in Figure 6.6.
Figure 6.5 Select the border you want to use.
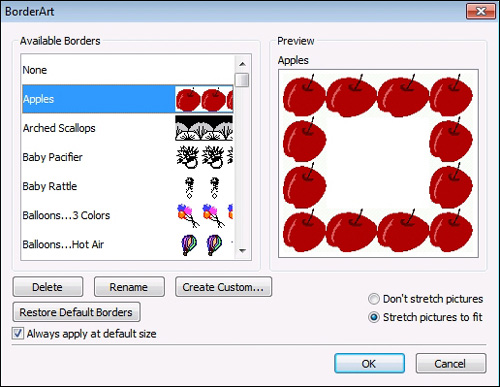
Figure 6.6 The border art you have chosen is applied to the table.
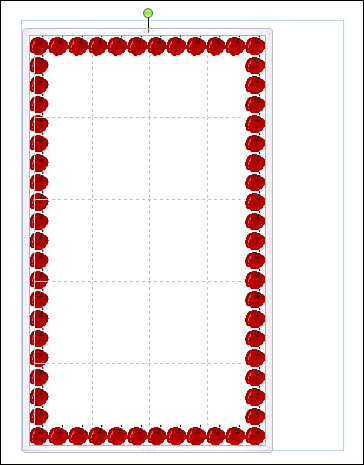
Table Rotation
Although creating and placing tables is a fairly straightforward process, Publisher is all about visual creativity. As such, you might not always want to display tables in the traditional manner. For those times when you want to be a bit more creative, Publisher enables you to rotate your tables.
LET ME TRY IT
![]()
Rotate a Table
Rotating a table is pretty simple to do. You can rotate a table by following these steps:
- Select the table you want to rotate.
- Right-click on the table, and choose the Format table command from the shortcut menu.
- When Publisher displays the Format Table properties sheet, select the Size tab.
- Enter your desired angle of rotation into the Rotation field, as shown in Figure 6.7.
- Click OK to rotate the table.
Figure 6.7 Enter your desired angle of rotation.
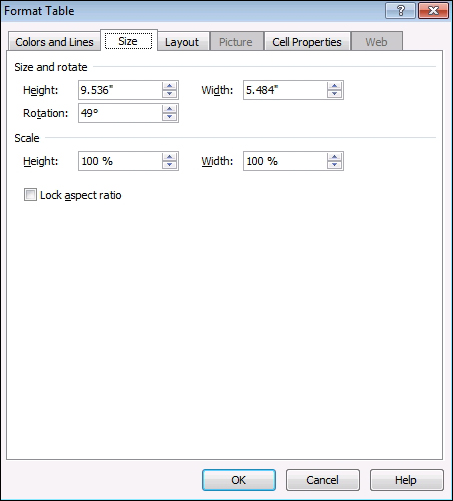
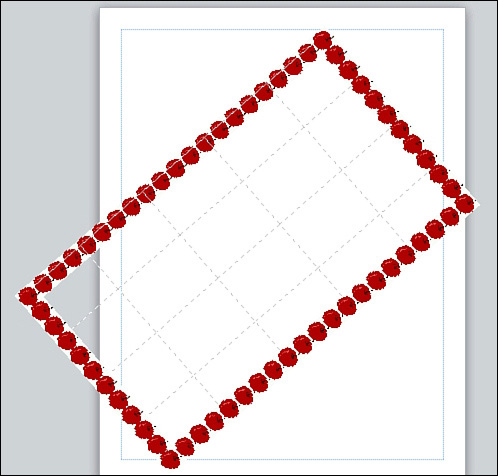
You can see an example of what a table looks like after being rotated in Figure 6.8. In this figure, I have left the border art in place to make the table easier to see.
Figure 6.8 This is what a table looks like after being rotated.
Text Wrapping
I spent quite a bit of time talking about text wrapping in Chapter 5, “Working with Longer Documents,” so I don’t want to repeat everything that I have already talked about. I do, however, want to at least mention that you can wrap text around a table. The method for doing so is nearly identical to what you have already learned.
Wrapping Text Around a Table
To enable text wrapping for a table, complete these steps:
- Right-click on the table, and choose the Format Table command from the shortcut menu.
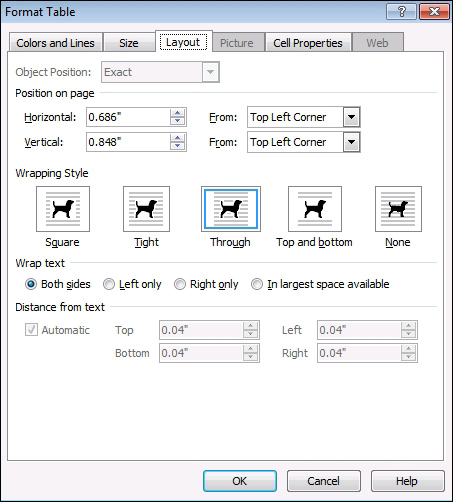
- When the Format Table properties sheet appears, select the Layout tab, as shown in Figure 6.9.
- Choose the wrapping style that you want to apply.
- Click OK.
Figure 6.9 Choose the wrapping style that you want to apply to the table.
Cell Alignments and Margins
As I’m sure you know, a table’s purpose is to display rows or columns of information in an organized manner. Without the proper cell formatting, though, the table can take on a messy (dare I say, illegible) appearance.
Thankfully, Publisher is configured by default to keep this from happening. Publisher automatically sets a 0.4 inch margin at the top, bottom, left, and right of each cell. That way, the text that is displayed in one cell doesn’t bump right up against the text in the next cell. These margins go a long way toward making table data legible.
LET ME TRY IT
![]()
Adjusting Table Margins
In most cases, you probably won’t have to adjust table margins, but you can should the need arise. To do so, follow these steps:
- Right-click on the table.
- Choose the Format Table command from the shortcut menu.
- When the Format Table properties sheet appears, select the Cell Properties tab.
- Enter the new margin sizes into the Left, Right, Top, and Bottom fields.
- Click OK.
Text Rotation
Although the Cell Properties tab, shown in Figure 6.10, is designed primarily for changing cell margins, there are a couple of other handy things you can use it for. One thing is to rotate text within the table, but without rotating the table itself. To rotate the text within the table, just select the Rotate Text Within AutoShape by 90° check box.
Text Vertical Alignment
The other thing you can use the Cell Properties tab for is to adjust the vertical alignment of the text within a cell. By default, table data is aligned along the top of the cell (minus the area reserved for the cell’s margins). You can, however, align the table data to the middle or to the bottom of the cell.
Changing a cell’s vertical alignment isn’t going to make much difference if you are using small cells or if the cells are completely filled with text. The effect becomes much more noticeable with large or sparsely populated cells. You can see an example of the effect of changing a cell’s vertical alignment in Figure 6.11.
Figure 6.10 You can rotate the text by 90 degrees.
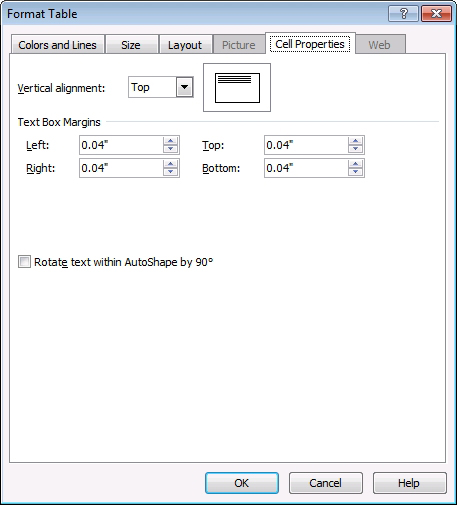
Figure 6.11 Cell alignment becomes more noticeable in large, sparsely populated cells.
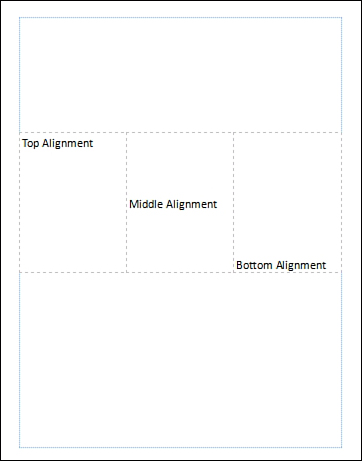
Table Design
So far, I have shown you how to adjust a number of different table formatting options through the Format Table properties sheet. However, most of the options I have shown you are also accessible through the toolbar. When you select a table, Publisher displays a tab called Table Tools. This tab is subdivided into a Design and a Layout tab. Most of the functions I have discussed so far are accessible through the Design tab.
Table Formats
One thing you can do through the Design tab that I haven’t talked about yet is to change the table’s format. A table’s format is essentially just a stylized layout that controls the table’s colors and controls which rows and columns are used as table headers. The Design tab displays a few available table formats by default, but clicking the down arrow next to the Table Formats section causes many more choices to be displayed, as shown in Figure 6.12. In the figure, I have applied one of the formats to a table so you can see what the result looks like.
Figure 6.12 Table formats can change a table’s appearance.
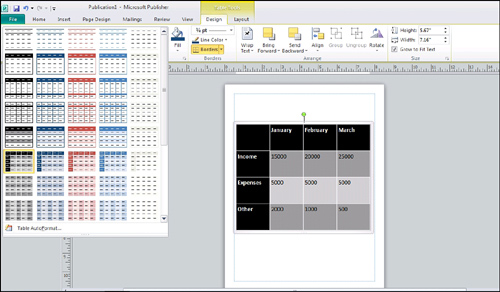
Table Layout
The Table Tools tab’s Table Layout subtab contains a number of options for controlling the table’s appearance and functionality. I have already shown you how to perform many of the Layout tab’s functions through the Table Properties sheet, but there are a few functions that are not available on the Properties sheet, including such things as inserting and deleting rows and columns.
Inserting Rows and Columns
I have found that when I work with tables, inserting rows or columns is one of the tasks that I seem to perform the most often. Even the best-planned tables just seem to evolve as I begin working with them. Thankfully, Publisher makes it simple to insert a row or a column.
Regardless of whether you are going to be inserting a row or a column, the first step is to click on the cell that is going to act as your starting point. Next, decide where the new row or column is going to be located relative to the cell that you have selected. For example, if you are going to be inserting a row, the new row will be placed either just above or just below the cell you have selected. Likewise, a new column would be inserted either to the left or to the right of the selected cell.
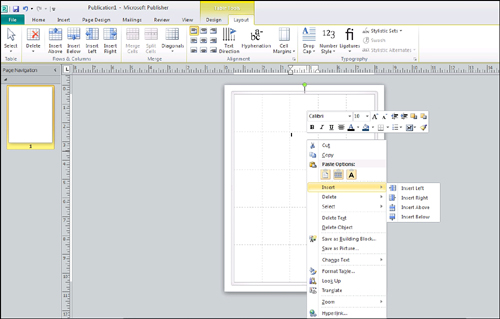
After you have selected the cell that will act as your starting point, simply click one of the Insert icons (Insert Above, Insert Below, Insert Left, Insert Right) found on the toolbar. As an alternative, you can also right-click on the cell and choose the Insert command from the shortcut menu, which you can see in Figure 6.13. This figure also shows the Layout tab and the various Insert icons that appear on the toolbar.
Figure 6.13 Right-click on a cell and choose the Insert command from the shortcut menu.
Deleting Rows and Columns
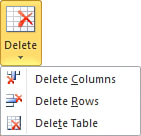
The process of deleting a row or column works similarly to that of inserting a row or column. To perform a deletion, click on a cell that will act as your starting point. Next, click the Delete icon, found on the toolbar. As you can see in Figure 6.14, the Delete menu gives you the choice of deleting the currently selected row or column. There is also an option to delete the entire table, so be sure to exercise caution when using the Delete option. If you accidentally delete something you shouldn’t have, remember that Publisher has an Undo function.
Figure 6.14 You can delete a row, column, or the entire table.
The delete functions are also available by right-clicking on a cell and choosing the Delete command from the Start menu. Doing so causes Publisher to display a sub-menu with options for deleting the currently selected row or column, or the entire table.
Diagonals
If you have worked with tables in any other Microsoft Office product that has been released in the past 10 years or so, I probably haven’t shown you anything you didn’t know. Something that you might never have run into before, however, is the Diagonals option, which enables you to split a cell diagonally.
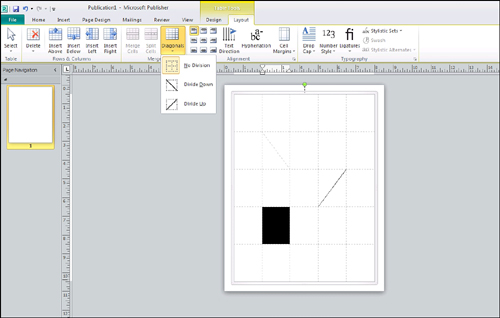
To use the Diagonals function, all you have to do is select the cell you want to split, and then click the Diagonals icon. When you do, Publisher asks you if you want to divide up or divide down. You can see what these options look like, along with a couple of examples of cells that I have split diagonally in Figure 6.15.
Merging and Splitting Cells
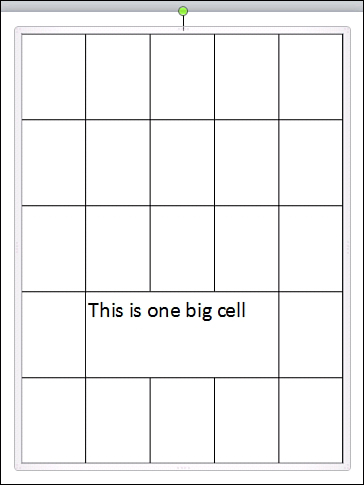
When you create a table, it is common to find that you need to combine some cells into one big cell. Likewise, you might need to split a cell into a bunch of smaller cells. Both of these tasks are very easy to accomplish through Publisher.
Figure 6.15 Publisher enables you to split cells diagonally.
You can merge cells by selecting the cells you want to merge and then clicking the Merge Cells icon. Figure 6.16 shows an example of cells that have been merged to create one large cell.
Figure 6.16 You can merge cells to create one large cell.
Just as you can merge cells, you can also split a cell into many smaller cells. To split a cell, select the cell you want to split and click the Split Cells icon. You can only split cells that have been previously merged. Splitting the cells returns them to their original layout.
SHOW ME Media 6.2—Formatting Tables and Cells
![]()
Access this video file through your registered Web edition at my.safaribooksonline.com/9780132182591/media.
Importing Excel Spreadsheets
So far, I have shown you how to work with tables in Publisher 2010. As I have explained, though, tables have a lot of limitations compared to a full-blown Excel spreadsheet. Should the need ever arise, however, you can insert an Excel spreadsheet into a Publisher document. In this section, I show you how.
LET ME TRY IT
![]()
Creating a Blank Spreadsheet
I want to start out by showing you how to insert an empty Excel spreadsheet into your Publisher document. To do so, follow these steps:
- Go to Publisher’s Insert tab.
- Click the Object icon, located on the toolbar.
- Choose the Microsoft Excel Worksheet option from the list of available objects, as shown in Figure 6.17.
- Click OK.
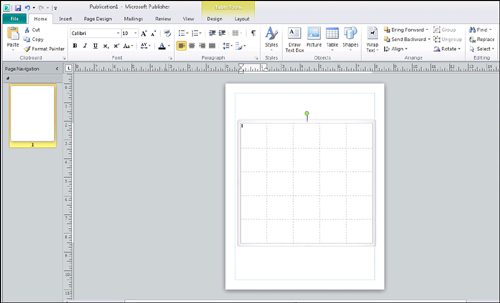
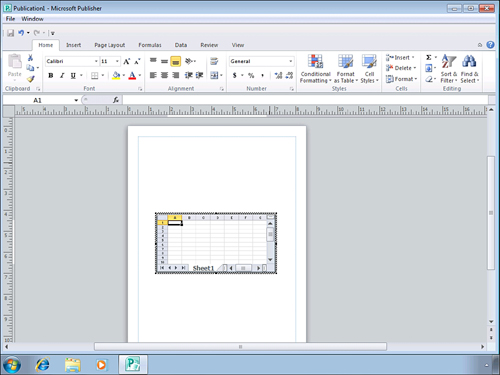
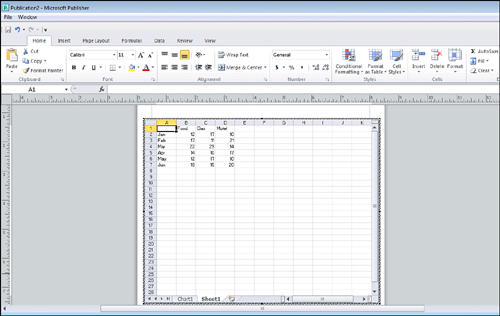
You can see what the recently inserted Excel Worksheet looks like in Figure 6.18. There are a couple of different things you should pay attention to in the figure. First, the spreadsheet exists within a box, which means you can resize and position it using exactly the same techniques you would use for repositioning or resizing any other type of object.
More importantly, though, take a look at what has happened to the menus and the toolbar. We have inserted a true Excel worksheet. As such, any time the worksheet is selected, Publisher essentially becomes Excel. All the menus and the toolbars that are displayed while the spreadsheet is selected belong to Excel. You can go back to the normal Publisher menus and toolbars by clicking outside the spreadsheet.
Figure 6.17 Choose the Microsoft Excel Worksheet option and click OK.
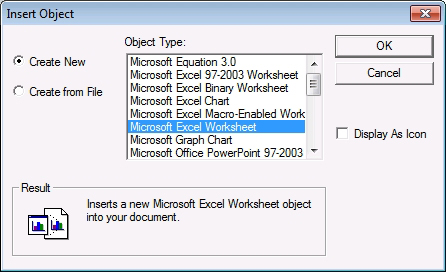
Figure 6.18 You can insert an Excel worksheet into a Publisher document.
Importing a Spreadsheet
Although you can add a blank Excel spreadsheet to a Publisher document, it is usually going to be more useful to import a spreadsheet that has some data in it. To show you how the import process works, I am going to import a spreadsheet that was related to a recent failed expedition to Antarctica. My Antarctic expedition was the very definition of irony because my trip to the coldest place on the face of the earth was canceled due to a freak blizzard in Atlanta, Georgia, of all places. Supposedly it was the first time that Atlanta had seen snow in 16 years.
LET ME TRY IT
![]()
Inserting a Spreadsheet into a Publisher Document
At any rate, you can insert an existing spreadsheet into a Publisher document by following these steps:
- Go to Publisher’s Insert tab.
- Click the Object icon, located on the toolbar.
- Choose the Microsoft Excel Worksheet option from the list of objects.
- Choose the Create From File option.
- Click OK.
- Click the Browse button.
- Choose the spreadsheet that you want to import, and click Open.
- Click OK.
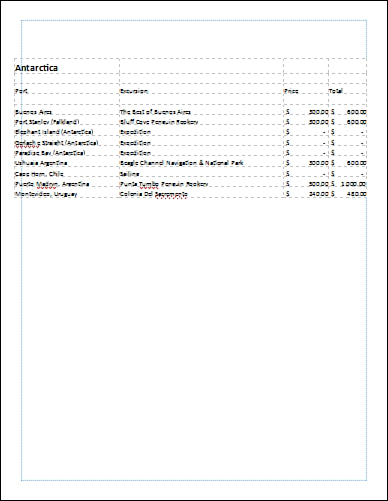
Often, you might find that even very small spreadsheets, such as the one shown in Figure 6.19, exceed the size of the Publisher document. In these cases, it will be necessary to resize the spreadsheet or adjust the page orientation to make the spreadsheet fit properly.
As you look at Figure 6.19, you might notice that most of the spreadsheet’s space is being consumed by unused rows and columns. You can delete unwanted rows or columns by double-clicking them and using the Delete command.
If all your data is located in contiguous cells, you can open Excel and select the cells that you want to copy into your Publisher document. After doing so, press Ctrl+C to copy the cells to the clipboard. Next, switch over to Publisher and press Ctrl+Z to copy the selected cells into the Publisher document, as shown in Figure 6.20.
If your spreadsheet doesn’t use formulas, you might consider pasting its contents into a table. Publisher gives you a higher degree of control over a table’s appearance than it does over the appearance of a spreadsheet.
If you decide to use a table, there is one major drawback of which you need to be aware. If you try to copy and paste an entire spreadsheet into a table, you must have the same number or rows and columns in your table as the spreadsheet that you are importing.
Figure 6.19 Spreadsheets don’t always fit properly when imported.
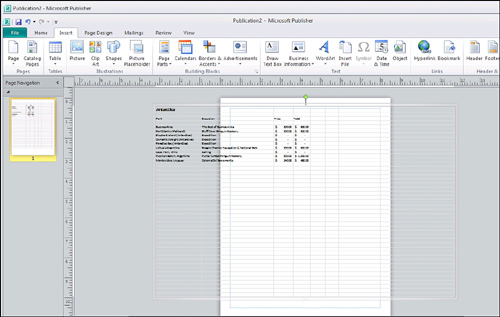
Figure 6.20 You can paste spreadsheet data directly into a Publisher document.
SHOW ME Media 6.3—Importing Spreadsheets
![]()
Access this video file through your registered Web edition at my.safaribooksonline.com/9780132182591/media.
Link Options
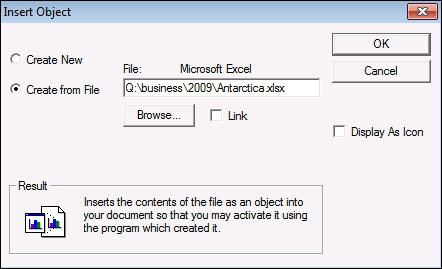
Although you can import a spreadsheet into a Publisher document using the method I have shown you, Publisher gives you a couple of other options as well. If you look at Figure 6.21, for example, you will notice a Link check box. Selecting this check box causes Publisher to display a picture of the spreadsheet rather than actually importing the spreadsheet in its native form. However, the Publisher document remains linked to the spreadsheet, so any changes you make to the spreadsheet are also reflected in the picture of the spreadsheet.
Figure 6.21 The spreadsheet can be linked to a Publisher document.
Display Spreadsheet as Icon
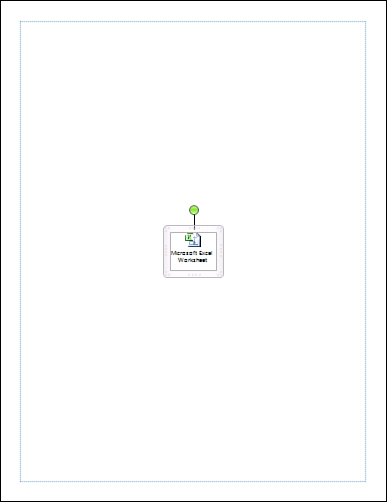
Another option that you might have noticed in Figure 6.21 is the Display as Icon check box. Selecting this check box causes an Excel icon to be placed into the Publisher document instead of having the document display the spreadsheet’s contents. You would normally use this option only if you were using Publisher to create web content. I talk all about using Publisher as a website creation tool in Chapter 9, “Publishing Online.” In the meantime, you can see an example of a spreadsheet that is linked as an icon in Figure 6.22.
Figure 6.22 Excel spreadsheets can be linked to a Publisher document through an icon.
Importing Excel Charts
To be perfectly frank, it is probably rare to import spreadsheet data into a Publisher document. Publisher is designed primarily to create documents with visual appeal, whereas spreadsheets are hard-core business tools. In fact, I can recall only one situation in which real-world circumstances required me to display raw spreadsheet data within a Publisher document. That isn’t to say that I never use Excel and Publisher together, however. Excel can create some rather nice-looking charts, and Publisher offers the perfect medium for displaying them.
Creating a Chart Within Publisher
As with a spreadsheet, you have a choice of either importing an existing chart or creating a new chart directly through Publisher. I start out by showing you how to use Publisher to create a chart, and then I show you how to import an Excel chart. With that said, you can create a chart by completing these steps:
- Go to Publisher’s Insert tab.
- Click the Object icon, located on the toolbar.
- Choose the Microsoft Excel Chart option from the list of available object types.
- Click OK.
Upon completing these steps, Publisher creates a new chart, as shown in Figure 6.23. As you look at the figure, you might wonder what data the chart is reflecting. If you look just beneath the chart, you will notice two tabs, one labeled Chart1 and the other labeled Sheet1. The Chart1 tab contains the actual chart, whereas the Sheet1 tab contains the spreadsheet that was used to create the chart.
Figure 6.23 You can create a brand-new chart directly through Publisher.

As you can see in Figure 6.24, the Sheet1 tab contains a generic spreadsheet, which exists only as a way of helping you get started with creating your chart. Microsoft fully expects you to change all the column headings and replace the data with your own.
Figure 6.24 Charts are linked to a generic spreadsheet.
Designing a Chart
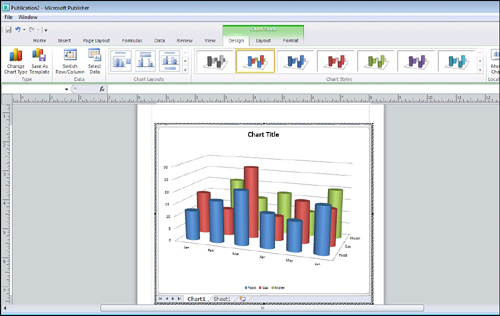
Publisher provides a nearly unlimited set of options for customizing the chart you are creating. If you look at Figure 6.25, for example, you can see that the Design subtab beneath the Chart Tools tab contains options for changing the chart type and selecting a new chart style, and an option to change the chart layout.
In addition to the options that are geared toward changing the chart’s appearance, there are two very useful icons on the Design toolbar. One of these icons is the Switch Row/Column icon. Sometimes you may find that the chart function plots your data incorrectly. When this happens, clicking the Switch Row/Column icon often corrects the problem.
The other icon you need to know about is the Select Data icon. Clicking this icon brings up a dialog box that enables you to choose which rows and columns you want to include in the chart. You will find this icon to be especially important after you alter the spreadsheet to include your own data, because your data will rarely use the same number of rows and columns as the generic spreadsheet that Microsoft provides.
Figure 6.25 The Design toolbar contains a variety of options for changing the chart’s appearance.
Changing the Way a Chart Is Displayed
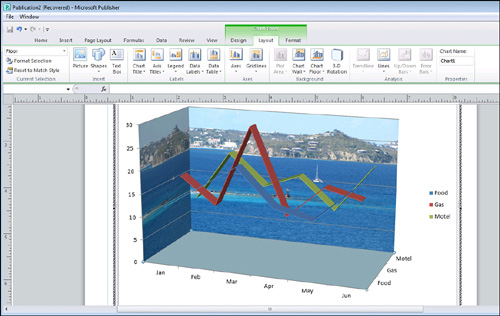
The Chart Tools tab’s Layout subtab is almost as important as the Design tab. This tab enables you to control things such as the chart’s title and how the chart’s legend and axis are displayed. You can also do really cool things, such as changing the chart’s 3-D view or filling the chart’s backdrop with a picture. The options found on the Layout tab are pretty self-explanatory, but I have used the tab to customize the chart shown in Figure 6.26, just so you can see what is possible.
In this figure, I used the default spreadsheet data but selected a different chart type. I replaced the chart wall with a picture that I took in St. John last month, and I replaced the chart floor with a solid color.
Figure 6.26 The Layout tab enables you to customize a chart.
Controlling Text Within a Chart
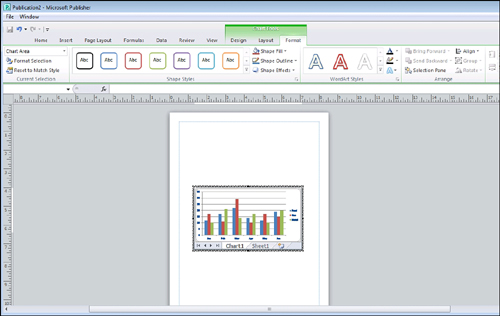
The Format tab isn’t quite as important as the Design and Layout tabs. It is primarily used to control the style of text used within the chart. As you can see in Figure 6.27, this tab enables you to select shape styles or word art styles. You can also use this tab to format things such as the chart’s legend and axes.
Figure 6.27 The Format tab is of minimal importance.
SHOW ME Media 6.4—Creating a Chart
![]()
Access this video file through your registered Web edition at my.safaribooksonline.com/9780132182591/media.
Importing an Existing Chart
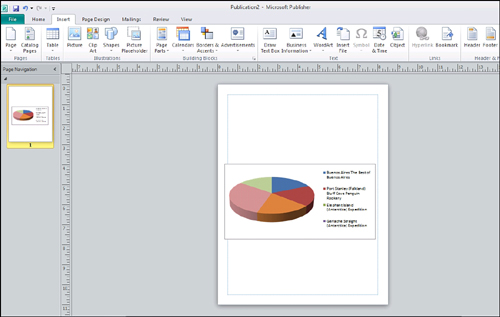
Various methods can be used to import an existing chart into Publisher. I have found that the easiest method is also the least sophisticated. All you have to do is open Excel and select the chart that you want to import. Excel enables you to select either the chart itself, the legend, or the chart and the legend together, so make sure you select the portion that you need. After doing so, press Ctrl+C to copy the chart to the clipboard. Then, switch over to Publisher and press Ctrl+V to paste the chart into your Publisher document. As you can see in Figure 6.28, the chart is imported seamlessly.
Figure 6.28 Excel charts can be pasted into Publisher documents.