15. Working with External Data and Data Graphics
In This Chapter
• How can I make my time count using linked external data?
• How does Automatically Link with External Data save me even more time?
• How does Refresh with My External Data save so much time I create time paradoxes?
• How can I get fancy with data graphics?
• How will customizing data graphics make my diagrams really pop?
The material in this chapter is focused on features that Visio 2013 Professional and Visio Pro for Office 365 include in the Data tab. If you have Visio 2013 Standard, you may be justifiably disappointed that these features are not included, so maybe you shouldn’t read this chapter because it may create a strong desire to upgrade. If you are still curious, please continue.
Linking to external data and using data graphics are certainly capabilities that take Visio to a new level. You will be fascinated by the potential these tools bring to your diagrams, and we encourage you to experiment with these tools in your drawings. Besides saving you time, they empower individuals without Visio to influence Visio diagrams.
This chapter gives you examples of how to bring assembled data into your drawing with minimal effort on your part. You also see some ways you can use data graphics to liven up drawings and create dashboard-style elements for a diagram.
Linking Shapes to External Data
Chapter 14, “Using Data,” considered a few of the ways that you can use shape data, adding data to existing fields and even customizing the fields to accept data that you want a SmartShape to hold. You also learned how you can display shape data in your drawing. This works well for many situations, but there are a few obvious issues to consider. Manually entering in this data into a Visio drawing and keeping it up to date can be tedious. In many cases, data is already prepared in a spreadsheet or database, so you could find yourself reinventing the wheel when manually adding this data to your shapes. Finally, not everyone is set up to modify Visio content on his or her computer.
Visio has enabled you to link shapes to external data for a few years now, and if you have Visio 2013 Professional, this is a great feature that you appreciate after you see how to use it. Linking can be done with several types of source data.
 Note
Note
The Data tab and Link to External Data tools are limited to Visio 2013 Professional versions, but both Standard and Professional include additional tools that enable you to work with external databases. The tool you use is found in the View tab—open Add-Ons from the Macros section, select Visio Extras, and then select Database Wizard. The process to set this up is quite a bit more complicated and is beyond the scope of this book.
Also, a few templates are specifically designed to work with external data, and they have wizards to help guide you through setting up the external data. Org charts are an example of this, using a wizard to simplify the importing of external data from Exchange servers or Excel spreadsheets.
Look at Your External Data First
To link data you need to look at your data source and possibly do some preparation so that the data will import easily into Visio. It is a good idea to prepare your data source with the shape data field names in mind, because this saves you time later and possibly avoids confusion. A unique key or identifier is used to match your external data to a shape data field in Visio.
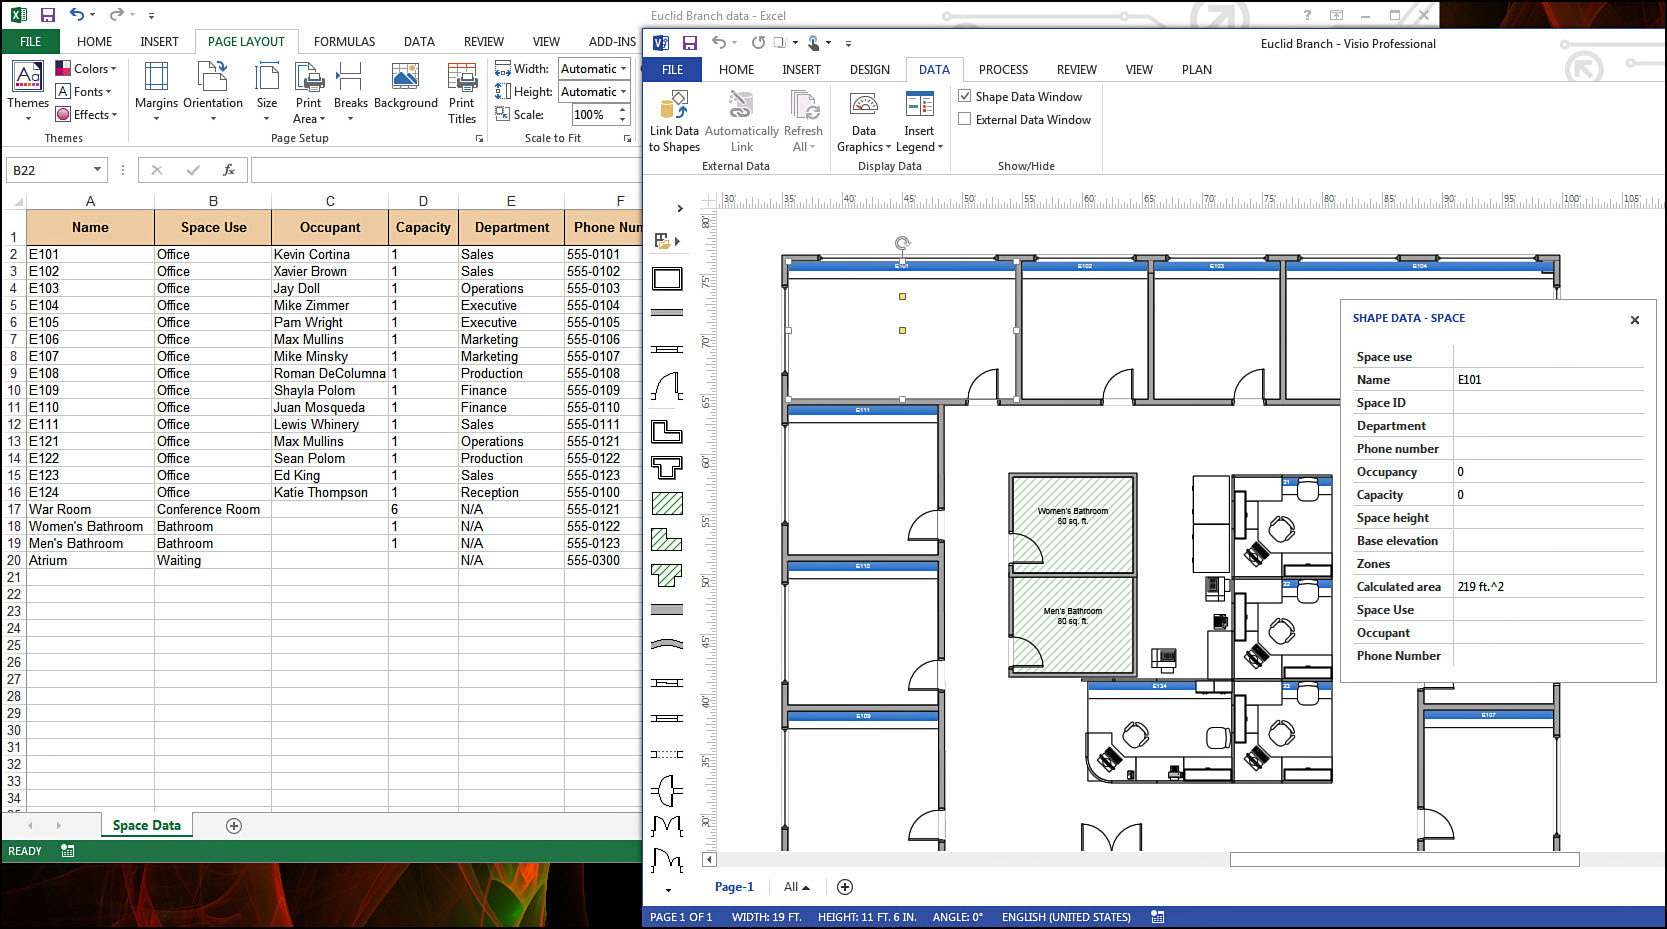
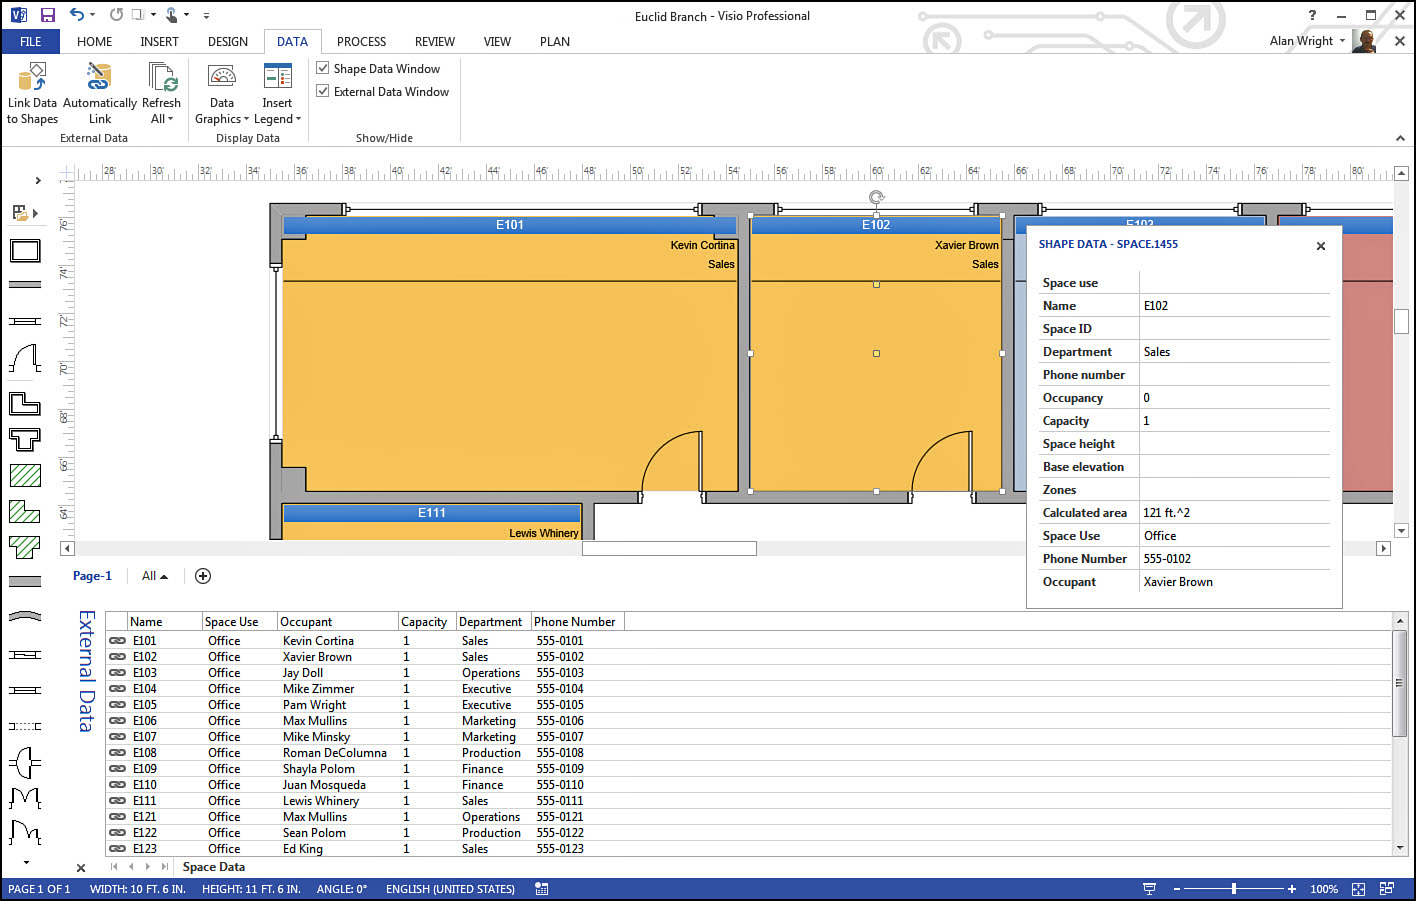
To demonstrate how to use an external data source you will see examples in the following pages using data that has been prepared for a branch office. Office assignments are kept up to date in an Excel spreadsheet and stored on a network drive. This is linked with a floor plan for the branch office that was created in Visio. Figure 15.1 shows the Excel spreadsheet that has been prepared using column names that match the shape data fields in the Space shapes for a Visio floor plan. Follow the next few sections to see how to bring the data over from the spreadsheet, rather than type in all those phone numbers, names, departments, and so on.
Using Link Data to Shapes
In Figure 15.1, you can see the Data tab. This section focuses first on the section labeled External Data; later in this chapter, you look at the Display Data buttons.
Follow these steps to link your data starting from the Data tab:
1. Click the Link Data to Shapes button to open the Data Selector dialog box. Select the type of data you link to, as shown in Figure 15.2. In this case, you connect to an Excel workbook. Notice some of the other data sources that can be used. Click Next.
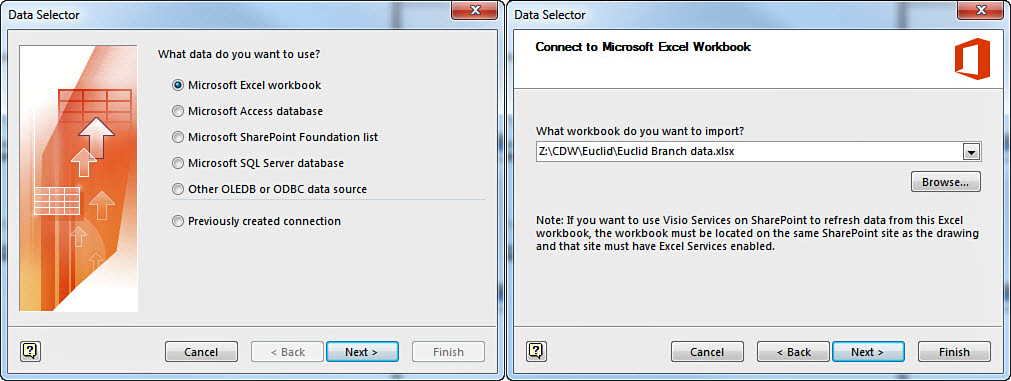
2. Also shown in Figure 15.2, browse to the location of your data source and click Next.
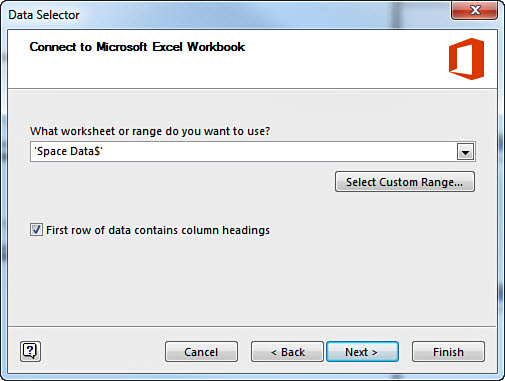
3. If the worksheet or range is incorrect, use the Select Custom Range button to correct it. In this case, the Excel worksheet Space Data was identified correctly by Visio. (Compare Figure 15.3 and Figure 15.1.) Click Next.
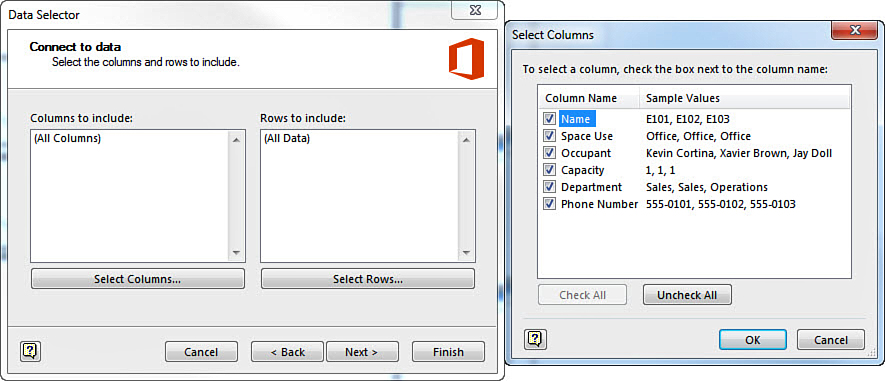
4. Next, verify which columns and rows you want to link to. Click the Select Columns or the Select Rows button to refine your choices, or leave the defaults to link to all columns and data. Figure 15.4 shows how to uncheck columns or rows that are not needed. Click Next when done here.
5. Configure Refresh Unique Identifier is where you point to the Name column shown in the spreadsheet back in Figure 15.1. Use a value you do not expect to change, because this is used as a key to cross-reference the data in the spreadsheet with the shape data fields. (These fields do not need to have the same name; it just worked out that way here.) Click Next.
6. You see a final window congratulating you for successfully importing your data. Click Finish.
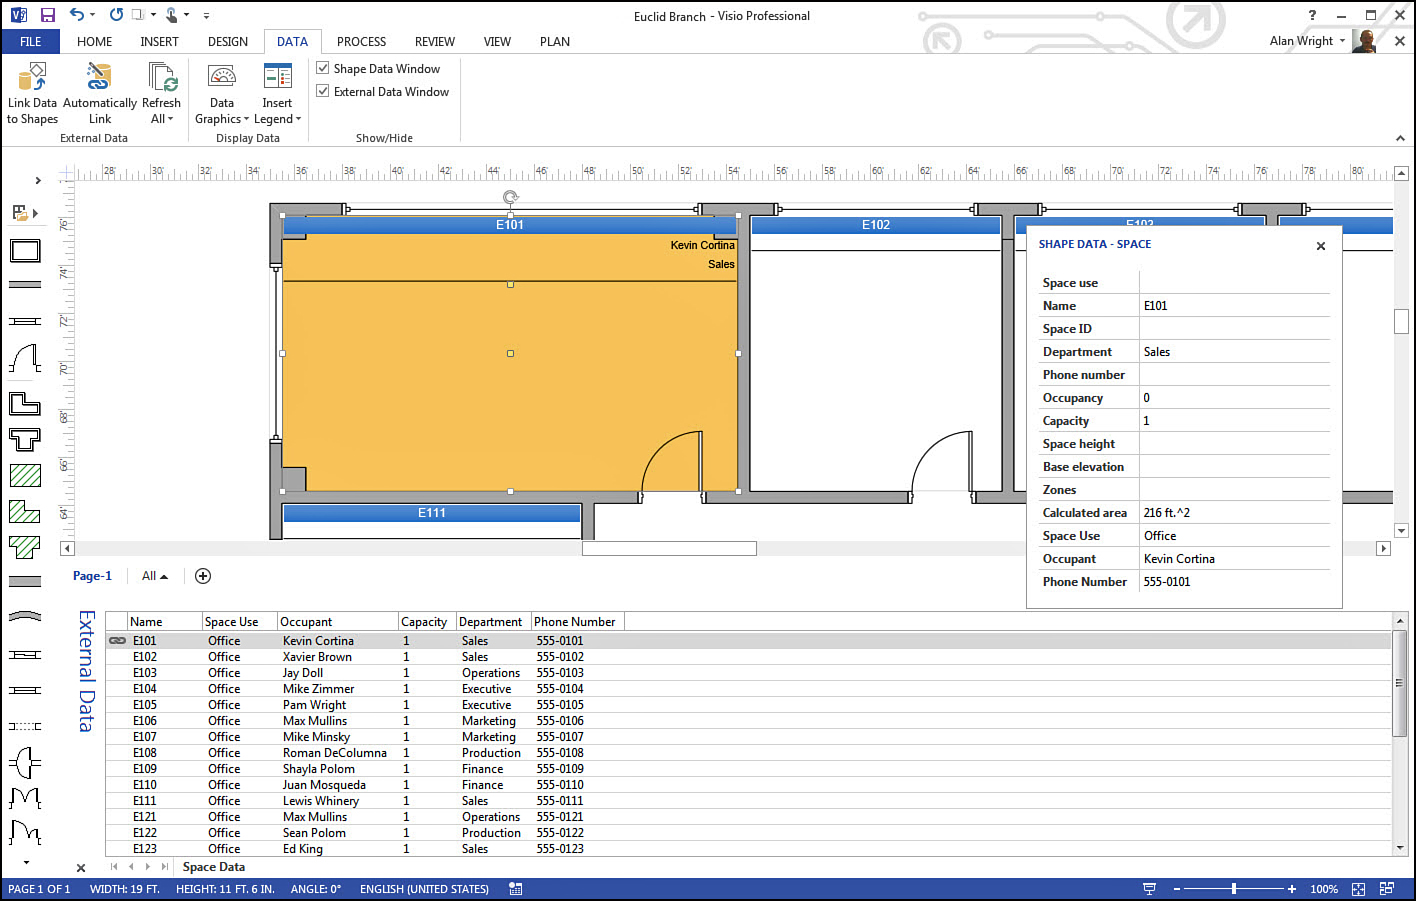
7. By default, your drawing window adjusts to include an external data window across the bottom. (This window can be hidden when you want to maximize the visibility of your diagram by unchecking the External Data Window checkbox from the Data tab.) You can drag an item from the external data window onto a shape in the drawing window. The results are shown in Figure 15.5. Notice that one row of data now shows a link; in fact, the office labeled E101 has shape data that was entered automatically from the spreadsheet.
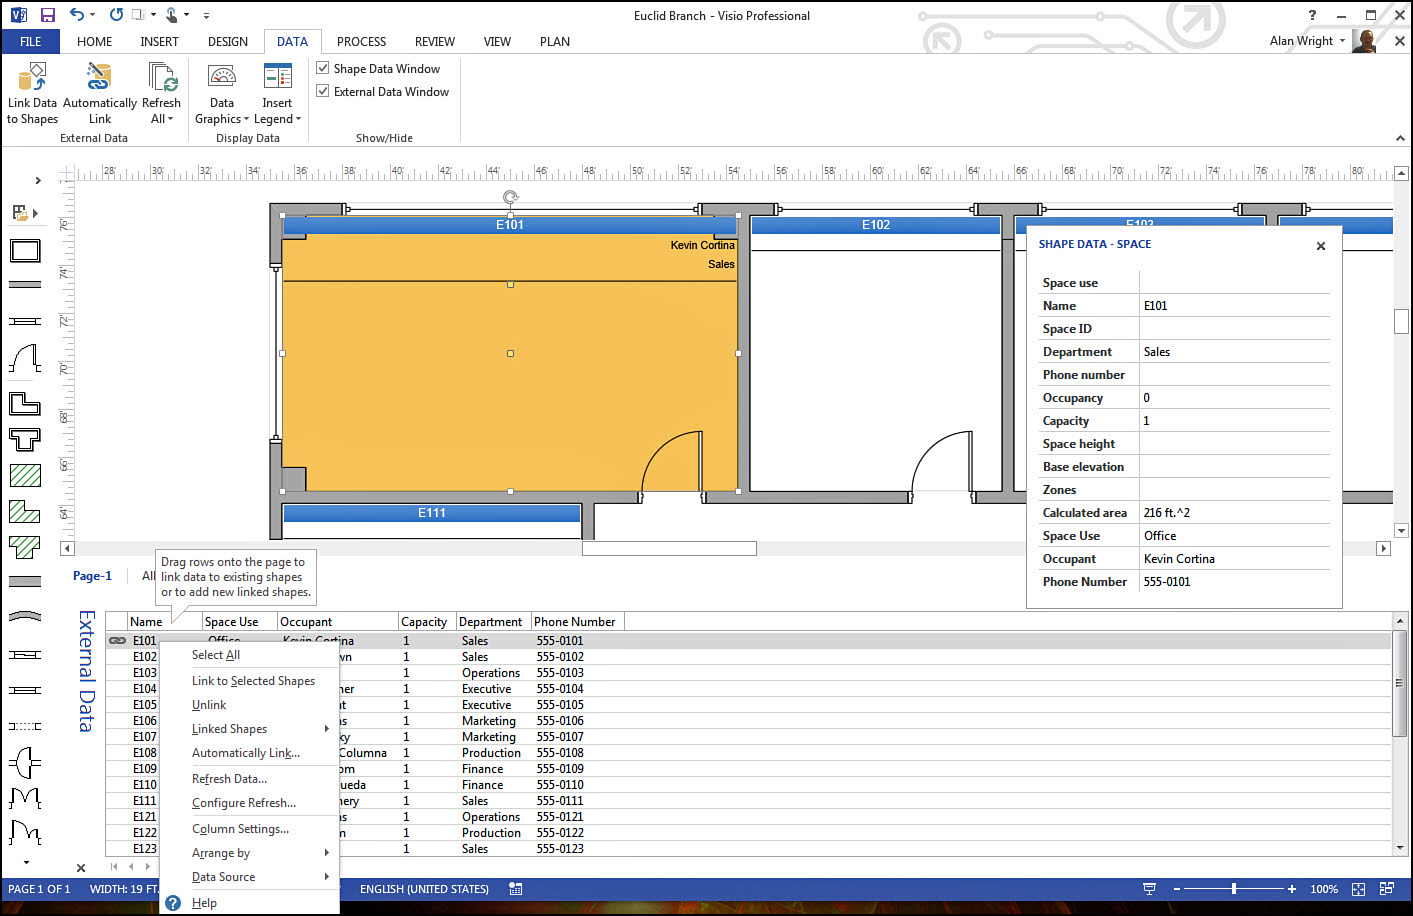
8. Right-click a row in the external data window, as shown in Figure 15.6, and you can see that there are many additional tools that affect how the data is linked to your shapes. You cannot edit data from here.
The capability to bring in external data can be useful for many scenarios. Assets, network resources, HR, part numbers, pricing, and other sales information are a few examples of how data can be maintained in a spreadsheet or database and then brought into Visio as linked external data.
 Tip
Tip
You can use the drag-and-drop method for linking data manually even when you do not have shapes set up ahead of time with any key identifier fields. For example, in Figure 15.5, the office can be unnamed and the results are the same. In some cases you may have established shape data that serve for identifiers in a diagram, and in other cases it may be a work in progress.
Note
Using Automatically Link Data
You could drag data to shapes and perform your links as we have just seen, but the Automatically Link tool makes this even easier. This works smoothly if you have prepared your data to match your shape data fields and have a unique identifier for each shape in your Visio drawing that matches a field of data in your external data. The office numbers shown back in Figure 15.5 that occupy the Name field in the Space shapes are an example of this.
To automatically link multiple rows of external data follow these steps:
1. From the Data tab, click the Automatically Link button.
2. The first window offers you the option to automatically link to All Shapes on the page or just selected shapes. In Figure 15.7, All Shapes has been selected. Click Next.
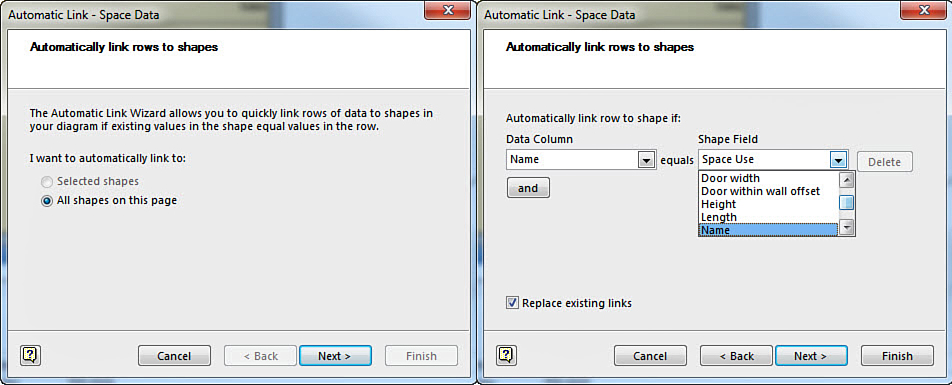
FIGURE 15.7 Use the Automatic Link Wizard to make quick work of linking multiple shapes to an external data source.
3. Here you want to point again to the corresponding values from your data source and the shape data field. In this example, Name has been used for both values (see Figure 15.7). Select the appropriate values and then click Next.
4. Click Finish if the selected criteria is correct.
5. Figure 15.8 shows the results; all fields have now been labeled, and you can see the reassuring links in the external data window.
Note
When using Automatically Link, any shapes that do not match the key identifier that has been selected remains unaffected by the linked data. For example, in the office floor plan used in this chapter, an office that had no “name” would be skipped. Also, additional office names that were not captured in the external data would be skipped.
You can add additional external data sources as well. They appear as tabbed sources in the external data window. You can use the same steps outlined earlier to link these data sets as well.
How would you use this feature? Perhaps you are the office administrator for the branch office in these examples, and you keep the office assignments on an Excel spreadsheet on your computer that includes name, department, and home phone numbers. The building’s facilities department has its own database that indicates office phone numbers and other details about each office without reference to the occupant. By bringing these two data sets into Visio, you can link the data to show relevant data from both sources all in one place without any additional typing on your part. You just found time for another coffee break!
Refresh Link Data
By now you may have noticed another button on the Data tab labeled Refresh All. As the name implies, this tool allows you to refresh data that was brought in from your external data source. Suppose that there have been updates to phone numbers, personnel, prices, and so on. As long as the source data has been updated, you can select Refresh All to update your Visio shape data.
You can also adjust specific settings for the refresh:
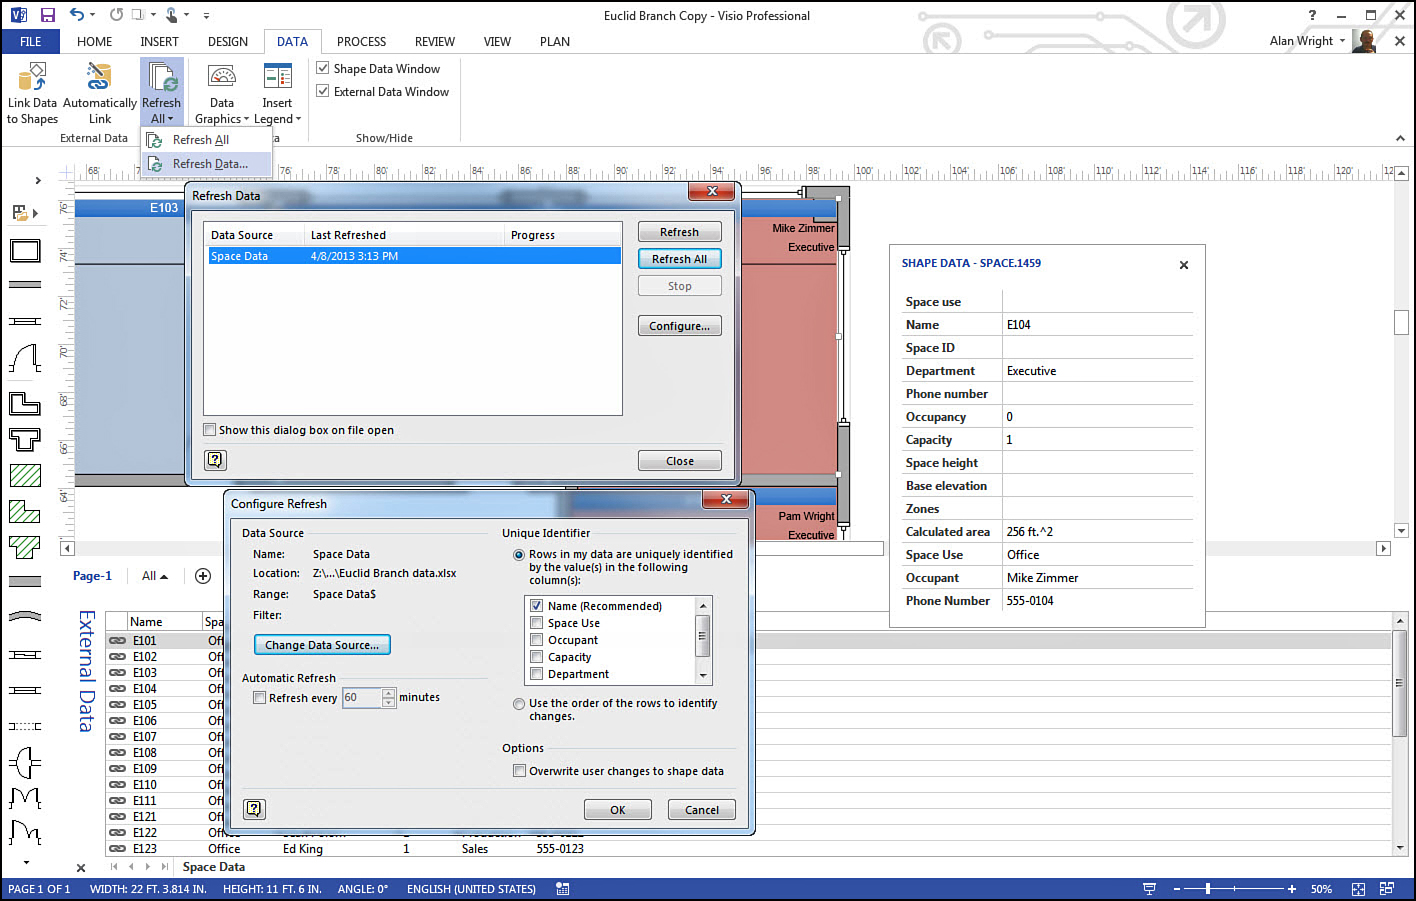
1. From the Data tab, select the drop-down from the Refresh All button and then select Refresh Data.
2. Select the appropriate external data source, and click Configure.
3. In the Configure Refresh window, adjust your data source, unique identifier, or set an interval for Automatic Refresh. You can use the optional Overwrite User Changes to Shape Data to replace differences between shape data with data in the external source that were typed in manually (see Figure 15.9).
Setting Up a Master to Use Link Data
You can create your own shape master with custom shape data fields that match data you already assembled elsewhere with the idea of linking external data to a custom shape. In Chapter 14, you saw how to create shape data fields. Chapter 5, “Working with Shapes,” showed you how to create shape masters from new shapes or copies of existing shapes. By combining these two techniques, you can create a shape master that is already set up to link to external data with fields that correspond exactly to the data you are concerned with. Add to this the elegance of refreshing linked data to catch any updates to your data source, and your Visio diagram becomes a long-term tool that remains relevant in a very dynamic environment.
Imagine doing this with shapes on a floor plan for a store. By linking to data related to inventory or sales and refreshing your data every few hours, you can create a visual floor plan that tells you where you are out of stock or are running short on merchandise, complete with linked SKU numbers, color, pricing size, and more.
→ To learn more about creating Shape Masters, see page 90.
→ To learn more about creating custom shape data fields, see page 269.
What Are Data Graphics?
Data graphics are another awesome feature in Visio that provide you with a variety of ways to display data. In addition to text, you can also use colors or shapes to communicate status information based on shape data.
How to Create a Data Graphic
Although there are many practical ways you can use data graphics, for the sake of simplicity the office floor plan from earlier in this chapter is used. You can see how to add a data graphic to the conference room shown in Figure 15.10 that will alert you if there are too many people in the room. Notice that you already have shape data indicating Occupancy and Capacity in the Shape Data task pane.
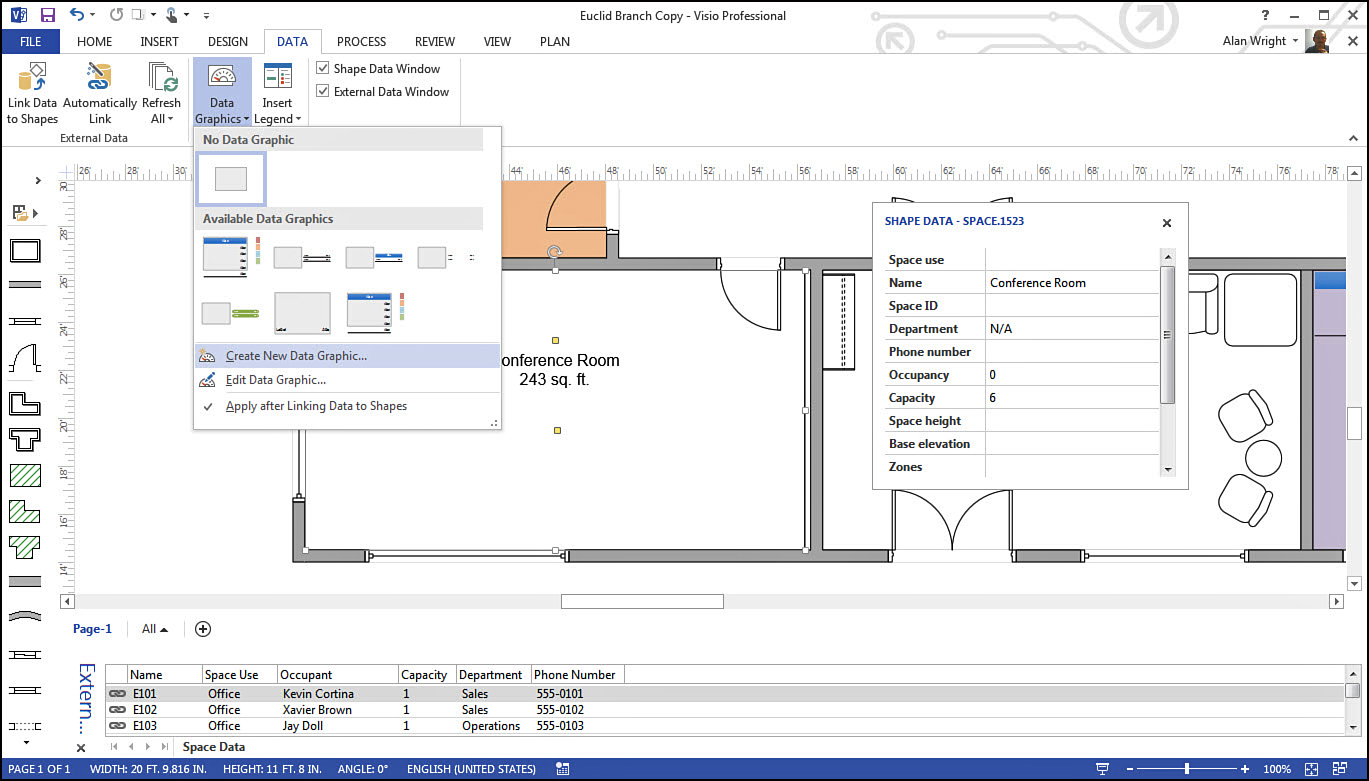
FIGURE 15.10 You can create custom Data Graphic settings in your drawings using the Create New Data Graphic tool.
To add Data Graphics we’ll follow these steps:
1. From the Data tab, select Data Graphics and Create New Data Graphic.
2. In the New Data Graphic window, select New Item.
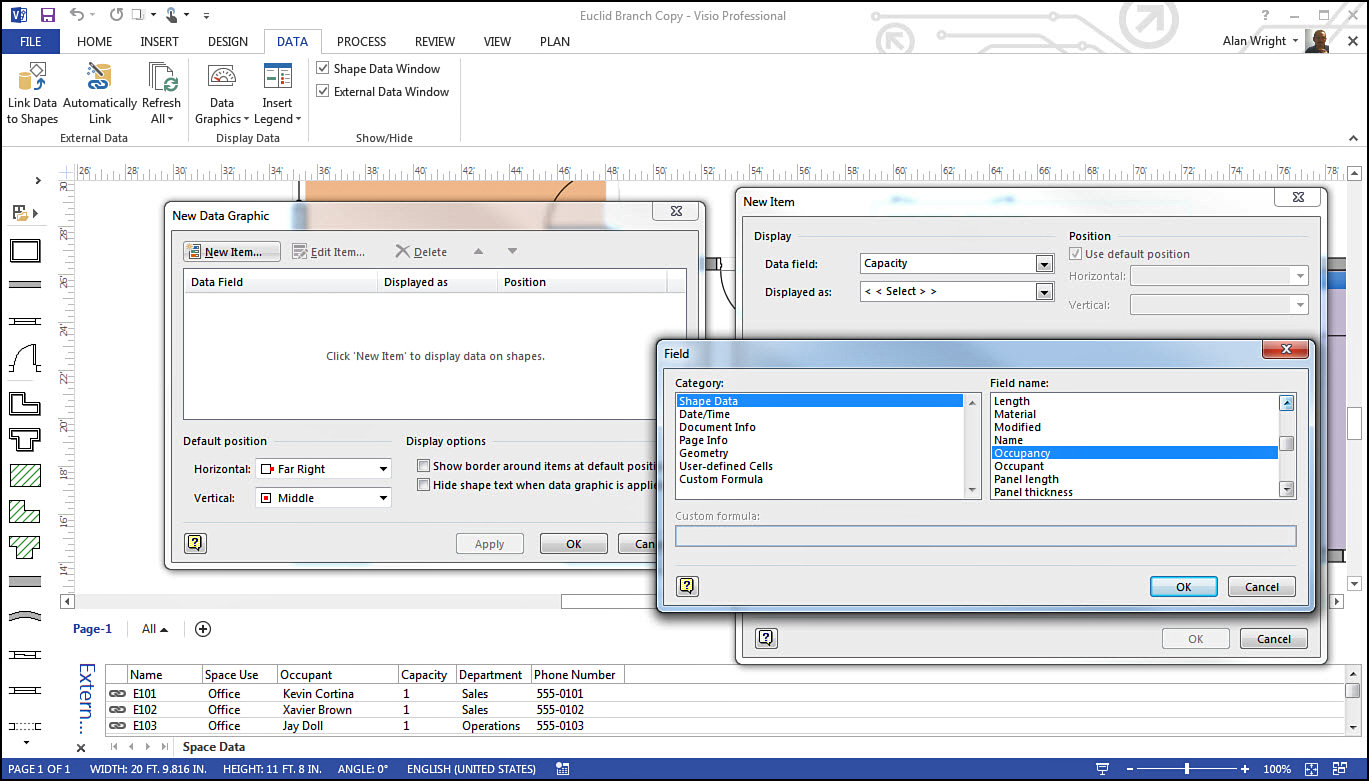
3. In the New Item window, identify the data field for Occupancy. It is not listed in the initial drop-down; you can select More Fields to bring up the Field window shown in Figure 15.11. Select Shape Data for the category and then scroll down to locate the Field name: Occupancy. Click OK.
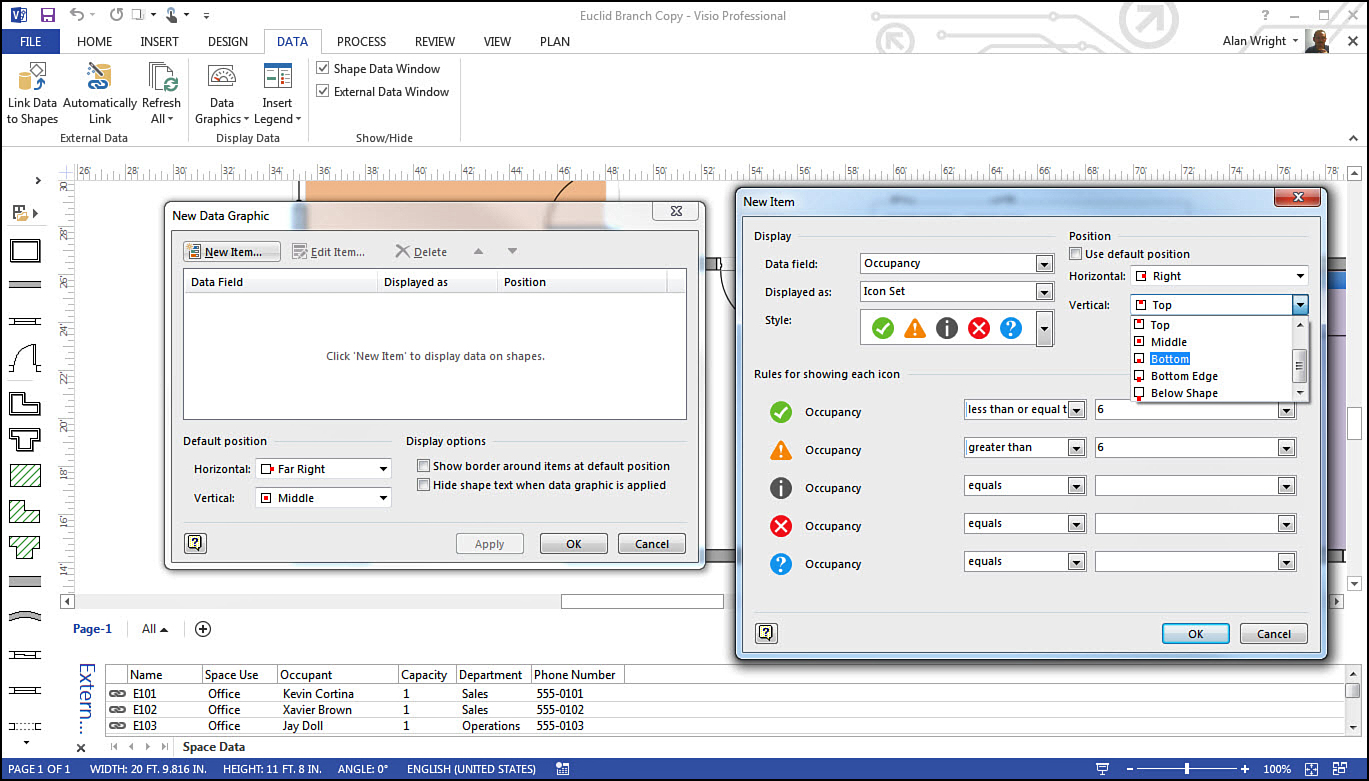
4. For Displayed As use an Icon Set and select an appropriate set of icons from available Styles. Because you know that this conference room has a capacity of six, you can use that with some basic equations to indicate which icon is shown based on occupancy. Finally, notice in Figure 15.12 that the position of the data graphic can be precisely located by choosing from Horizontal and Vertical drop-down lists. Click OK.
5. In the New Data Graphic window, you see summarized your settings for Data Field, Displayed As, and Position. Click OK.
6. Click Yes when asked, “Do you want to apply this data graphic to the selected shapes?”
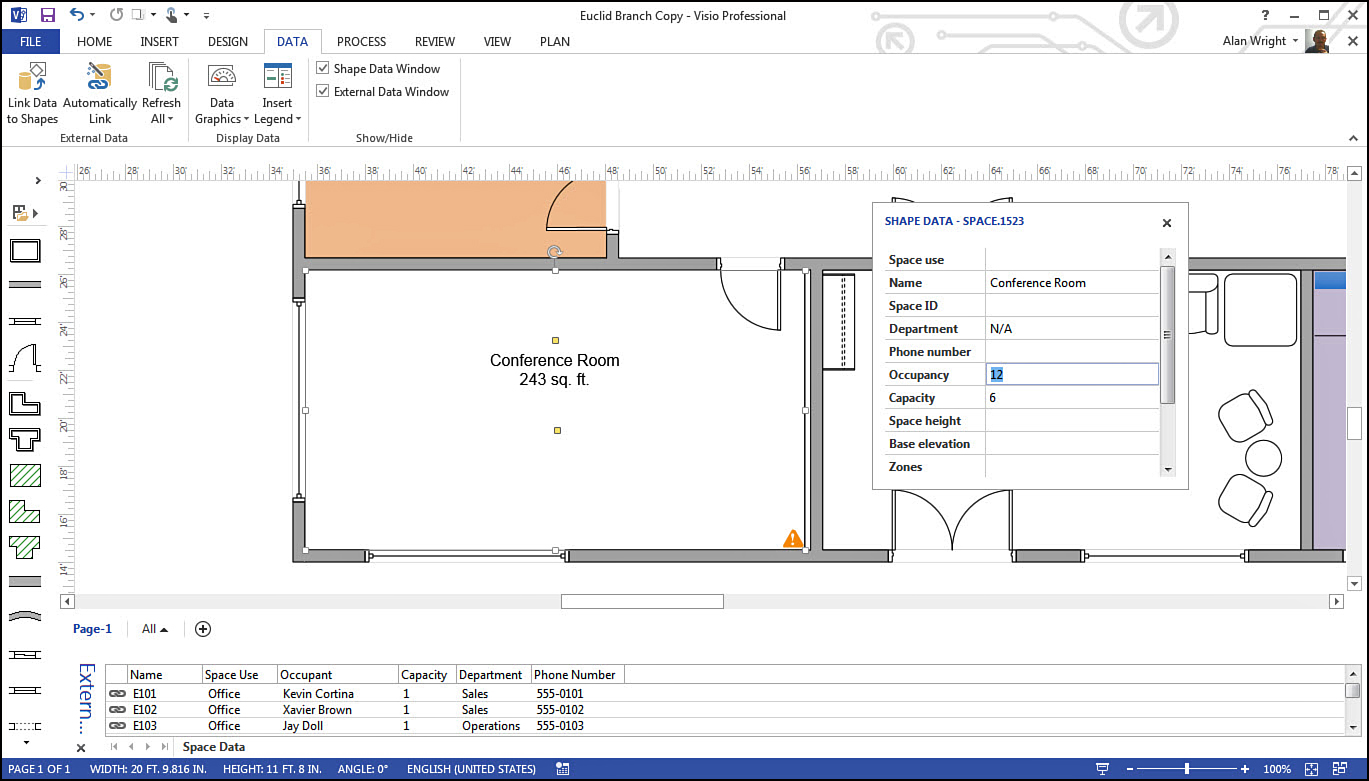
7. The conference room now displays a round green circle with a check mark because the occupancy is still 0. To show what would happen if the occupancy value changes to something greater than six, Figure 15.13 shows what happens when 12 is placed into the Occupancy field. A yellow triangle with an exclamation point immediately appears.
Tip
You can also create formulas to perform calculations based on values placed in shape data fields. This can be useful when you do not know the value, or if you are using a value from linked external data. Figure 15.11 shows the Field dialog box. Selecting the category Custom Formula allows you to create basic equations that are used as the data field.
Tip
It is useful to include a legend that explains what the colors or symbols mean that are used as data graphics in a diagram. Use the Insert Legend button on the Data tab to add a legend that explains what each enabled data graphic means, even if it is not currently displayed in the diagram.
Customizing Data Graphics
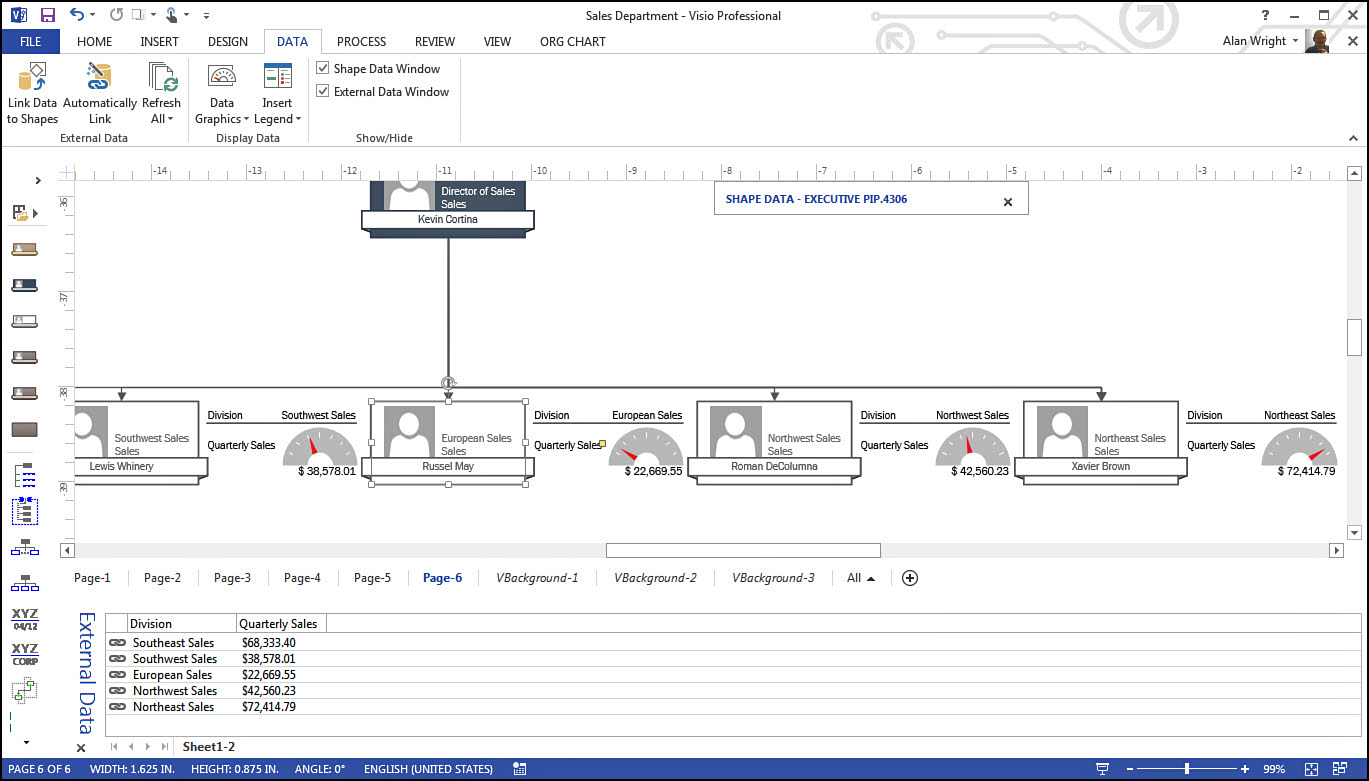
To further illustrate how data graphics work and some of the many things you can enable them to do, consider the following example of a sales department. Management wants you to show the status of the divisional sales figures with a simple data graphic to motivate sales personnel. This is posted to a SharePoint site, and all employees are able to see how the divisions are performing.
In Figure 15.14, you can see that an org chart has been linked to an external data source. Because the linked data did not match existing shape data field labels, new Shape data fields were created. Incidentally, this data was automatically displayed using data graphics with default Position settings when it was linked. The shape spacing had to be manually adjusted in this case to accommodate the data graphics that display to the far right of each org chart shape.
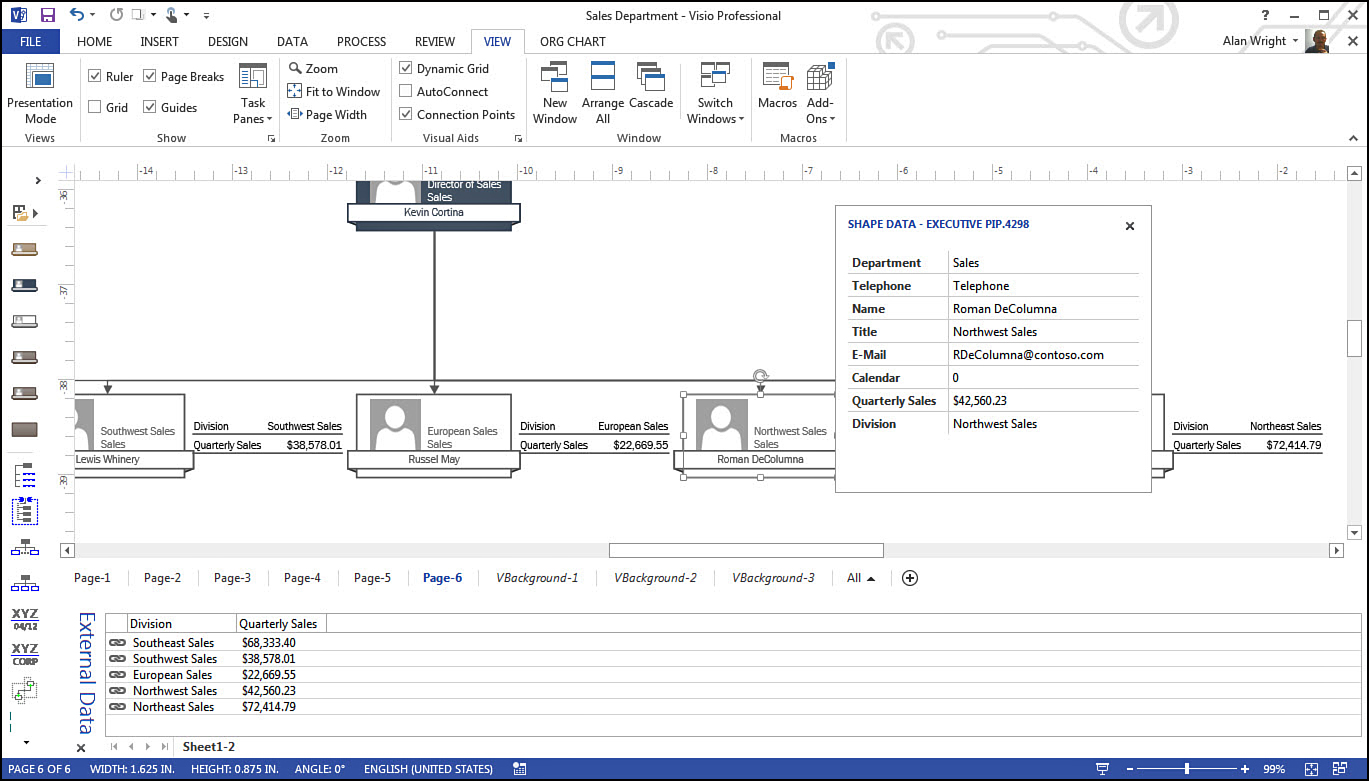
Note
Visio does not treat data graphics as separate shapes, so some overlap may occur if the data graphic displays outside of a shape. Using tools to rearrange or position shapes may help; otherwise, you may need to change the Position settings for the data graphic to display inside your shape.
The data displayed in Figure 15.14 is kind of dry. You can change how this is displayed and use a more attention grabbing appearance. From the Data tab, select Data Graphics to modify existing data graphics. Figure 15.15 shows how you can hover your mouse over an available data graphic to preview how this would appear.
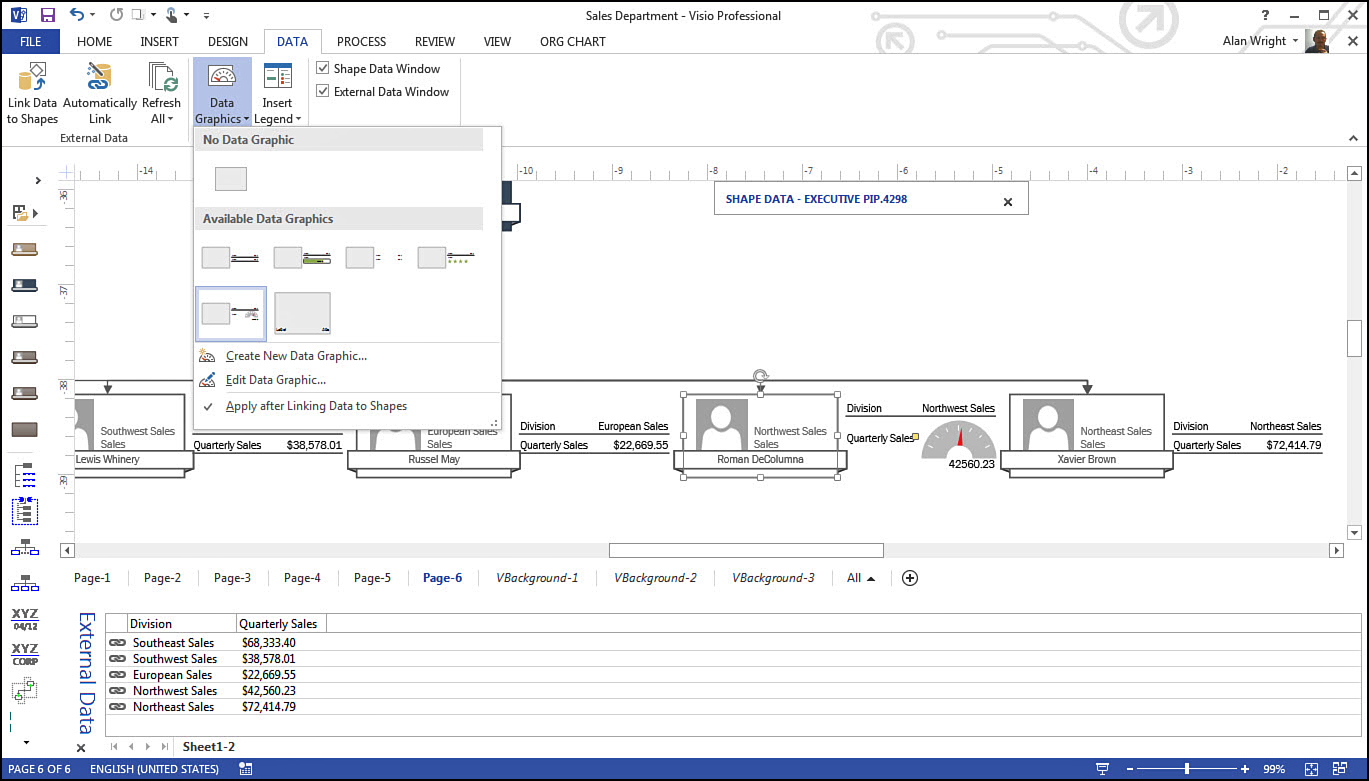
FIGURE 15.15 You can preview some basic variations for a data graphic right from the Available Data Graphics gallery.
For the sake of this example, assume that management likes the data graphic speedometer, but they want you to tweak the position of the pointer on the gauge.
1. From the Data tab, select Data Graphics and then choose the option Edit Data Graphic shown in Figure 15.15.
2. In the Edit Data Graphic dialog box shown in Figure 15.16, select the Data Field Quarterly Sales and click Edit Item to change the settings for the data bar.
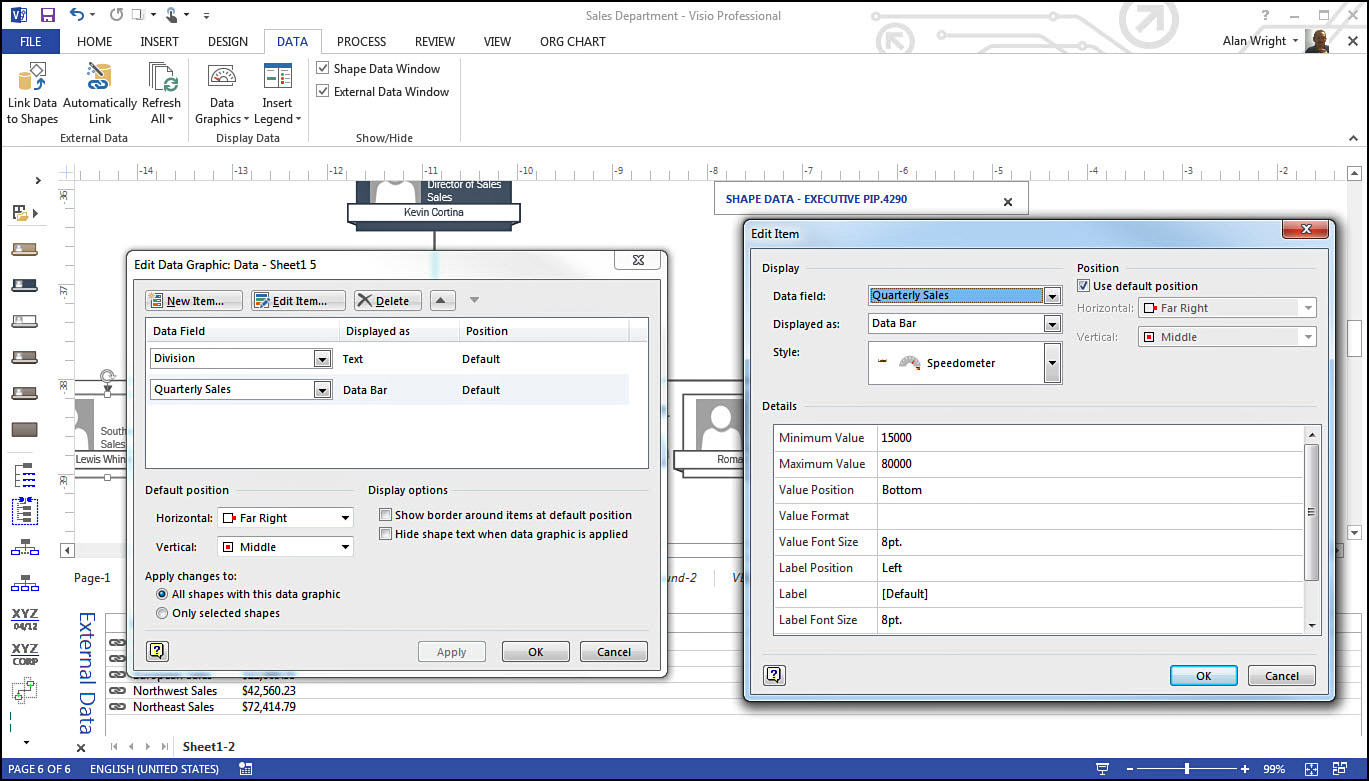
3. In Figure 15.16, adjust the Minimum Value and the Maximum Value. Use a range of 15,000 to 80,000 to narrow the range for the values you are working with in this scenario. Also change the Value Format to Currency.
4. Figure 15.17 shows the new data graphic applied to the divisions with an easily understood visual. The European sales division needs to step it up! Anytime the linked data changes and is refreshed, the data graphic adjusts accordingly.