
18. Tips for Flowcharts, Process, and Block Diagrams
In This Chapter
• How can I keep flowcharts flowing correctly with the right glue?
• How will subprocesses help to streamline my flowcharts?
• Can I work with swimlanes in cross-functional flowcharts without getting wet?
• How can I safely blend shapes in block charts.
Visio has many very specialized templates, some with new or updated features for 2013. This chapter looks at a few specific templates and provides some pointers and tips to help you get the most out of the tools provided.
Process and Flow Chart Diagrams
Although flowcharts tend to be pretty straightforward creations, the following sections present a few tips that might make diagram creation go smoother for you.
Auto Resize and Flowchart Shapes
Flowchart diagrams should be as streamlined as is realistically possible. It is a good practice to avoid jumbled and inconsistent shapes and layouts that detract from a well-laid-out flowchart. Most flowchart shapes have a feature that allows them to automatically grow vertically to contain long text entries. Figure 18.1 shows one normal default Process shape and two Process shapes that have been resized. The second shape autoresized to contain the text, and the third was resized using the control handles. The context menu is shown for each.
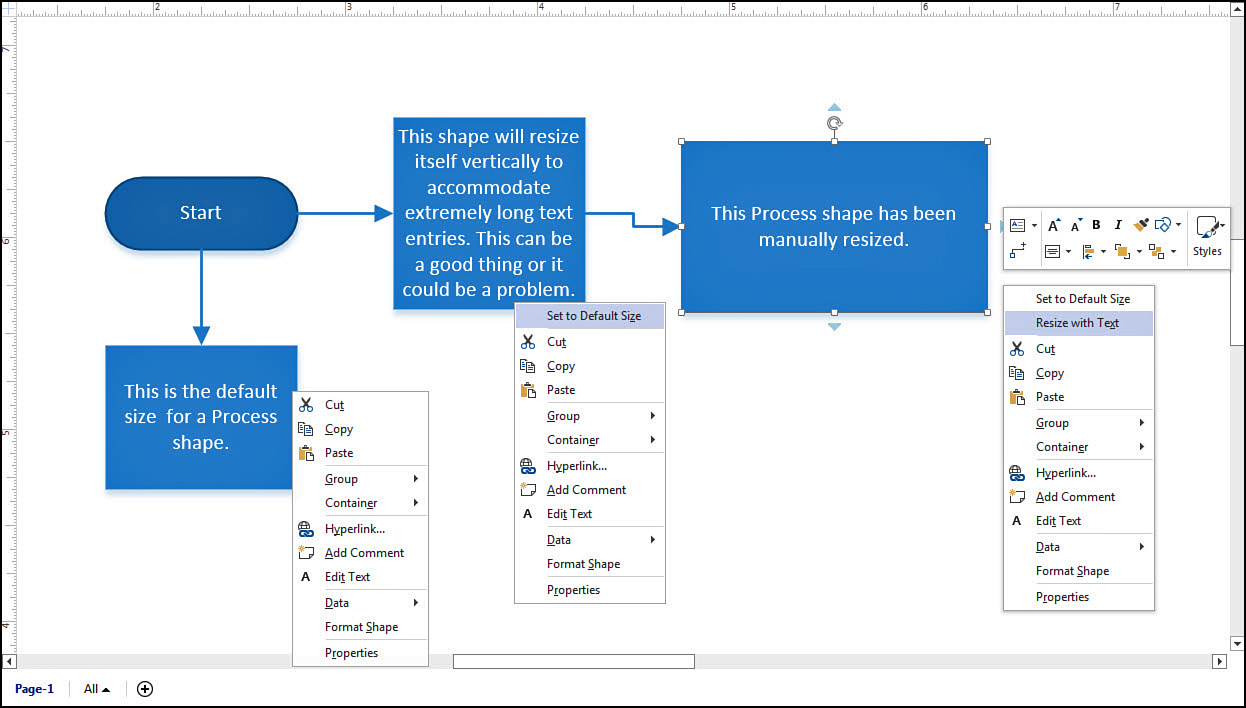
It helps to understand how Auto Resize works because it may not always appear to be enabled. By default, these shapes resize vertically. The capability can be disabled by selecting Set to Default Size. Also, after a shape has been resized manually, the Auto Resize feature is disabled. To enable this, look for the Resize with Text option when right-clicking the shape. In the case of the horizontally resized shape in Figure 18.1, the shape expands vertically with text and does not lose the extra horizontal real estate.
Decision Shapes
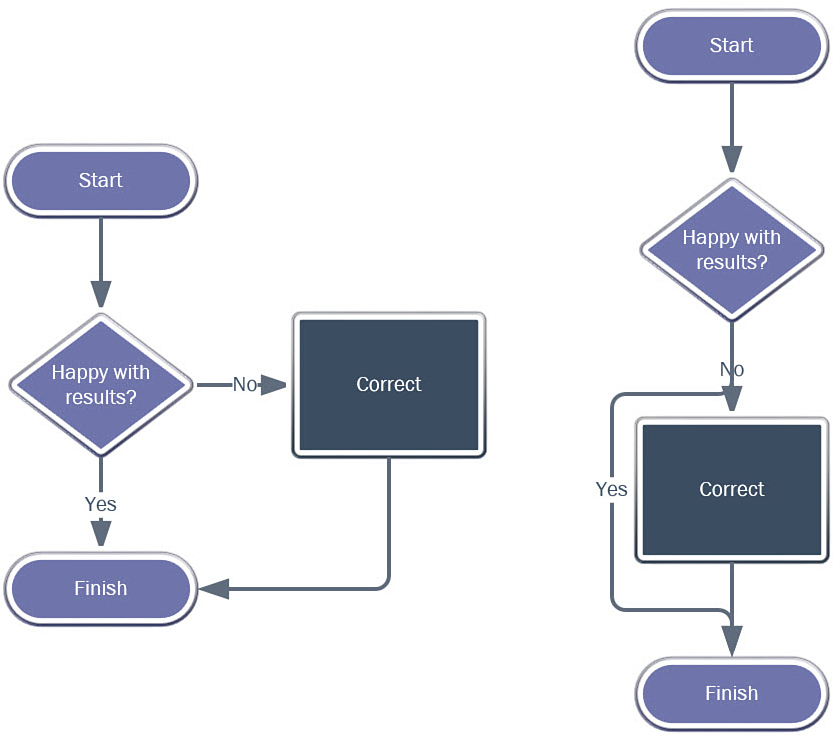
Visio includes many options when you use Re-Layout Page on the Design tab. Whereas most results are predictable and more desirable than manually throwing a flowchart together, flowcharts tend to get flustered when encountering Decision shapes and dynamic glue. Notice in Figure 18.2 how the flowchart on the left is converted to the flowchart on the right using the Re-Layout tool. Both Yes and No options are now run out of the same point using dynamic glue. The result is not as clear as you would expect, and it is not a very useful flowchart.
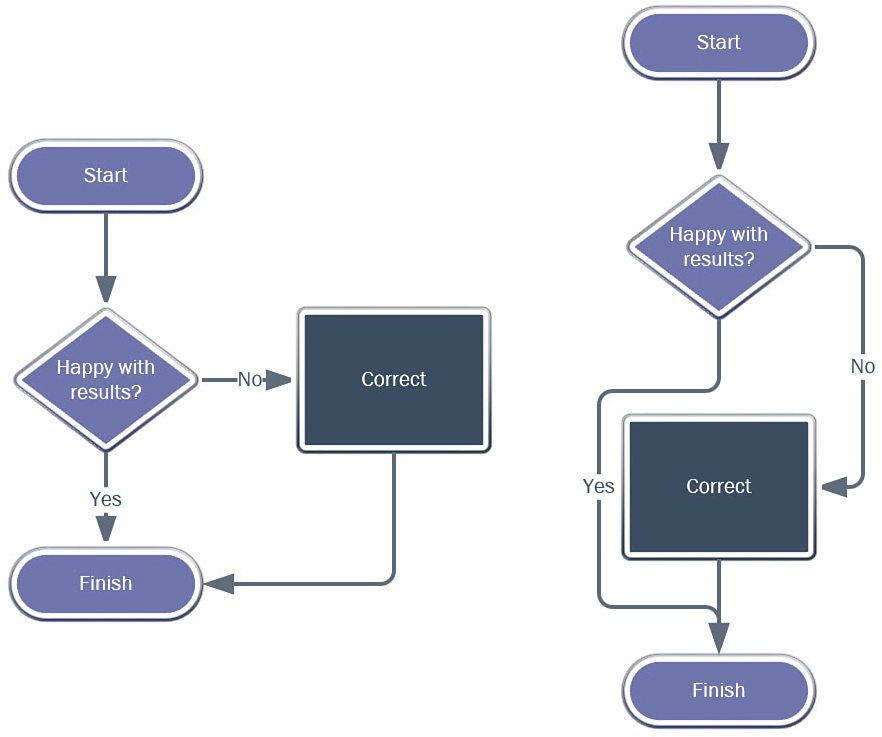
The solution in a case like this is to use point-to-point glue. Notice in Figure 18.3 that the same flowchart on the left now has point-to-point glue for the Yes and No connection points on the Decision shape. After using the same Re-Layout Page tool, the results are comprehensible and the chart is usable.
→ To learn more about the Re-Layout Page tool, see page 118.
→ To learn more about dynamic and point-to-point glue, see page 129.
Using Subprocesses
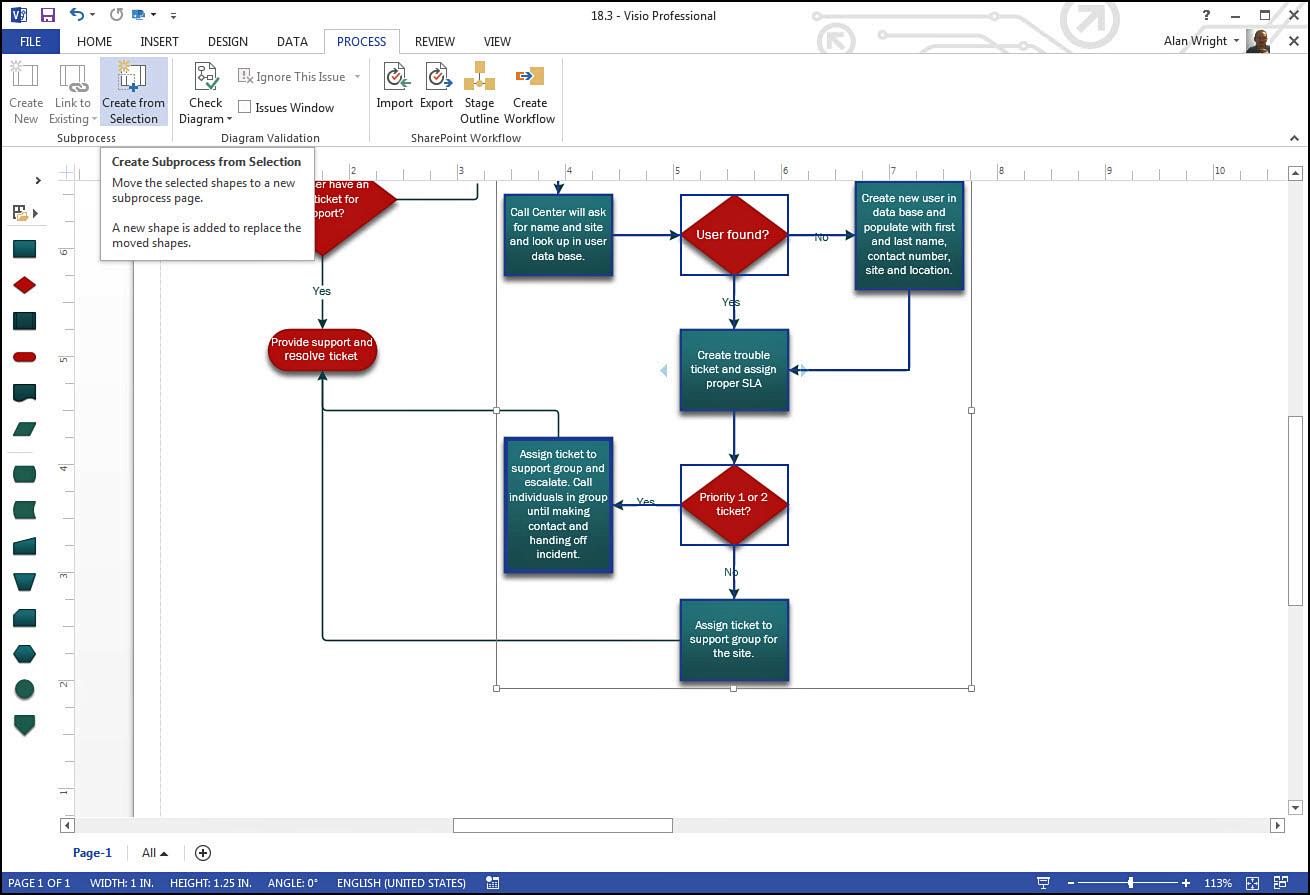
Subprocesses enable you to simplify a complicated flowchart by focusing on the higher-level process steps and relegating subsections of the flow to secondary pages where they can still be consulted when needed. As an example, Figure 18.4 shows a typical flowchart for handling support tickets.
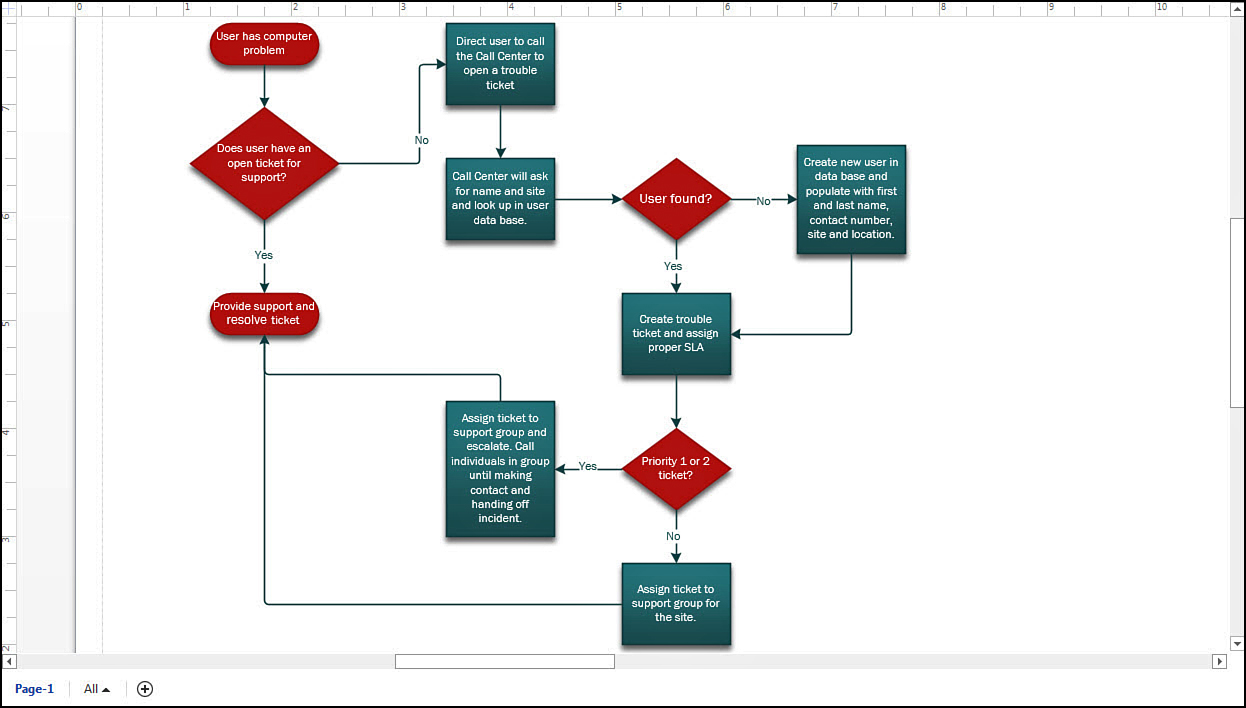
FIGURE 18.4 Flowcharts can contain lots of details. Use subprocesses to keep the focus on the main processes.
This could be simplified in this example by making the entire phone call process a subprocess. In Visio 2013 Professional, you can do this easily by selecting the appropriate shapes and navigating to the Process tab. In the section labeled Subprocess, select the button labeled Create from Selection (see Figure 18.5).
Select this to see your selected shapes replaced with a single Subprocess shape. Just name the new page containing your subprocess; it’s a good idea to name the shape to match the page it is related to. As shown in Figure 18.6, use Ctrl+click to open the new page from the Subprocess shape to review the relocated steps.
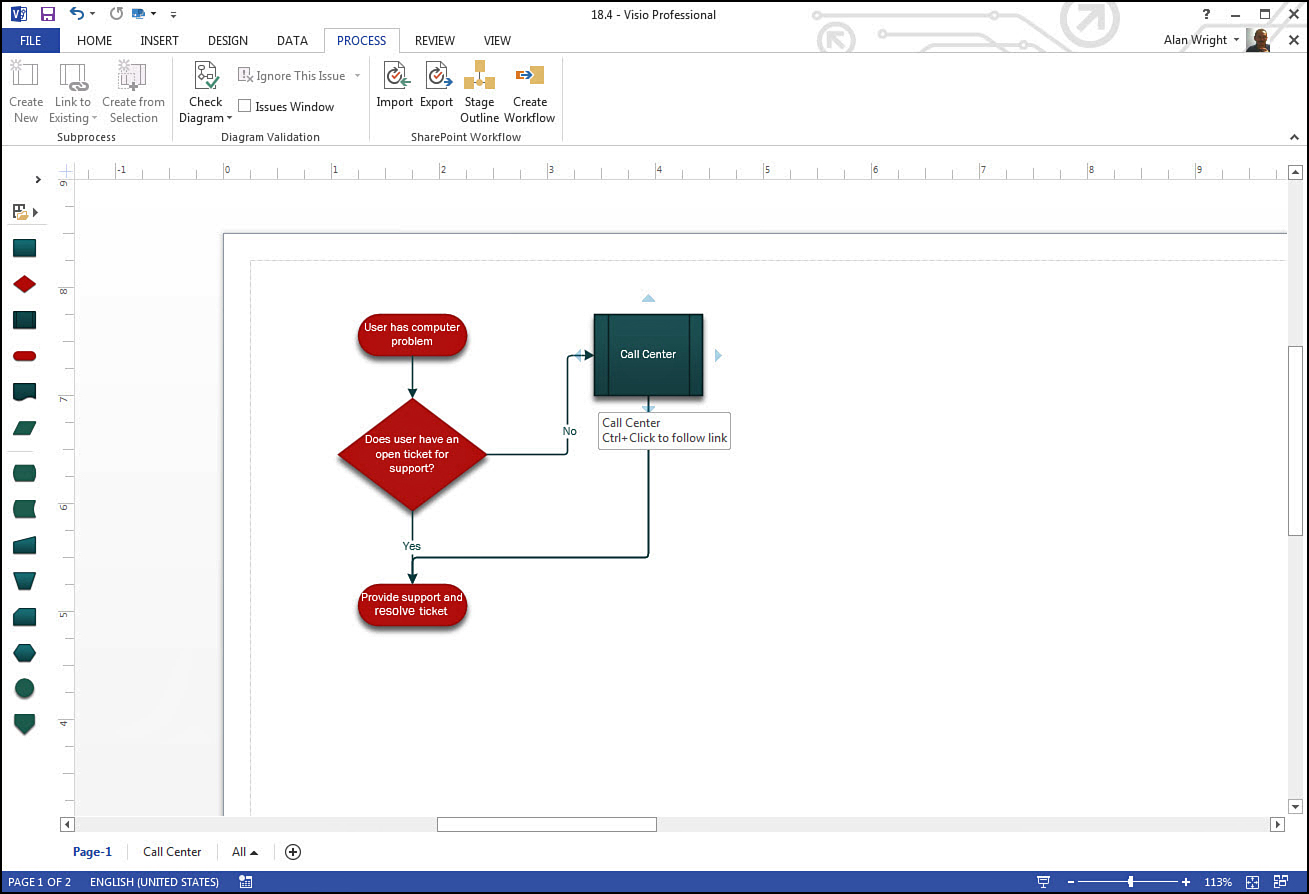
Alternatively, you can manually do the same thing by cutting and pasting the shapes into a new page. Drag a Subprocess shape into the drawing to replace the shapes that were cut out. Repair the connectors, and attach them to the new Subprocess shape. Right-click the Subprocess shape, select Hyperlink, and using a Sub-address, browse for the new page. Click OK, and you have essentially done the work of the Create from Selection tool.
→ To learn more about working with hyperlinks and shapes, see page 188.
Swimlanes and Phases in Cross-Functional Flowcharts
Chapter 8, “Making Advanced Diagrams,” talked about containers and considered how they are used in the case of swimlanes. Swimlanes are containers that are generally used in cross-functional flowcharts to indicate ownership of process steps. Usually a swimlane indicates a person, position, or business unit that is responsible for steps or processes.
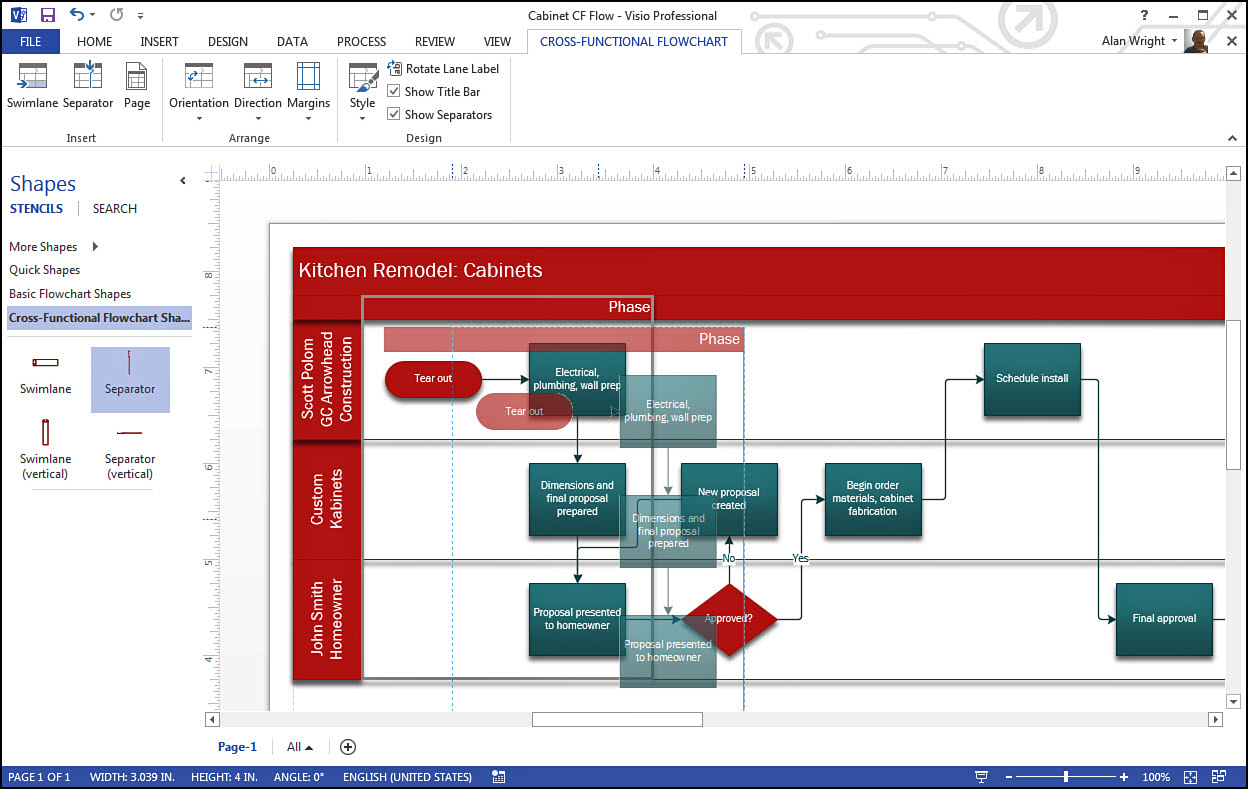
In Visio 2013, the default configuration of this template is a horizontal orientation. Some prefer vertical swimlanes, but consider how the horizontal orientation makes better use of wide-screen displays. As shown in Figure 18.7, vertical swimlanes are still an option in the stencil, and the ribbon allows you to change orientation behavior.
 Tip
Tip
If you often work with cross-functional flowcharts and prefer a vertical orientation, you should make that your default orientation. From the cross-functional flowchart ribbon tab, select Orientation and then select Set Default. You can then establish your preferred orientation as Horizontal or Vertical. Click OK to make this the new default when opening new flowcharts.
Adding Swimlanes
Adding swimlanes is easy. You can drag them over from the stencil, insert from the Ribbon tab, or right-click to insert. You can also hover between two existing swimlanes at either end of the container; a small triangle appears that allows you to insert a swimlane at that point.
→ To learn more about working with swimlane containers, see page 148.
Phases are another feature of cross-functional flowcharts. They are used to further segregate tasks and processes by stages. They can be added by dragging into the flowchart from the stencil or inserting from the contextual Ribbon tab. In Figure 18.7 you can see that a phase has been added. A nice feature with phases is that they behave as a container. You can see that moving the phase in this example brings the shapes in the swimlanes along for a ride. Phases can be resized or moved after being positioned. Resizing causes other shapes to adjust their position within their swimlane rather than be absorbed by a phase.
Resizing Swimlanes
Resizing swimlanes and phases is a straightforward action. Hover over the border you want to move, and you see the cursor change to two parallel lines with arrows indicating the directions of movement. Click and drag to effect the resize. The top-most swimlane in Figure 18.7 has been resized.
One limitation to bear in mind when resizing swimlanes or phases is that they do not become smaller than their contents and the minimum space established in the Margins property for the page. You can adjust the Margins value from the contextual Ribbon tab to modify the minimum space surrounding shapes in a swimlane or phase.
The Cross-Functional Flowchart Contextual Ribbon Tab
When working with cross-functional flowcharts, you see that they have their own ribbon, shown in Figure 18.8.
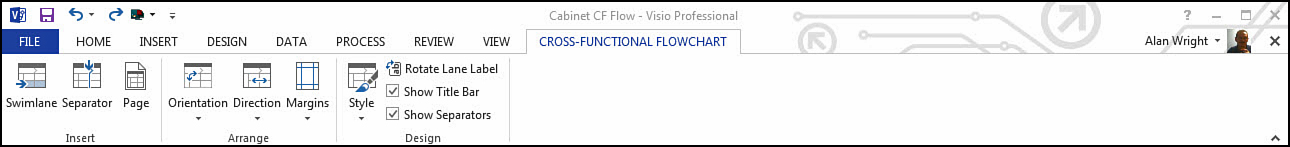
From here you can do the following:
• Insert swimlanes, phase separators, and pages.
• Arrange horizontal or vertical orientation, and toggle direction from left to right or right to left.
• You can establish the minimum space required to surround shapes on the page with the Margins feature.
• Apply several style variations unique to this type of flowchart.
• Use Rotate Lane Label to change the orientation of the text for the swimlane title.
• Show or hide the title bar.
• The Show Separator check box will delete phase separators when unchecked. A warning pops up to let you know that this is a one-way edit. To bring the phases back, you need to re-add them.
Validating Your Diagram
Visio 2013 Professional now includes tools to validate most types of flowchart diagrams. In Figure 18.9, you can see that validation has been run on this cross-functional flowchart by using the Process tab and selecting Check Diagram. Two errors were detected in this example, and you can see that Rules can be selected and even imported to run against your diagrams.
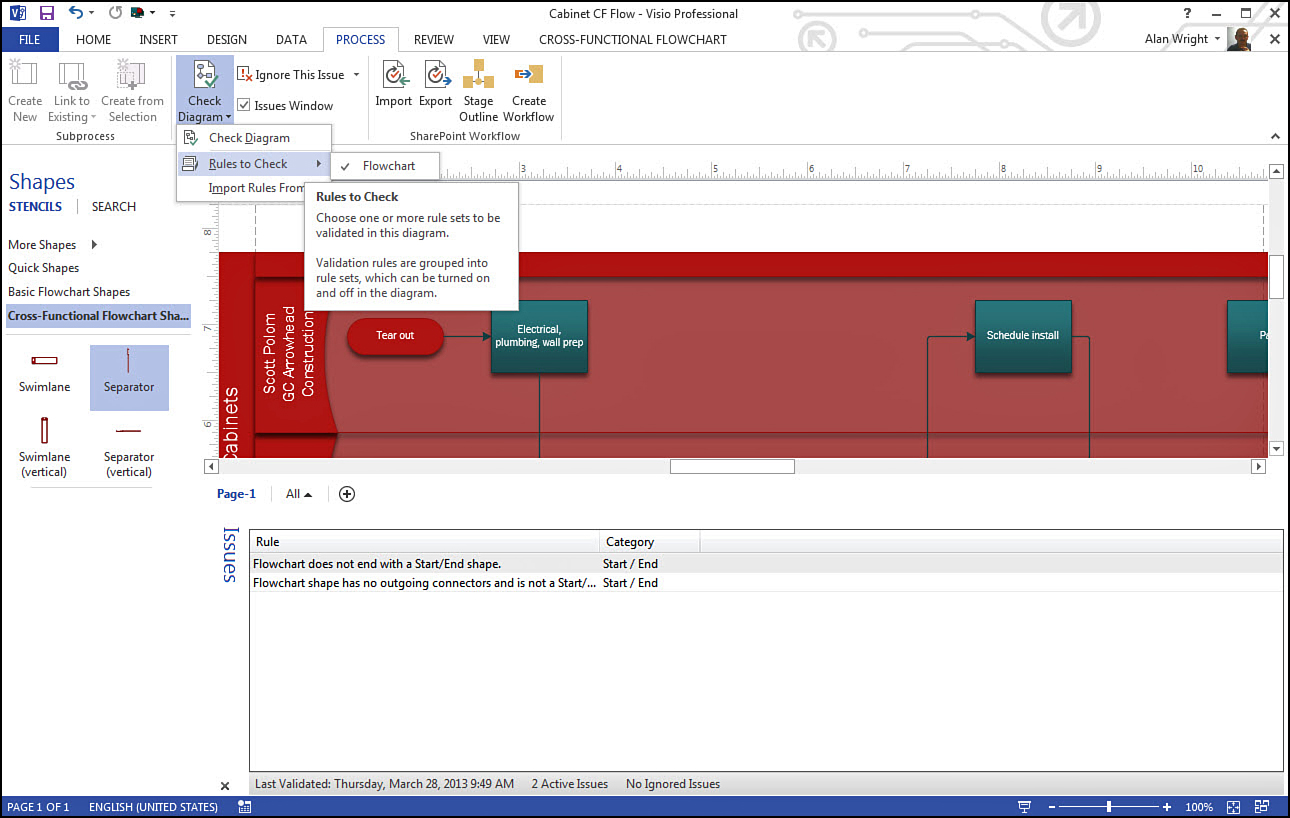
In the Validation section of the Process tab, you can Ignore This Issue, or expand to review ignored issues, Ignore Rules altogether, or Stop Ignoring Issues and/or Rules.
 Note
Note
Validation is not a new feature, however; it was previously available only in the in Visio 2010 Premium version. With adjustments to the lineup of Visio versions released for 2013, validation tools are now included with Professional, and hopefully this will encourage more companies to further develop and take advantage of this useful feature.
Business Process Diagrams (BPMN 2.0) and SharePoint Workflows
BPMN and SharePoint Workflows are considered advanced flowcharting styles and are included in Visio Professional 2013.
BPMN Diagrams
Business Process Model and Notation (BPMN) flowcharts have received better tools including updated validation rules and over 350 new shapes and shape variations that support the BPMN 2.0 standard, which is considered a big upgrade from the BPMN 1.2 standard supported in Visio 2010. (Don’t worry, Visio 2013 still works with the BPMN 1.2 drawings you may have created in the past.)
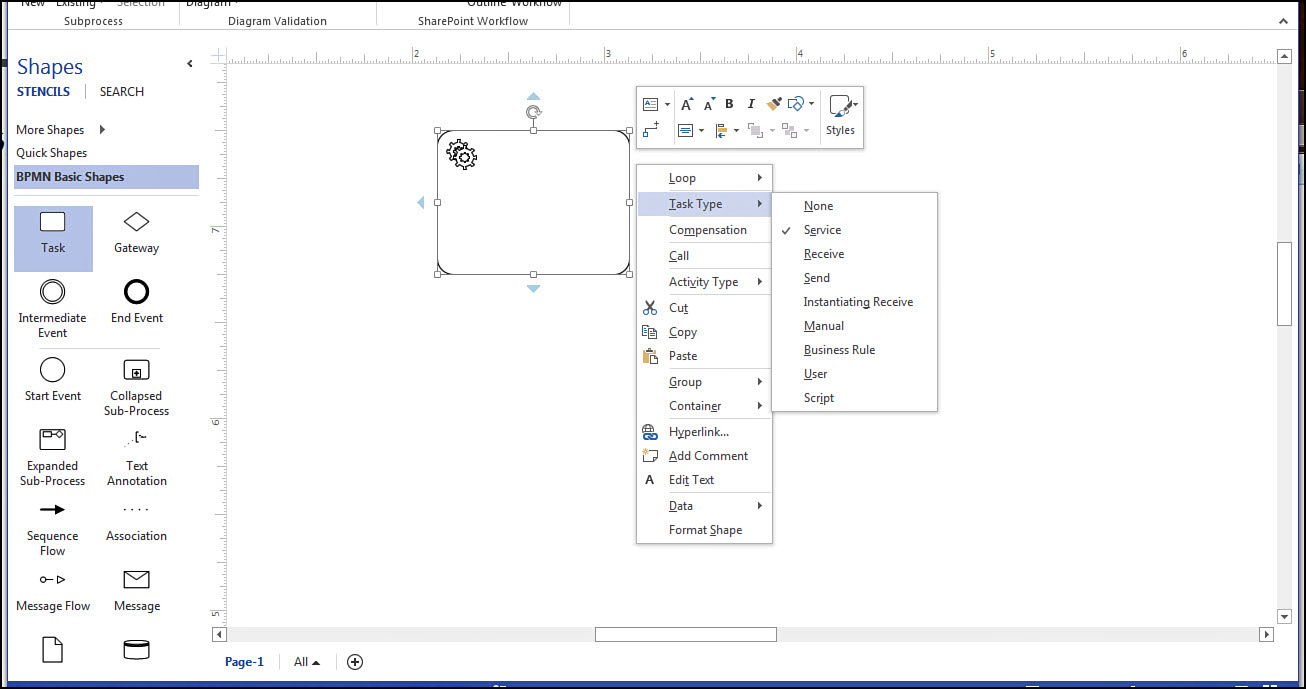
FIGURE 18.10 BPMN flowcharts allow basic shapes to be modified into dozens of variations using context menus.
SharePoint Workflows
Both Microsoft SharePoint 2010 Workflow and Microsoft SharePoint 2013 Workflow templates are included with Visio 2013 Professional. With SharePoint 2013, new validation rules were needed, and they are supported in Visio.
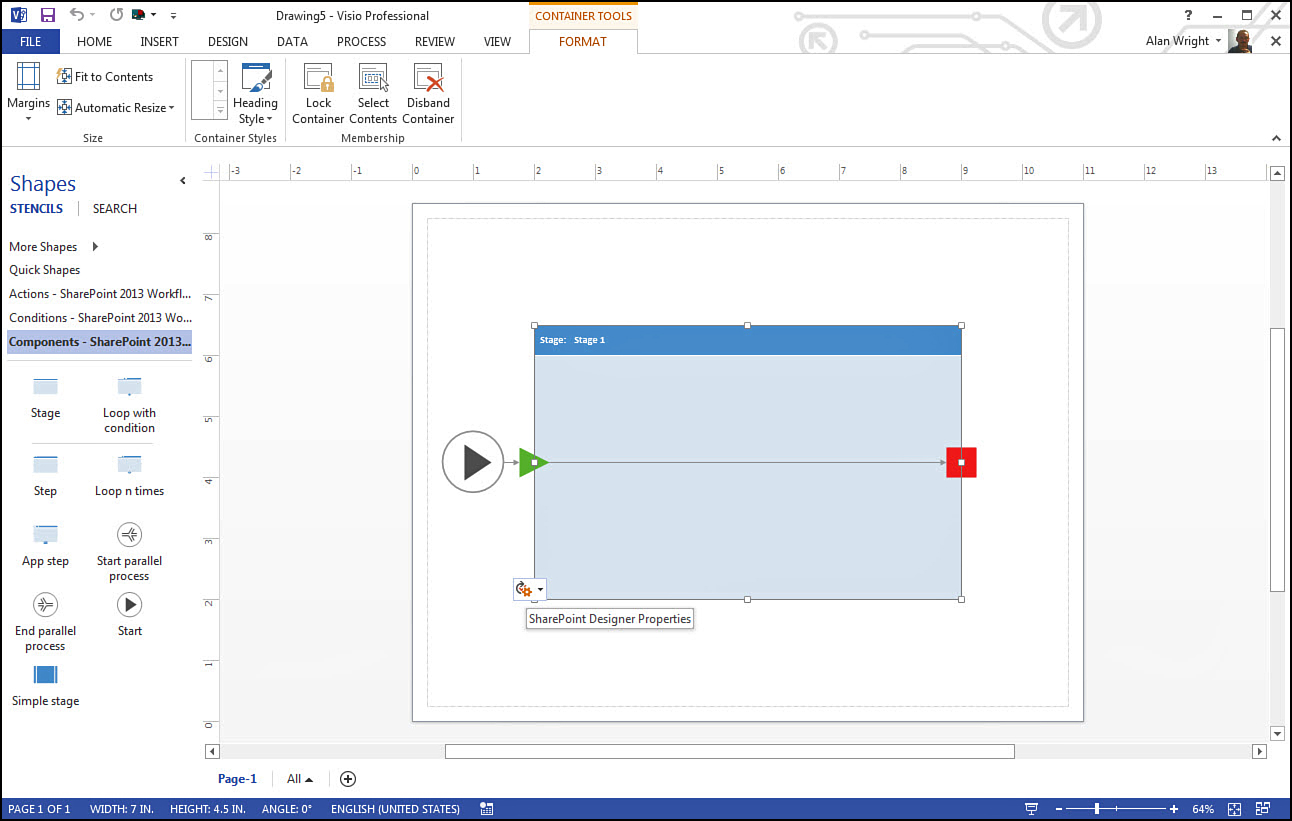
This type of flowchart is intended to map a SharePoint workflow, and the results can be exported to Microsoft SharePoint Designer for configuration. With SharePoint 2013 Workflow, a new start point and many more shapes have been added to the three stencils. Because this template uses a new Stage container, you see the Container Tools contextual tab appear when working with Stage containers, as shown in Figure 18.11. Finally, SharePoint Designer 2013 can open VSDX files without any export process. Just save your workflow to the default Visio drawing format, and you are good to go.
Note
The SharePoint 2013 Workflow template supports .Net 4.0 workflows, and aside from the new Stage container, loops and steps can also be used to group elements of your workflow. When in SharePoint Designer 2013, you also have access to the Visio interface to effect any edits before publishing.
Block Diagram Tips
Block diagrams are not new, and in Visio 2013 you have 2D and a couple 3D variations to choose from. They are often used to capture a variety of design, process, and flow modeling. Block diagram shapes have a few unique qualities that are pointed out here to help you get the most from your block diagrams.
Blend Block Shapes
One key element when working with block diagrams is to blend shapes together. You find a few shapes in the block template stencils that have been designed to allow blending to take place.
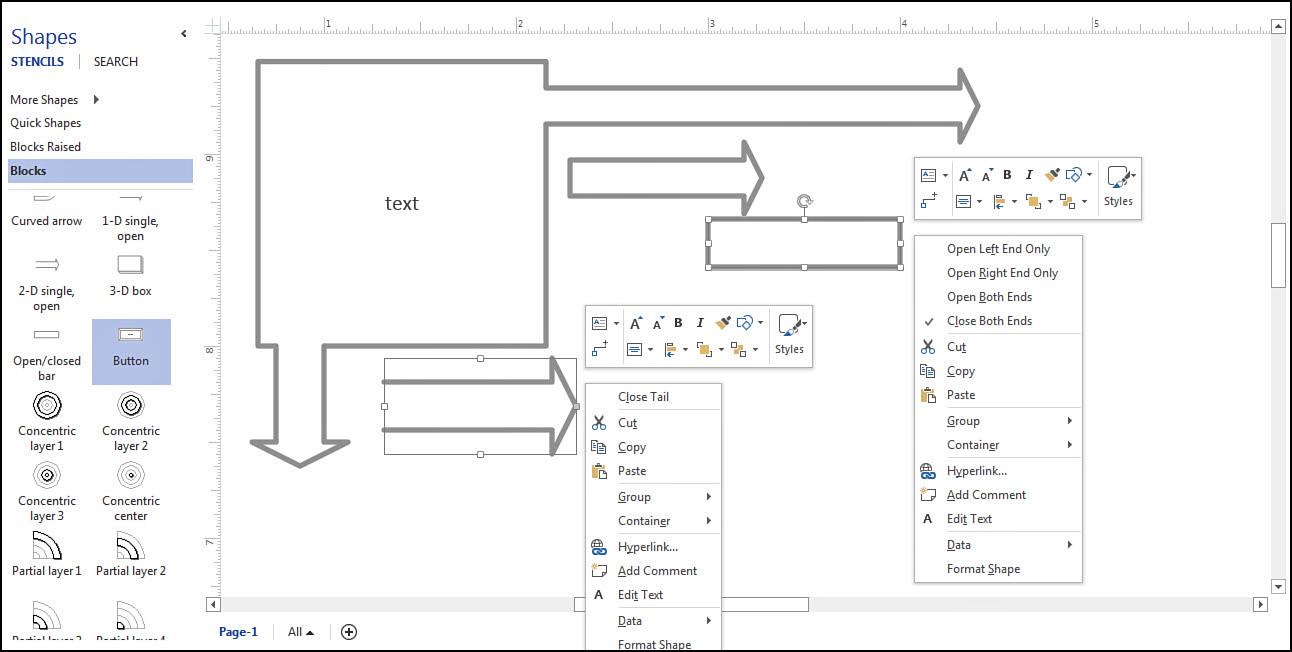
Notice in Figure 18.12 how arrows have been blended into a box shape. These arrow shapes have the capability to have either an open or closed end, which makes this visual feat possible. The context menus are displayed for two shapes that allow you to open or close sections for blending. This feature works in both 2D and 3D shapes.
Tip
If you have trouble getting shapes to look right when you try to blend, make sure that you are not using a theme with gradients or shadows. The blend is essentially an illusion because the shapes remain separate, and they have separate shadows as a result. This effect can be disabled on an individual shape using the Format Shape pane. Another problem might be the Z-order because the open-ended shape must be on top of the shape you are blending to. Use a context menu to choose Bring to Front if this is the problem.
3D Perspective Block Diagrams
The Block Diagram with Perspective template is a special 3D block diagram that uses a vanishing point (VP) to achieve a unique 3D effect on your block diagram. This type of diagram requires a bit of finesse to get everything just right, but it has a very pleasing appearance when used properly.
The rendering is done by treating the top of the shapes as being on the same geometric plane. Most individuals use this presentation to illustrate relationships using the Depth setting shown in Figure 18.13. This can be revealed by using the context menu and selecting Set Depth. Notice the visible difference in these shapes achieved by simply altering the Depth percentage.
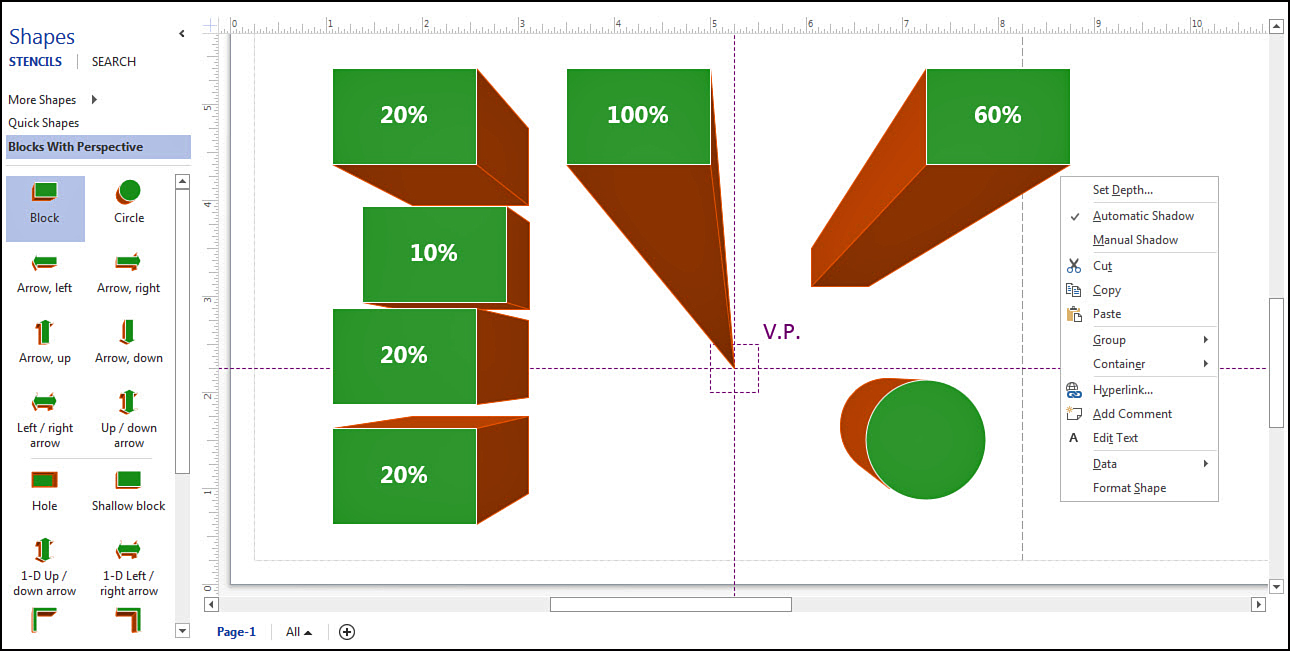
If the VP is moved, prepare to do some housecleaning. In Figure 18.14, the only change from Figure 18.13 is the positioning of the VP. Some shapes need to be moved, and some need a Z-order change.

FIGURE 18.14 Using Perspective can be frustrating at times; expect to spend some time tweaking the results.
 Caution
If you have any shapes selected when moving the vanishing point, only those shapes are affected by the move. You are actually moving a point that is unique to those selected shapes. The VP for the page continues to be indicated by the purple crosshairs. If you do not want to have multiple vanishing points in your drawing, make sure nothing is selected when moving the VP.