
19. Tips for Working with Other Diagram Types
In This Chapter
• Can I use Visio to map my logical network... just like Mr. Spock?
• How can I painlessly create rack diagrams?
• How do I save time when creating timelines without creating paradoxes?
• How can I make org charts that catch the eye (and the rest of the face)?
• How do I keep my plans looking like they were planned?
Visio has so many templates to choose from that Chapters 18 and 19 are dedicated to briefly present tips and examine some of the unique features and special contextual tabs that set a few of these diagram types apart.
Administrators, technicians, and even help desk personnel often rely on logical network diagrams for planning and troubleshooting. Rack diagrams are valuable aids for documenting equipment that is currently deployed in datacenters and network closets and for planning future deployments. Timelines are widely used by many individuals for a variety of purposes.
With Visio 2013, it’s time to face the fact that faces are expected to appear in your org charts. You will enjoy the new tools and content to help liven up your organization. Finally, we all use floor plans, plot plans, utility plans, and maps from time to time. Don’t think that you need to be an engineer to work with these types of diagrams, because Visio makes it easy.
Working with Network Diagrams
Many network engineers and administrators love the easy-to-understand diagrams that can be created using the various network diagram templates included in Visio. Visio 2013 Standard includes only the Basic Network and Basic Network 3D stencils, but Visio 2013 Professional includes AD, LDAP, Detailed Network, Detailed Network 3D, and Rack templates.
 Note
Note
With Visio 2013, new shapes have been added to the Network stencils to reflect modern equipment that is found on networks: smart phones, VOIP phones, tablets, as well as enhanced server shapes to reflect task-specific roles such as mail servers.
Logical Diagrams
Intended to help viewers understand how network resources are interconnected, logical diagrams are not meant to be physical representations of how cables connect computers and servers together or where computers and servers might be physically situated in a location. (Nor is this a Star Trek reference, although Spock would logically use Visio when creating diagrams.) When creating a logical network diagram, you likely need to make a couple of basic changes to help your diagram accomplish its purpose (see Figure 19.1).
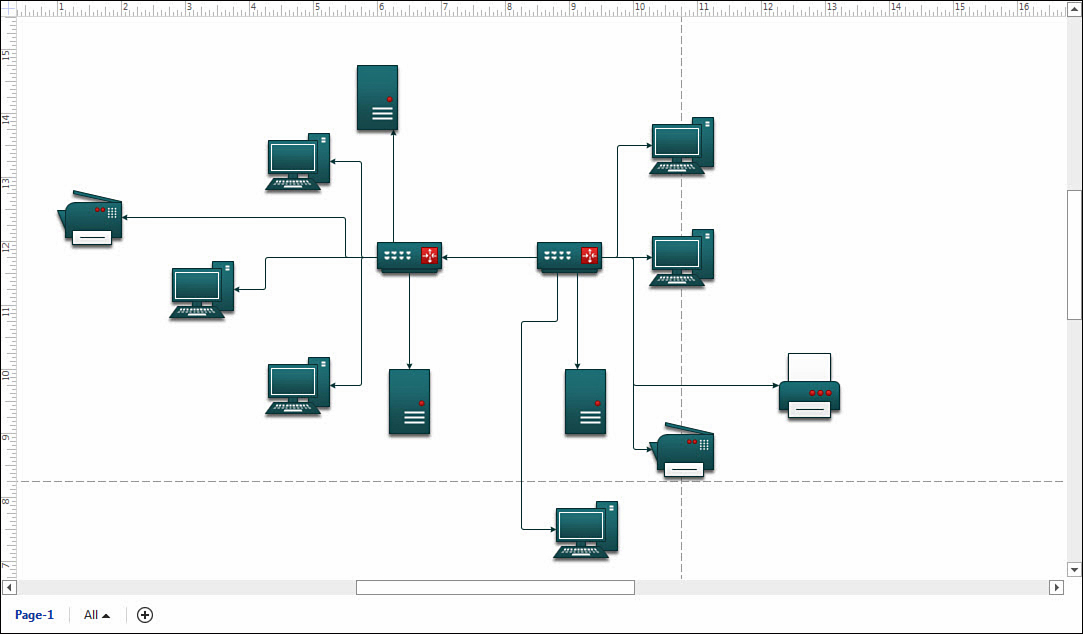
FIGURE 19.1 Logical diagrams such as this basic network diagram should be tweaked to better capture the relationship between networked resources.
In Figure 19.2, you can see several network resources arrayed around two routers that might be located in different cities. Straight connector styles are a better choice than the spaghetti that the dynamic right-angle connectors created in Figure 19.1. Also the default arrow-ended connectors were replaced with no arrow ends using the Format Shape pane.
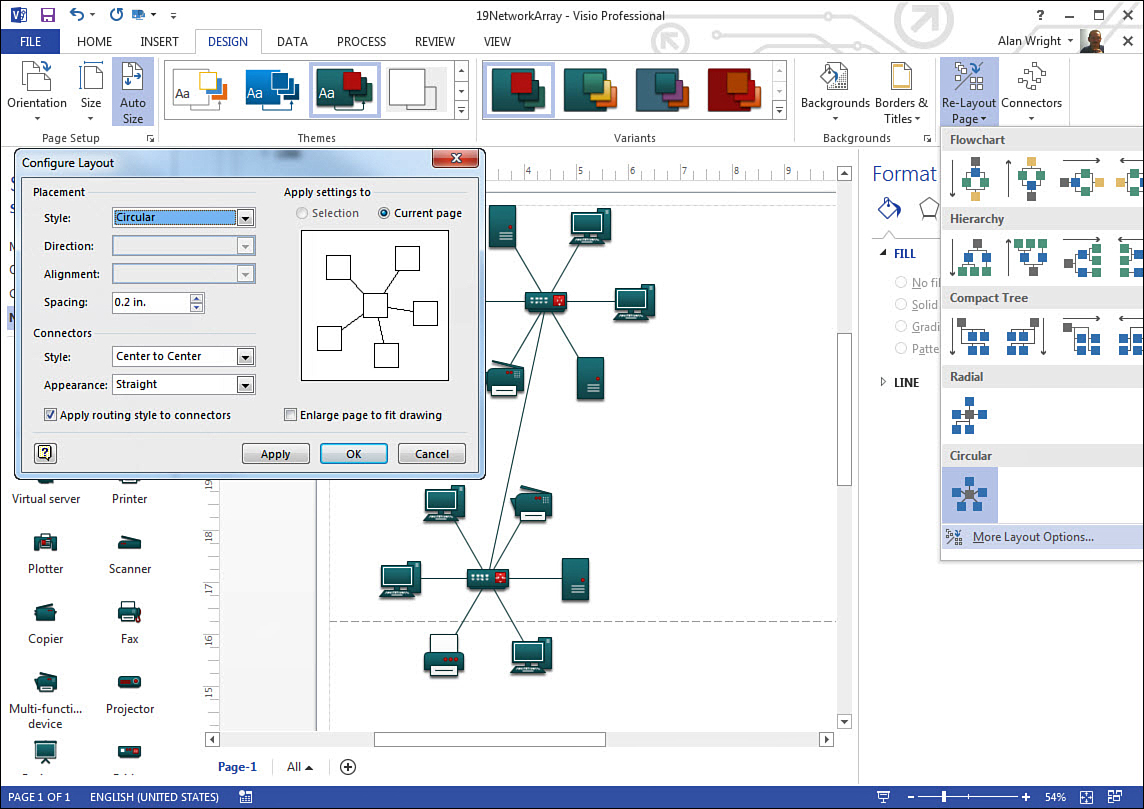
FIGURE 19.2 Use the Configure Layout dialog box to fine-tune a layout for a page or selection of shapes.
An easy way to effect this transformation is to use the Re-Layout Page tool and More Layout Options from the Design tab. In Figure 19.2 you can see the Configure Layout dialog box, which enables you to choose Circular in the Style drop-down menu. The 0.2 choice in the Spacing drop-down menu forms a tighter grouping, and the Center to Center choice in the Connector Style drop-down menu works well with the Straight choice in the Appearance drop-down menu. When using these settings, keep in mind that the changes can be applied to an entire page or just a group of selected shapes.
Rack Diagrams
Unlike logical diagrams, rack diagrams are intended to accurately document the hardware mounted in a server rack or cabinet located in a data closet or data center. For this reason, the shapes tend to be very detailed and match the appearance of standard rack-mountable components, as shown in Figure 19.3.
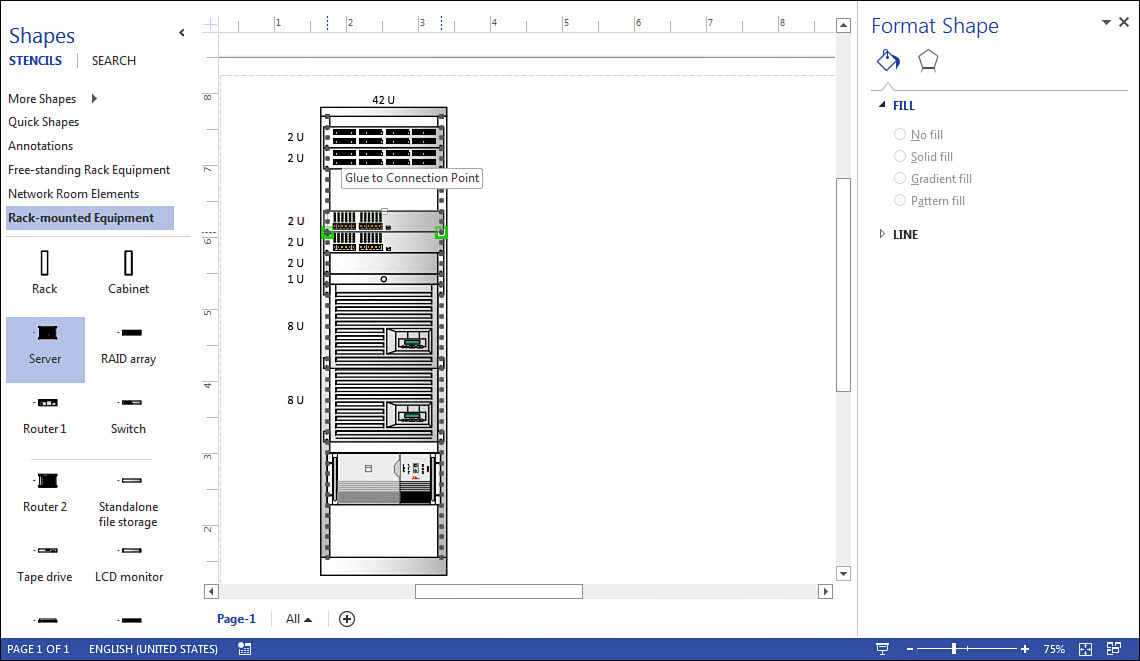
FIGURE 19.3 You should be able to accurately capture the contents of your rack or cabinet in a rack diagram.
Note
Rack diagrams are included with Visio 2013 Professional and Visio Pro for Office 365.
Finding Shapes
Many of the shapes that are intended for rack diagrams are found in the stencils that open when you open the rack diagram template. Because these diagrams are widely relied on for planning and documentation, many manufacturers provide Visio stencils to match their rack-mounted equipment. Additional stencils can also be downloaded from Microsoft that include common branded components from Sun, IBM, HP, and other established manufacturers. A quick Internet search for Visio stencils includes up-to-date shapes from many other companies.
→ To learn more about finding stencils and other online resources, see page 304.
Placing and Attaching
When rack-mounted shapes are dragged to a chassis or cabinet shape, they snap to glue points automatically and by default indicate the amount of rack units they occupy with a visual 1U, 2U, or more. Notice in Figure 19.4 that two glue points are highlighted as a shape snaps into a 42U rack. You can see the vertical dots that indicate rack mount points. To accurately capture how your rack or cabinet is set up, you might want to zoom in and use the rack unit measurements as a reference. When glued, they move with a cabinet or rack when it is moved.
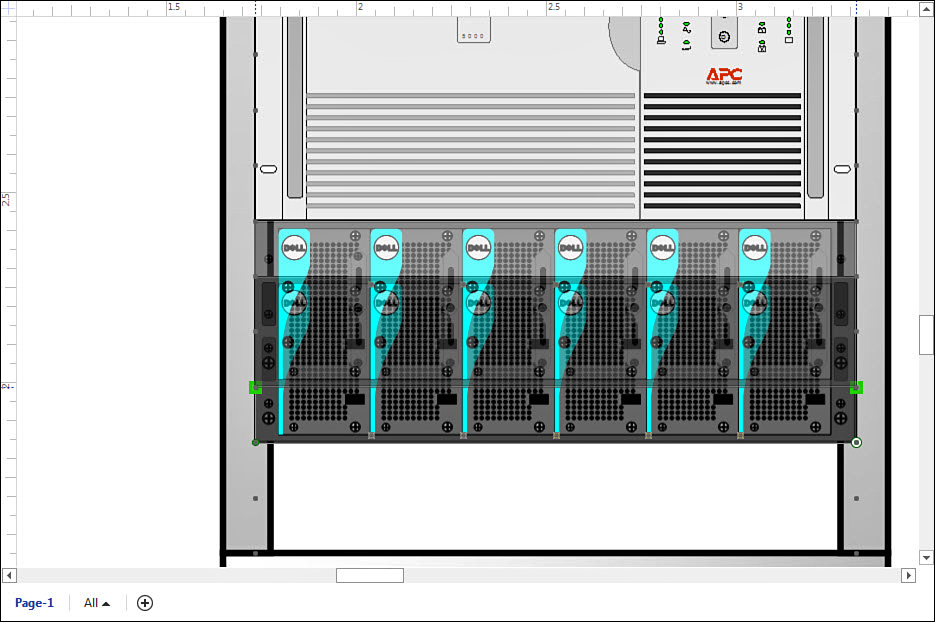
FIGURE 19.4 Rack diagram shapes snap to predefined glue points and become part of the rack or cabinet they are glued to.
Timeline Tips
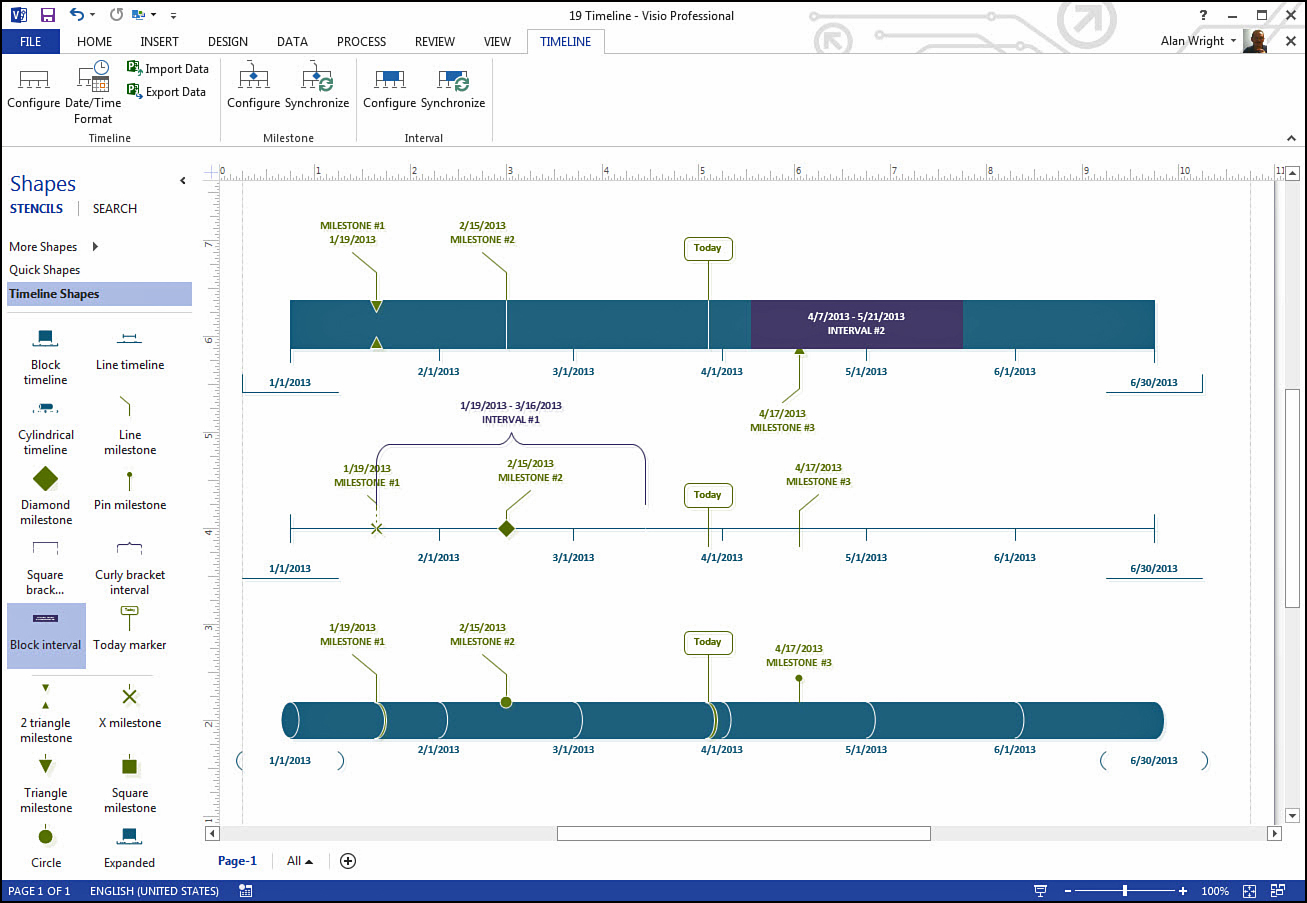
Timeline stencils include three basic shape types: Timeline, Milestone, and Interval. These can be combined to create schedules, historical overviews, projected timelines, and so on. As shown in Figure 19.5, you can use and combine many variations of these three basic shapes.
Note
The Timeline template is available in all versions of Visio.
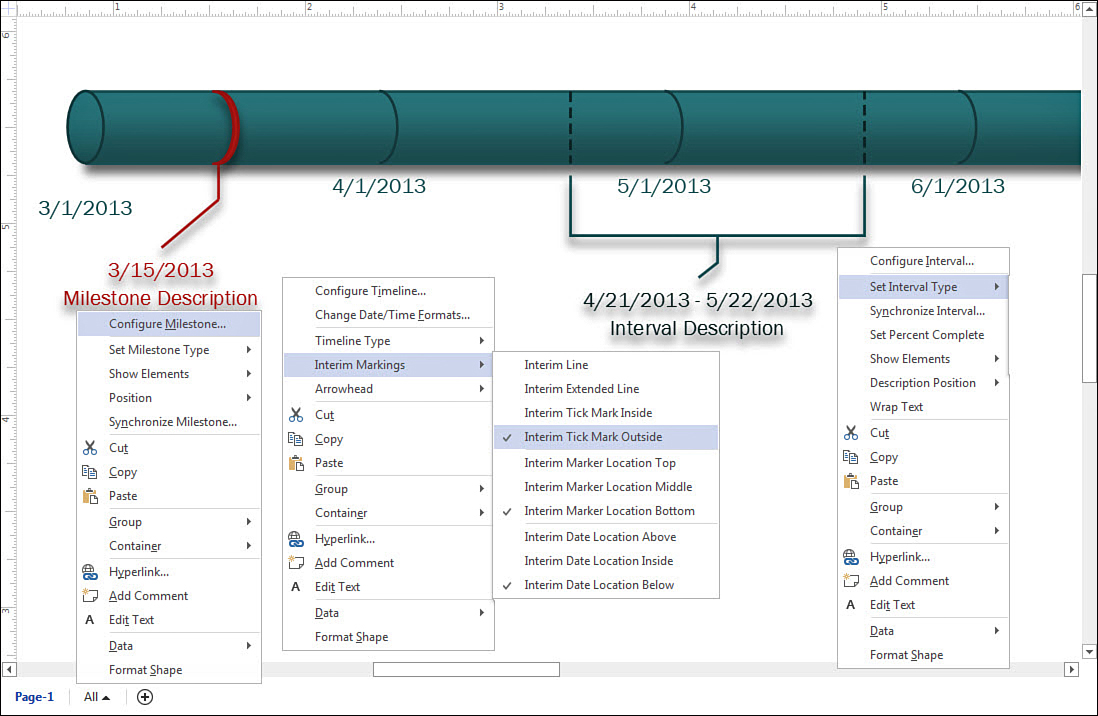
Many settings can be adjusted using context menus; a few examples are compiled in Figure 19.6. Notice that timelines, intervals, and milestones all allow you to change type using the context menu. It is also easy to correct dates, orientation, and even hide elements all from the context menus.
Timelines have their own contextual ribbon, as shown in Figure 19.5. Using the ribbon you can use the Configure button to edit the time endpoints, scale, and time format. The Date/Time Format button is a bit more granular, allowing you to edit format options for all visible time reference fields. There are buttons to synchronize milestones and intervals. These can be useful when scheduled events influence other events.
Finally, you have tools to import and export from Microsoft Project files. (Note that you must have Project installed to perform this.) When importing, you can select the task types you want to import: All, Top-level tasks only, Milestones only, Summary tasks only, or Top-level tasks and Milestones. You can then assign the Visio style of shapes to be used for Timeline, Milestone, and Interval shapes.
Org Chart Tips
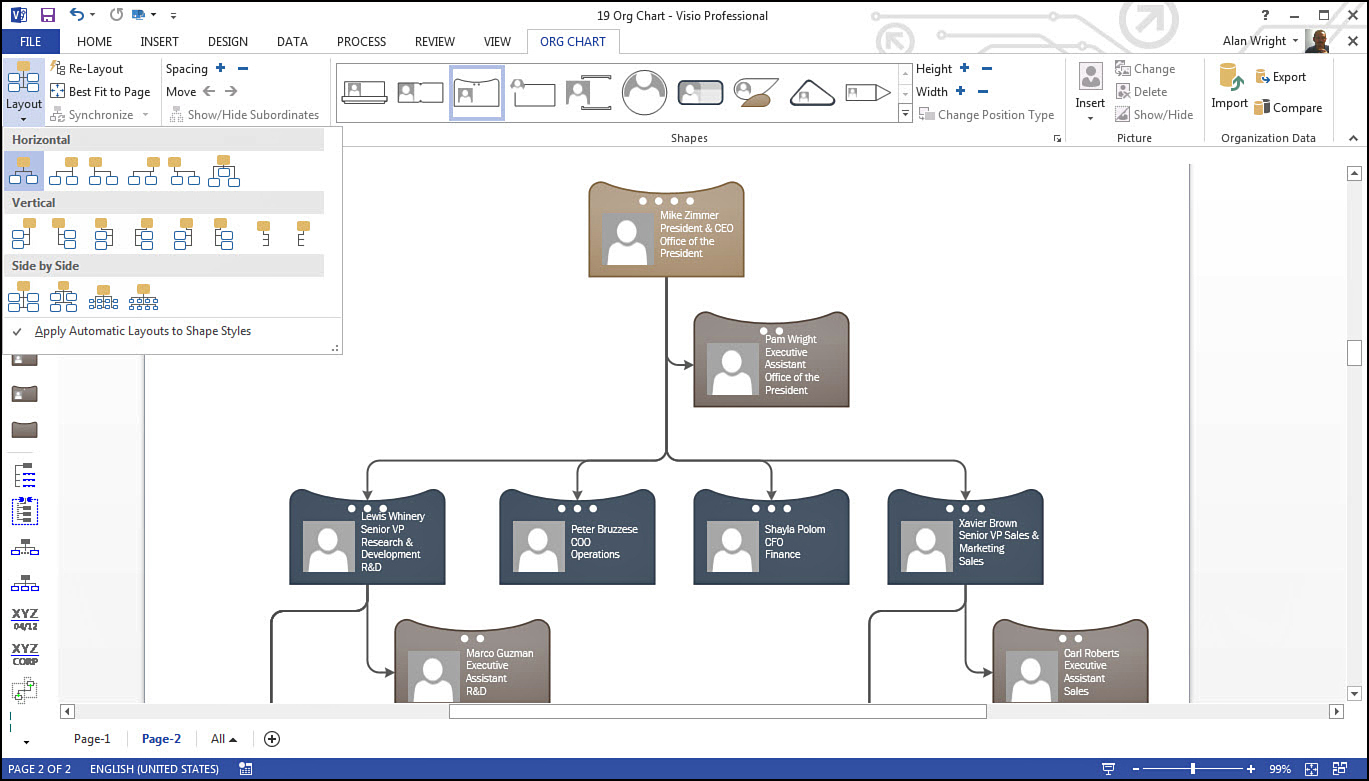
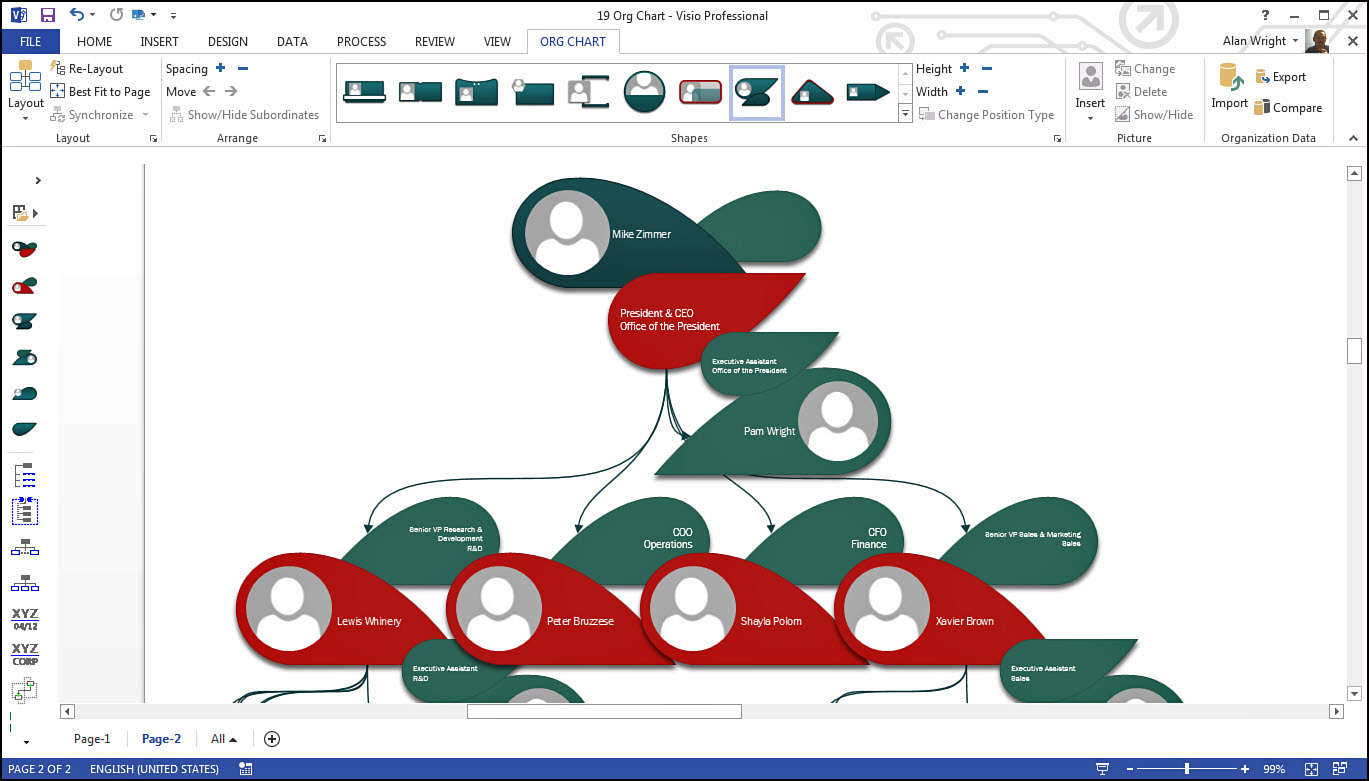
Organization (org) charts have been shaken up a bit with Visio 2013. Emphasis has been placed on creating fresh and exciting visual alternatives to the standard boxy org chart that everyone has grown accustomed to. Ten new styles and dozens of new shapes have been introduced; the new Pip style is shown in Figure 19.7.
Note
The new org chart styles are designed to work with the Embellishments feature. This new feature provides a few more variations in the overall appearance of shapes designed to respond to this setting. To change the Embellishment setting, navigate to the Design tab and expand the Variants section to reveal Embellishment. You can choose among High, Medium, or Low settings. This setting is then applied to the entire page and cannot be applied to selected shapes.
→To learn more about the Embellishment feature, see page 76.
Org charts have their own contextual tab, which includes a nice layout tool that can be seen in Figure 19.7. Besides the general layout options, you can change spacing and sizing.
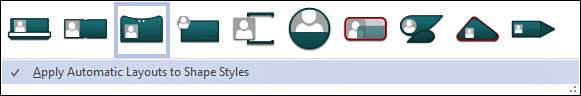
A prominent section of the Org Chart tab is the shape styles gallery labeled simply as Shapes. This allows you to apply a different style to your org chart. Because of the intense rendering that takes place, there is not a hover preview of a style change. Some styles drastically alter the layout of an org chart. Change styles from Pip to Petals, for example, and you see a jump to a broad, airy layout, which makes it harder to see everything in one place until you zoom out. To control this default behavior, expand the Shapes gallery to reveal Apply Automatic Layouts to Shape Styles and uncheck it (see Figure 19.8). This can also be toggled on and off from the Layout button in the same Org Chart tab. You can use this for comparing styles, but as Figure 19.9 shows, the final chart is likely to need to have a layout that works with the style used.
Create Org Charts Manually
If you want to create an org chart from scratch using Visio shapes, you should be aware of some characteristics and handy tools. Hierarchical connections are expected when working with org charts, so to add a subordinate position, simply drop one shape on top of another, and the new shape is connected automatically. (You can be less precise now than in the past; a slight overlap is enough to trigger this connection.)
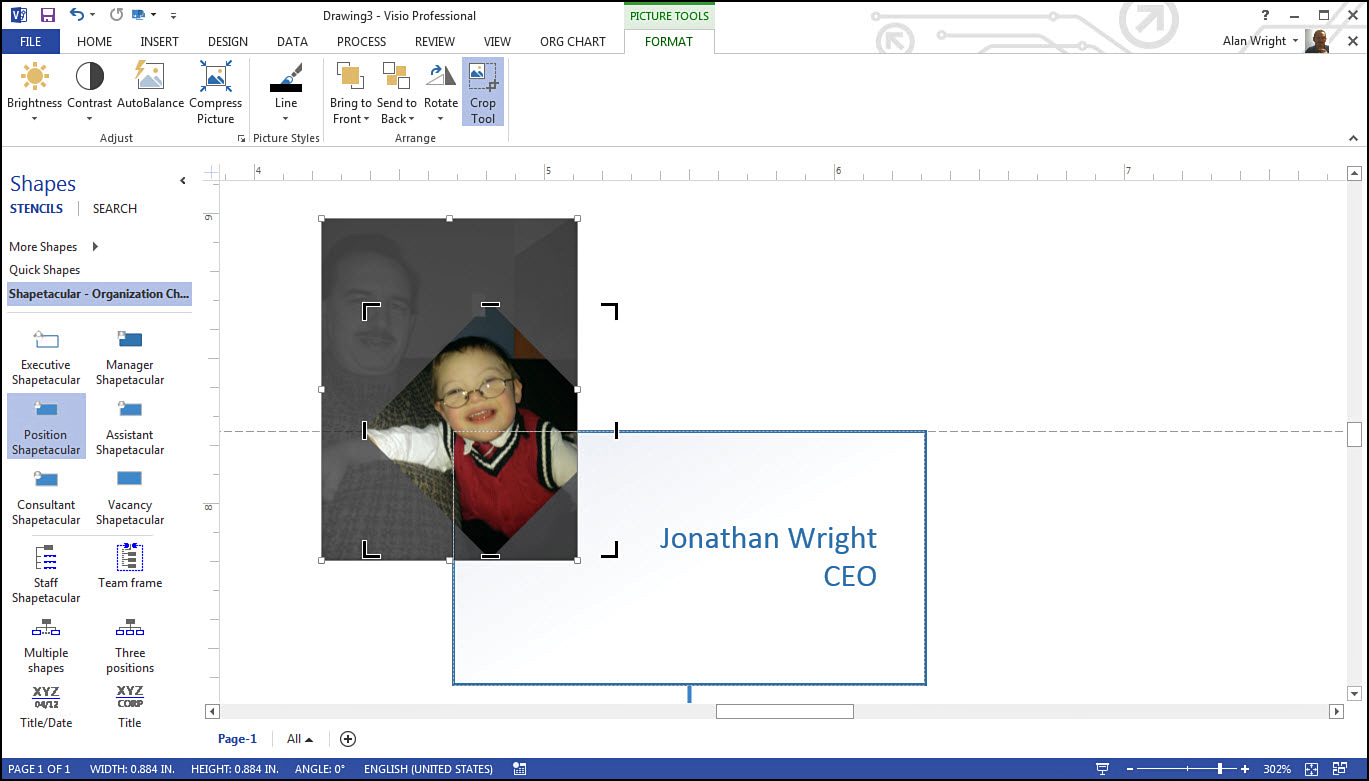
In Figure 19.10 you can see several options that can be accessed using the context menu. The Shape Data pane also can be invaluable for updating or correcting data in your org chart. Org charts accept updates either in the text fields or directly in the Shape Data pane. In either case, the entry is synced. Use Insert to add images to your shapes. As shown in Figure 19.11, and explained further in the sidebar “Use Photos in Your Org Charts,” photos are an important element in modern org charts.
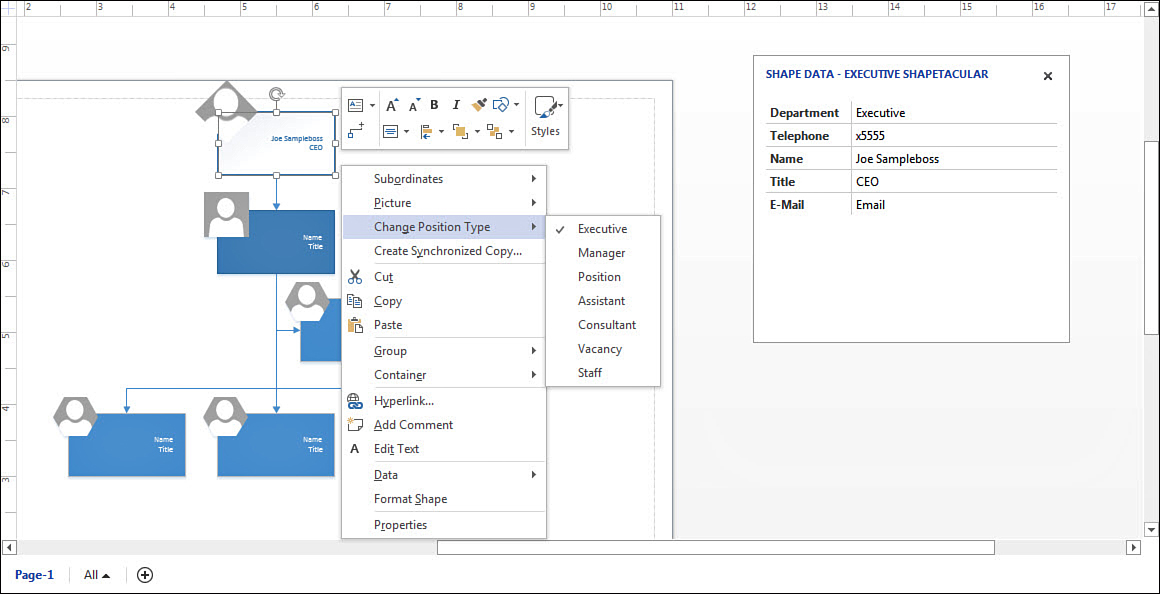
FIGURE 19.10 Use the Shape Data pane and the extensive context menus to tweak your org chart shapes.
Using the Organization Chart Wizard
Visio works well in rendering prepared information from Excel spreadsheets or other sources. This will save you time since Visio can easily extract common fields such as name, phone number, department and title all from a spreadsheet using a wizard. To test the creation of an org chart from a spreadsheet using the Organization Chart wizard, use the sample spreadsheet named ORGDATA.xls that was installed on your computer when you installed Visio. It is found in the path C:Program Files (x86)Microsoft OfficeOffice15Visio Content1033 on 32-bit English installs. Of course, if you have a spreadsheet already prepared you can use that file in the following steps.
1. Open an org chart template. When the Organization Chart wizard opens, select Information that’s already stored in a file or database and click Next.
2. Select A text, ORG PLUS (*txt), or Excel file when choosing where your information is stored, and then click Next.
3. Browse to the location of the file that contains your data and click Next (see Figure 19.12).

4. Select the column names in the spreadsheet that are relevant to the org chart and click Next. (If using the sample file, you can leave the default choices of Name and Reports_To.)
5. Add any data file columns to the Displayed Fields column to include those fields in the actual display on the shapes and click Next.
6. Add fields that you want to include in the shape data. This does not make them visible in the org chart; it simply includes them in the Shape Data pane. They may include the same choices as step 5. Click Next.
7. You can include pictures from an exchange server or folder. If you’re using the sample spreadsheet, leave the default selection as Don’t Include Pictures and click Next.
8. Leave the default selection to allow the wizard to divide your chart across pages, and then click Finish.
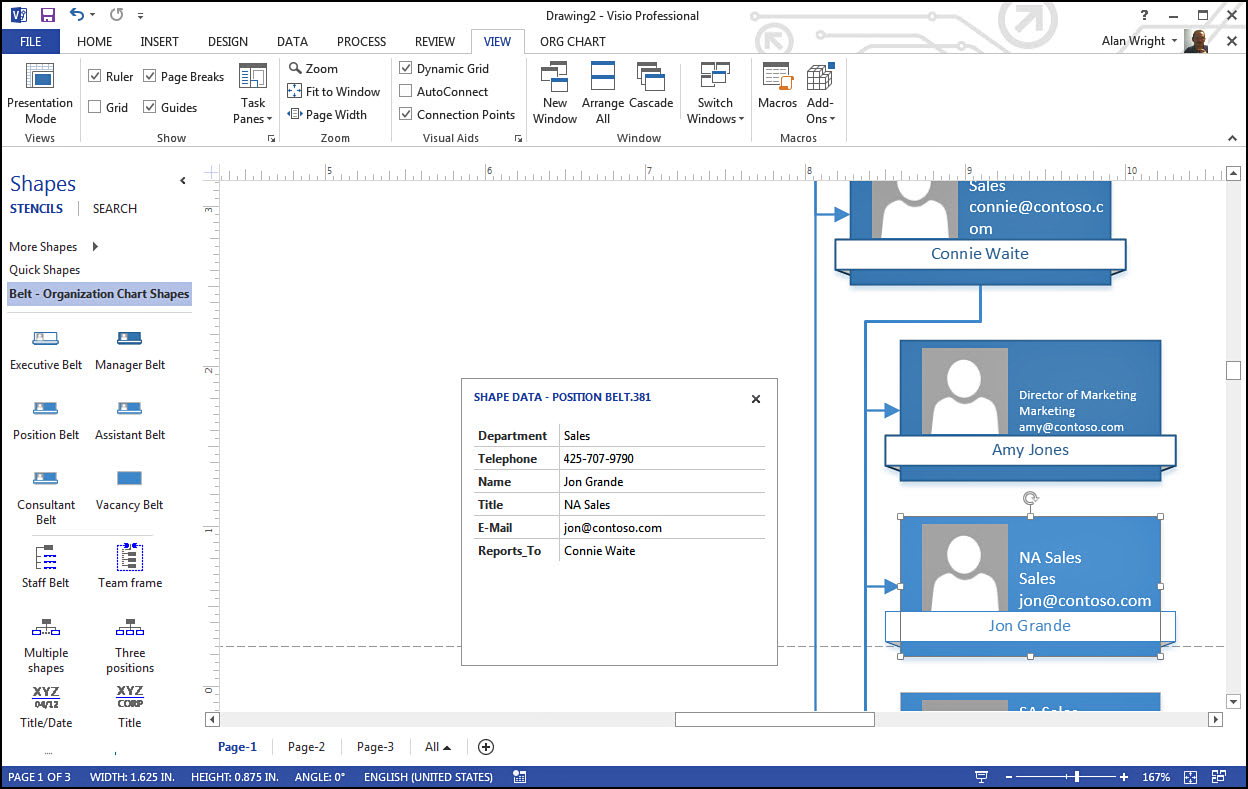
9. Compare displayed data to the Shape Data pane as shown in Figure 19.13. It reflects choices you made in steps 5 and 6. Notice that you have more than one page, and scroll down on Page-1 to see all the individuals included.
You can also create a chart on-the-fly using the Organization Chart wizard. Rather than choosing Information that’s already stored in a file or database, select Information That I Enter Using the Wizard. This can be a formidable task if you’re starting from scratch because the information you need is stored in a spreadsheet or a delimited text file, which is then used to create the chart. Type in a name and select a location to get started.
If you choose delimited text file, you will see a notepad open asking you to enter data using the format “Name,Reports_to,Title,Department,Telephone,” and a couple of lines of sample data is provided to assist you. Make your additions and then save the file. Visio then converts this data into an org chart that you can work with.
Office and Space Plans
When you’re working with plans, you need to be aware of a few unique characteristics. Wall shapes tend to autoconnect to other wall shapes, and shapes glued to walls tend to move with walls. Walls have a single side that is referred to as a reference line. Using the context menu for walls, you can flip the side used for the reference line, add a guide line, or add a dimension. Guide lines can be handy visual reference points. To remove a guide line, select it and press Del.
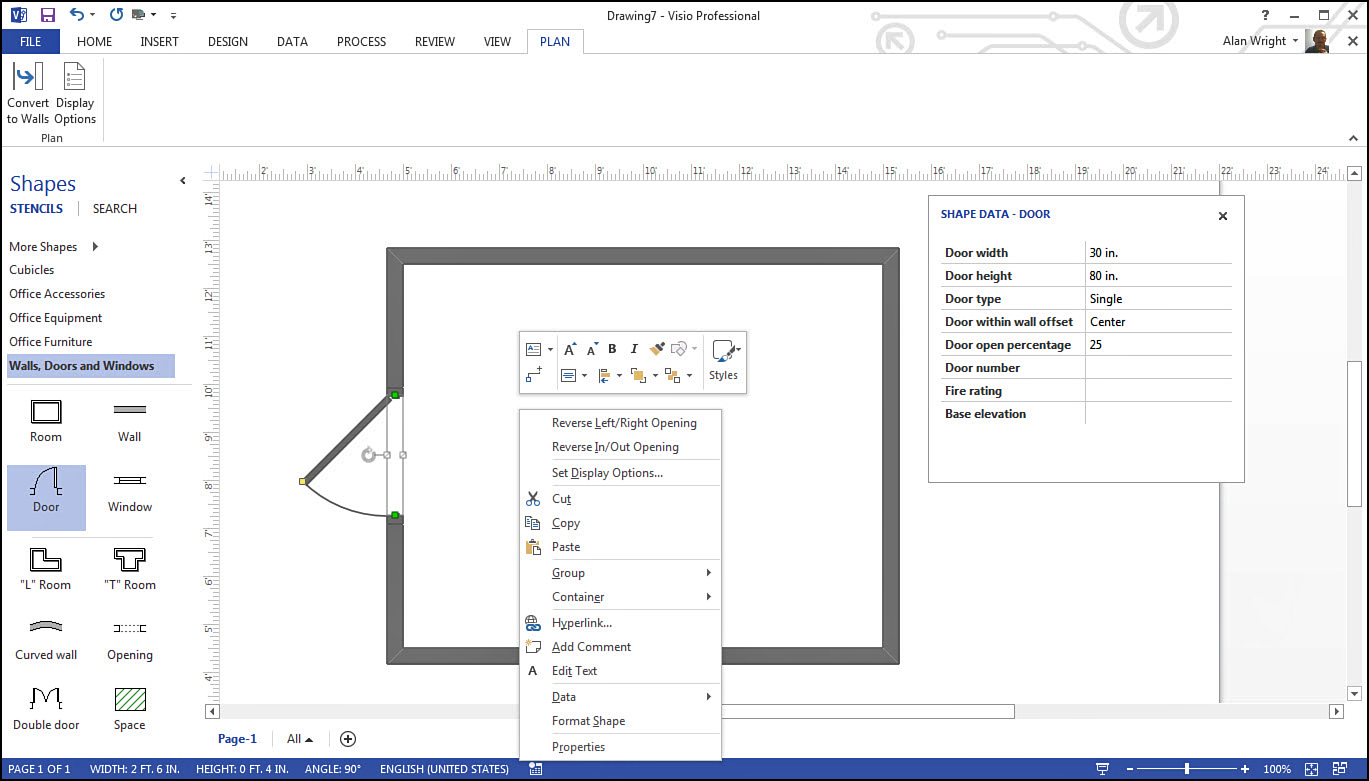
Some shapes found in Floor Plan templates have been designed to provide many layout variations with a single shape. As shown in Figure 19.14, you can use the context menu to reverse the direction and orientation of door shapes, for example. Further changes can be made from the Shape Data pane for these shapes, such as dimensions and degree of opening to show in the drawing window.
Note
Visio 2013 Standard includes the Maps and Office Layout templates. You need Professional or Pro for Office 365 versions for more advanced plans, including HVAC, Electrical and Telecom, Home Plan, Plant Layout, and many more.
Creating Plans Using Shapes
Depending on the plan template you selected, you may be working with interior floor plans. If you need to include exterior walls, make sure the Wall, Shell, and Structure stencil is open. Rather than using a room shape, consider using a space shape and converting it to exterior walls. You can start with the basic rectangular space shape, or use the L- or T-shaped space shapes. Use the Convert to Walls tool and select exterior walls. If you select an individual wall and view the Shape Data pane, you see a Wall Thickness field. Here you can select from standard measurements to convert exterior or interior walls or set a custom thickness.
Besides the shapes, you can use drawing tools to provide the shape you want to start with, as shown in Figure 19.15. From the contextual Plan tab use the Convert to Walls tool to turn a rough sketch into walls that you can work with. In Figure 19.15, you can also see the Convert to Walls dialog box that lets you select interior or exterior walls, whether to show dimensions or guide lines, and what to do with the original lines you drew. In Figure 19.16, you can see the results of the sketch in Figure 19.15.
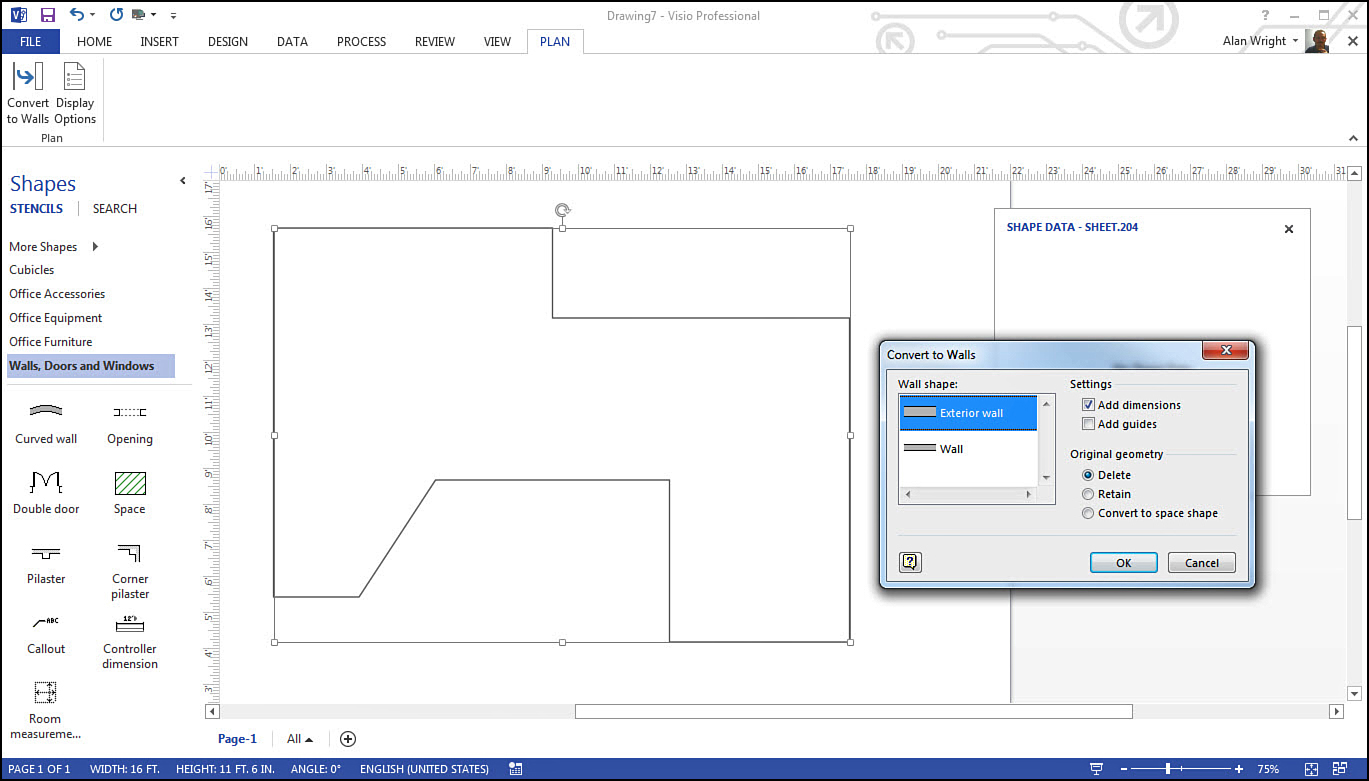
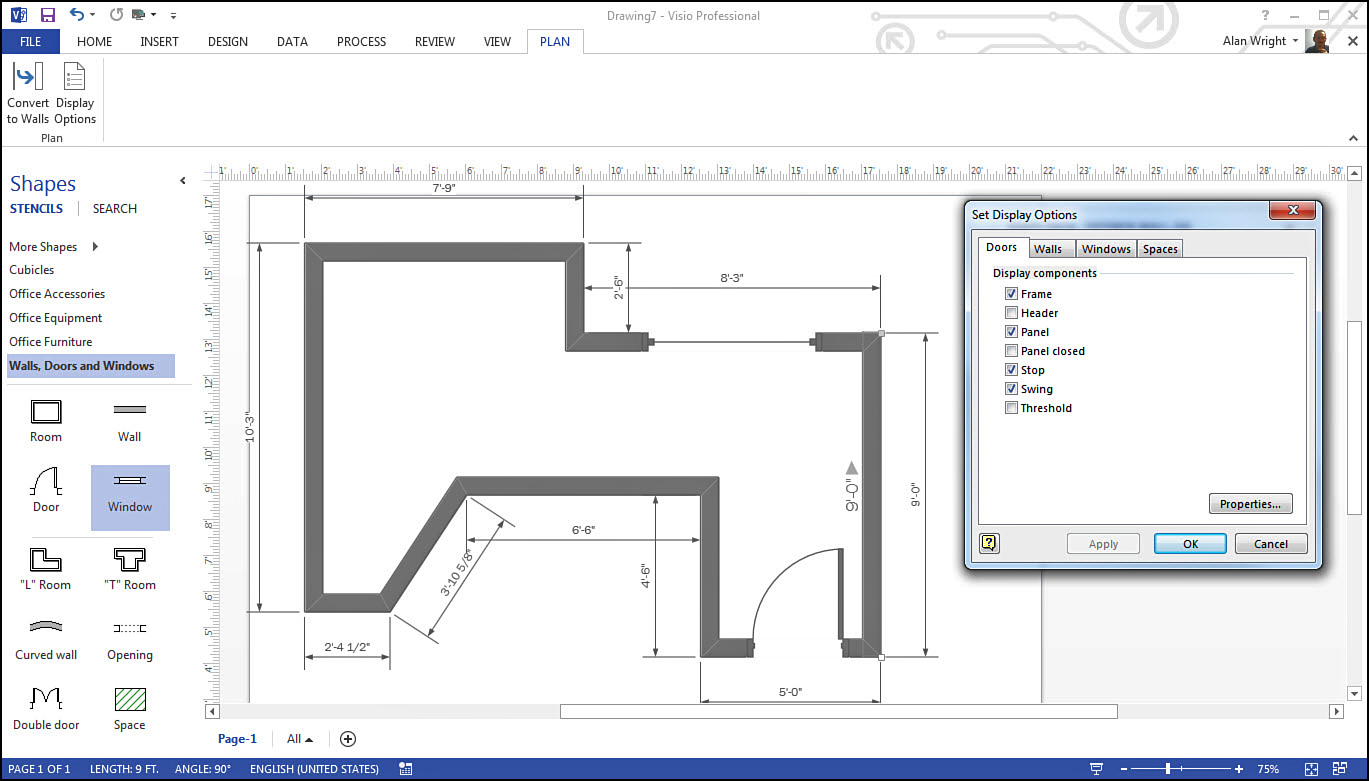
FIGURE 19.16 You can customize the appearance of walls and other shapes using the Set Display Options dialog box.
 Tip
Tip
Depending on how you create a shape using line tools, dimensions may be presented on the inside or outside of the final shape after you have run the Convert to Walls tool. Working in a counterclockwise direction produces dimensions on the outside (as shown in Figure 19.16). Creating lines in a clockwise direction results in dimensions being displayed inside of the finished shape.
The Plan tab also includes a tool to let you select how much of the wall, door, and window shapes are visible. The Door tab can be seen in Figure 19.16.
Space Shapes
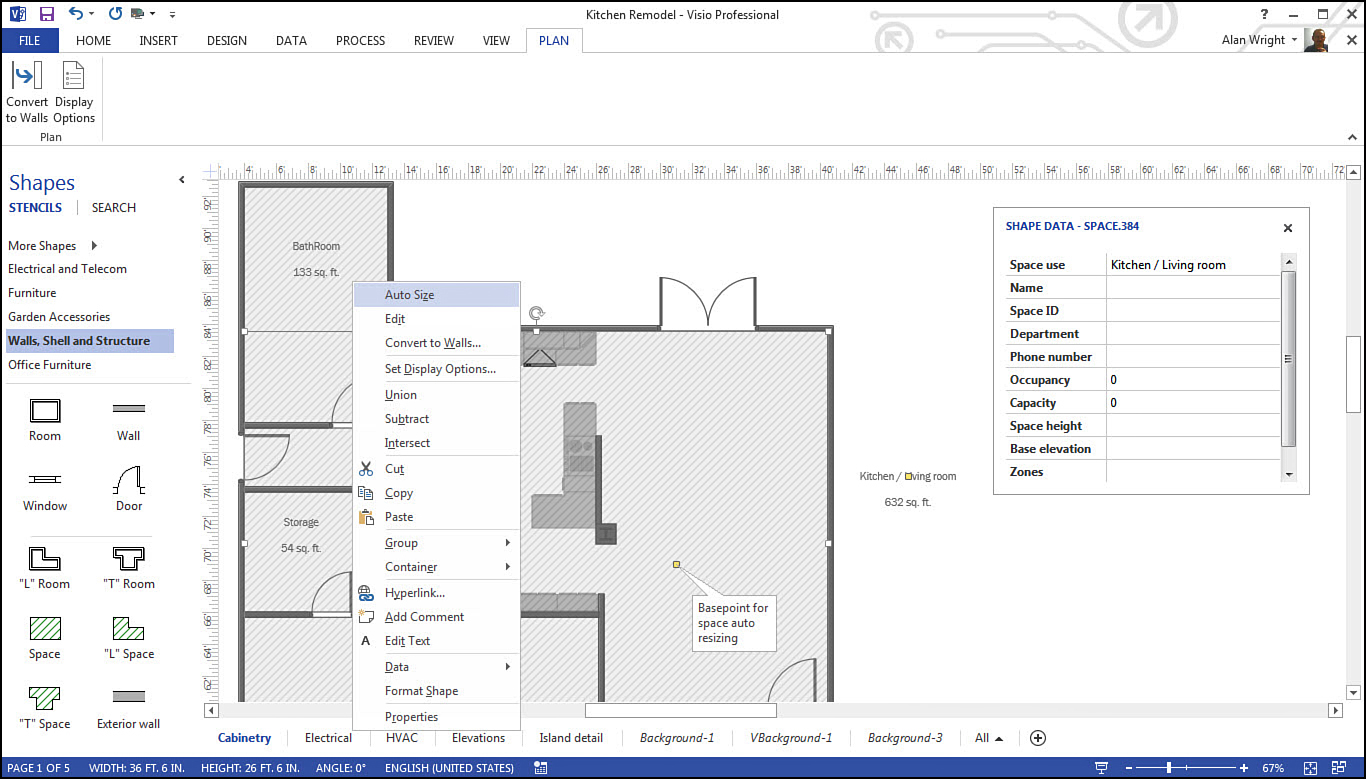
If you have never used them before, Space shapes can be very useful. Drop a Space shape into a room, right-click, and select Auto Size. You see the shape resize to fit into the room it was dropped into. Notice in Figure 19.17 that a few rooms have the cross-hatching that indicates a Space shape is present. You can see a context menu for the Space shape as well.
If the area you want to work with is only a portion of a room or even an exterior area, you can right-click and select Edit, which allows you to customize the size of the Space shape by putting you into Edit mode. You can select and move points to adjust the Space shape, and the area updates as you make adjustments. Press the Esc key to exit Edit mode when you’re finished.
The Shape Data pane allows you to type in additional shape data entries, which can be displayed. From the context menu select Set Display Options to select up to four Shape Data fields you want to show. This is a practical way to display extra information for a room like names, department, phone numbers, and so forth. By default, the area is calculated, and you can choose from various units of measurement.
A Space shape has two important points to be aware of. In Figure 19.17, you can see a Basepoint for the Space shape. The second has been pulled off to the right of the shape and is a locator for the displayed text. Either point can be selected and moved, providing you with lots of versatility in this special shape.
Working with Dimension Lines
When working with plans, it is important to use a dimension line to display key reference measurements. Although Visio may know the dimensions, and they may be revealed in the shape data, visual dimensions remain useful elements for floor and building plans. If you plan to print, it becomes even more important to include these.
As mentioned earlier, if you right-click a wall shape, you have the option to choose Add a Dimension. This is simply adding a dimension line shape for you. You will find open stencils dedicated to Dimension shapes appropriate to your plan when you open a template. In Figure 19.18, the stencil is named Dimensioning–Architectural.
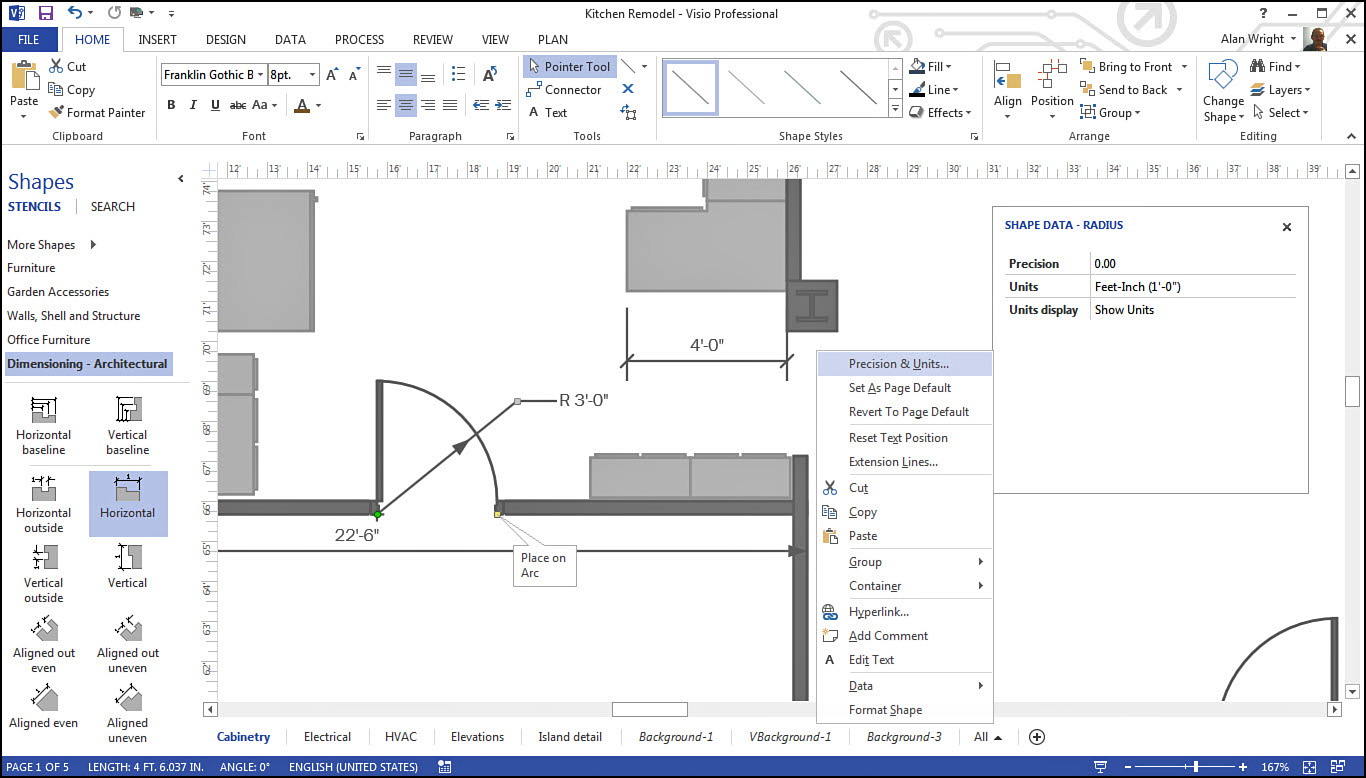
Notice in Figure 19.18 that a few Dimension shapes have been added to a floor plan. The 36-inch doorway has a Radius shape added; the control point labeled Place on Arc dictates the measurement displayed as R 3’-0”. Notice the Shape Data pane provides options to control what is displayed and the unit of measurement used. Also visible is a cabinet that has a Horizontal Dimension shape added. You can adjust the size and location of the displayed measurements fairly easily by selecting and dragging control handles. The context menu is also displayed, which allows you to fine-tune units of measurement and display options. You can also establish new page measurement defaults or reset the selected shape to the current default page properties.