Working with Breakpoints, Conditions and Actions
In Chapter 2 you learned about breakpoints and how to break application execution before some statements are executed. You now learn some interesting features of breakpoints when debugging Visual Basic applications. This section also describes a new breakpoint experience in Visual Studio 2015.
The Breakpoints Window
Using the Breakpoints window, you can manage all breakpoints in your solution. You can open such a window by pressing Ctrl+Alt+B. If you placed three breakpoints in the sample application, Figure 5.2 shows how the Breakpoints window would look.
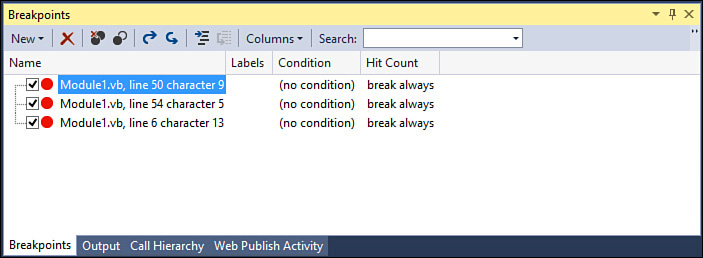
In the Breakpoints window, you can easily manage your breakpoints. For example, you could delete, temporarily disable, or enable again the breakpoints. You can also specify the behavior for each breakpoint, such as Hit count, Filter, and other functionalities that are described next. Also, you can easily switch to the source code in which the breakpoint is located or to the disassembly view. (See Figure 5.12 in the “Call Stack Window” section later in this chapter.) An important opportunity is exporting and importing breakpoints; Visual Studio 2015, as well as its predecessor, can export to XML files the list of breakpoints or import a list from an XML file. If you have lots of breakpoints, you can search breakpoints according to specific criteria using the Label feature, which this section focuses on next. The Breakpoints window provides a graphical unified instrument for performing operations on breakpoints.
Editing Breakpoints Labels
You can add labels to breakpoints. Labels are a kind of identifier that can identify more than one breakpoint, and their purpose is categorizing breakpoints so that you can easily find and manage them within the Edit Breakpoint Label window. You can add a label to a breakpoint by right-clicking the red ball (also referred to as the red glyph) on the left of the desired breakpoint in the code editor and then selecting the Edit Labels command from the pop-up menu. The Edit Breakpoint Labels window appears (see Figure 5.3).
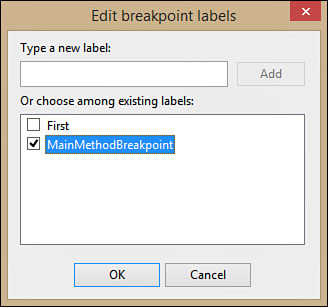
You need to specify labels and click Add. When you finish, select the label you want from the list and click OK so that the label is assigned to the breakpoint. You can assign the same label to multiple breakpoints performing the same steps, or you can assign multiple labels to a single breakpoint. Assigning labels to breakpoints can be reflected into the Breakpoints window in which you can search for breakpoints specifying labels in the search box.
Configuring Breakpoint Settings: Conditions and Actions
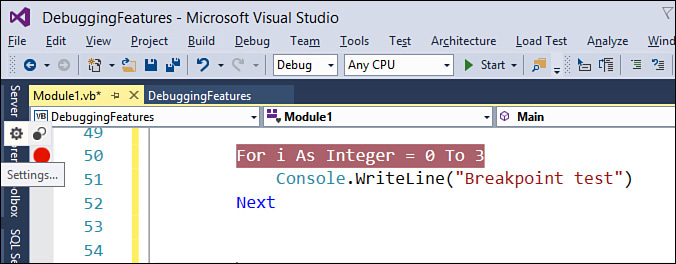
If you have experience with previous versions of Microsoft Visual Studio, you already know that you can configure some special breakpoint settings. You might be surprised to see that Visual Studio 2015 provides a totally new experience in configuring breakpoint settings. You can still decide when breakpoints should condition the application execution, but Visual Studio 2015 allows you to accomplish this in a more logical way and, most importantly, without the need for modal dialogs. In particular, for each breakpoint, you can specify conditions and actions. Conditions determine when the debugger should break the application execution when it encounters a breakpoint, whereas actions allow special tasks to occur when a breakpoint is hit. Conditions and actions can definitely work together. In order to configure a breakpoint’s settings, you hover over the red glyph and click the Settings button available on the small toolbar that appears over the glyph (see Figure 5.4).
After you click Settings, Visual Studio 2015 opens a peek window (see Figure 5.5), which is very similar to the Peek Definition window you saw in Chapter 2. This is different from the past editions of Visual Studio, where you used modal dialogs that would block your activity. Here you can still focus on your code and never leave the active editor window. In a peek window you can configure both conditions and actions.

Conditions determine whether the debugger should break the application execution when it encounters a breakpoint. As shown in Figure 5.5, the options for conditions in this case are Conditional Expressions, Hit Count, and Filter. The Conditional Expressions option allows the application execution to break when the specified expression evaluates to True or when the expression changes. For example, consider the following code snippet and say that you have a breakpoint on the Console.WriteLine statement:
For i As Integer = 0 To 3
Console.WriteLine("Breakpoint test")
Next
Now suppose you want to break the application execution only when the value of the i variable is 2. The condition you apply at this point requires the Is true evaluation and the i = 2 expression, as shown in Figure 5.6.
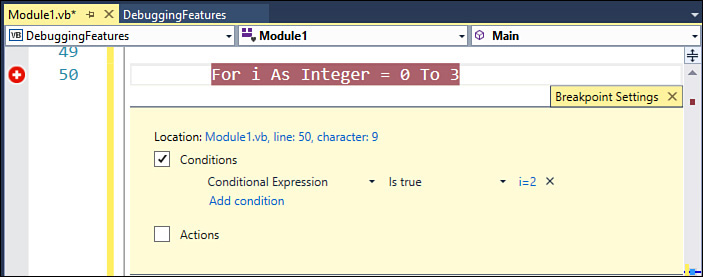
You can take advantage of IntelliSense while writing the expression.
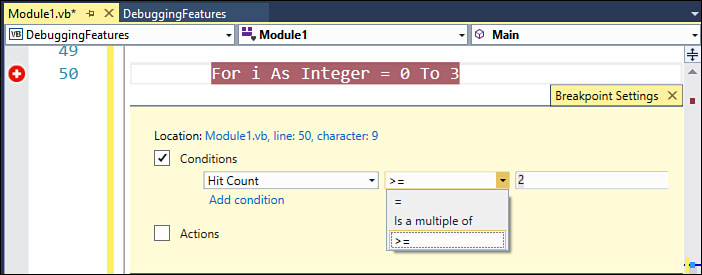
The next option is Hit Count. With the hit term we mean each time a breakpoint is encountered and therefore the application execution should stop. You can control the hit’s behavior. For example, imagine you have a cyclic code that contains a breakpoint, but you need to break the execution only when the cycle arrives at a particular point. By using the Hit Count option, you can specify when the debugger must break the application. For example, consider the For loop in the previous code snippet.
Imagine that you place a breakpoint on the Console.WriteLine statement and that you want the debugger to break only starting from the second iteration. You can specify this condition by selecting the Hit Count option. If you do not explicitly specify a Hit Count condition, the default setting is always break, which means that the debugger breaks the execution each time a breakpoint is encountered. Possible options are = (equal to), Is a multiple of, and >= (greater than or equal to). For example, if you set the condition to >= with value of 2, (see Figure 5.7), the previous code breaks starting from the second iteration. This option can be convenient when you need to debug your code only from a certain point.
The last option, Filter, allows the application to break execution when the breakpoint is hit on a particular thread, process, or machine. You simply specify the process name, thread ID, or machine name.
Tip
You can add multiple conditions by clicking Add Condition. Also, you can easily remove conditions by clicking the closing symbol (x) near each one.
It is now time to talk about actions. In previous versions of Visual Studio, actions were known as tracepoints. An action basically allows you to write the specified information to the Output window.
You can set one of the built-in expressions to build a kind of log message that will be written to the Output window. For example, Figure 5.8 shows how to send the call stack to the Output window by using a function called $CALLSTACK.
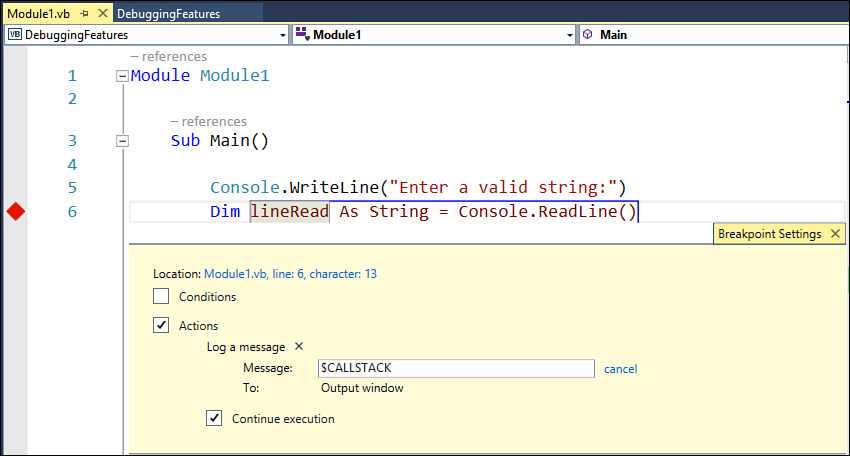
IntelliSense shows the list of available functions when you type the $ symbol. Also, you can write custom expressions. For more information on custom expressions, see this blog post from the Visual Studio team: http://blogs.msdn.com/b/visualstudioalm/archive/2014/10/06/new-breakpoint-configuration-experience.aspx.