
7.2. Collecting the Data
Each sales representative works his or her own territory, which is a geographic region of the United Kingdom defined by a collection of postal codes. A given territory contains physicians arranged in practices, where each physician has a particular medical specialty. The physicians write prescriptions for patients who visit their practices, aiming to provide them with the best possible care within the prevailing constraints. A sales representative will periodically make calls on a prescribing physician to promote the use of Pharma Inc.'s products, while representatives from competing companies do the same thing. During a visit, if a promotion is running, the sales representative may leave behind a promotional sample kit. Sales representatives control their own time and, before Rick joined, typically met with their sales manager about once a year.
Rick downloads company data on the performance of the sales representatives for May through December 2008 into a Microsoft® Excel spreadsheet. He intends to use this data to address both of the questions posed by his manager. He realizes that there has been some turnover in the sales force in 2008, but this has been minor. For his purposes, Rick decides that he will only include data for sales representatives who dealt with the same physicians for the entire eight-month period. He eliminates those few sales representatives who were active for only a portion of the eight months.
At this point, Rick easily imports his Excel data into a single JMP table called PharmaSales_RawData.jmp. The data table contains 95,864 rows and 16 columns. A partial view of the data table is given in Exhibit 7.2.
Figure 7.2. Partial View of PharmaSales_RawData.jmp
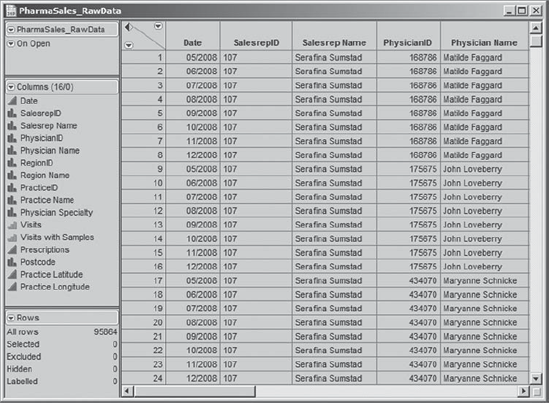
The columns are listed and described in Exhibit 7.3. Each row in the data table is uniquely defined by Date, Salesrep Name, and Physician Name. The variables Visits, Visits with Samples, and Prescriptions give the number of occurrences in the month defined by Date. Note that the four ID columns are simply codings of the corresponding Name columns, so that one of each pair is redundant.
Figure 7.3. Variable Descriptions for PharmaSales_RawData.jmp

Recall that we use Ys to represent responses and Xs to represent variables that might affect the Ys. Prescriptions is the main Y variable of interest. Visits and Visits with Samples may be considered as input or X variables, because they are under the control of the sales representatives and are expected to have an impact on Prescriptions, or as Y variables, since they are the outcomes of past choices made by the sales representatives. Aside from Practice Latitude and Practice Longitude, which are used for mapping purposes, the other variables are either ancillary variables or stratifying variables that describe how Rick's sales system is currently configured and operated, and the environment in which it has to function.