
5.6. Revising Knowledge
At this point, Jane is confident that she has identified a number of Hot Xs. She is ready to move on to the Revise Knowledge step of the Visual Six Sigma Data Analysis Process.
To find conditions that will optimize the pricing process, as well as to ensure that no significant Xs have been overlooked, Jane decides that she will involve her team members and a larger group of sales representatives in discussing her observations and conclusions and in suggesting ways to improve the pricing process. After all, the sales representatives are the ones working with the pricing management process on a daily basis, and Jane knows that their knowledge and support will be critical when she moves into the imminent improvement phase of this project.
Once this is accomplished, Jane will meet with Bill to formulate an improvement plan. She intends to monitor pricing over a short pilot period in a limited market segment to verify that the improvement plan will lead to sustainable benefits before changes are institutionalized.
5.6.1. Identifying Optimal Strategies
Jane sets up a number of workshops where she presents the findings of her data analysis. She is delighted and even surprised by the enthusiastic feedback that she receives. Typical comments are:
"I really like what you showed me.... It's simple to understand and tells a really clear story."
"I've been frustrated for a while. Now at last I can see what is going on."
"At last—someone prepared to listen to us—we've been saying for some time that we need sales managers to understand some of our problems."
"It really looks like we are being out-negotiated. If we focus on our strengths and exploit the great products we have, then I'm sure we can win."
"We've allowed our competition to drive prices down for too long. We need to do something quickly, and this gives us some really good ideas."
Specifically the sales representatives highlight:
The need for more training in negotiation skills.
The need for more realistic sales management guidelines and price targets through a tailored price management process. A target 5 percent price increase across the board is seen by them as a very blunt instrument. They want a more finely tuned approach that aims for higher increases where Polymat has strong competitive advantage (as in the Strategic Security and Strategic Critical product categories), but lower target increases in commodity areas (as in the Tactical Profit product category). They strongly feel that this would allow them to focus their time and negotiating energy where the return on their investment is the highest.
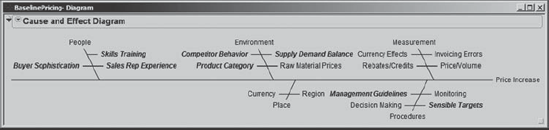
Jane captures all the Xs that might lead to effective price increases, from both her analyses and ideas generated by the sales representatives, in a cause-and-effect diagram (Exhibit 5.44). She constructs this in JMP, using Graph > Diagram. Using boldfaced, italicized text, she highlights potential causes that are identified as important based on her data analysis and the sales representatives' discussions. She saves a script that reproduces her work to the data table, calling it Cause and Effect Diagram. (The reader is encouraged to consult the Help files to see how this diagram is constructed; search for Ishikawa. The data are in the table CauseAndEffectTable.jmp.)
Figure 5.44. Cause-and-Effect Diagram for Price Increase
Jane now consolidates her findings for a summary meeting with Bill. She summarizes the Xs identified from a combination of the data analysis and the sales representatives' input in an Impact and Control Matrix, shown in Exhibit 5.45. From her experience, Jane finds this to be a powerful tool for crystallizing findings and directing an improvement strategy.
Figure 5.45. Impact and Control Matrix

The Impact axis is the relative size of the impact that an X has on overall process performance. For those Xs for which she has quantitative information, Jane uses this information to help make decisions on their degree of impact. However, for Xs where she has only qualitative information from the sales representatives, this assignment is necessarily more subjective.
The Control axis relates to the degree of control or influence that can be exercised on this X through process redesign. Environmental factors, such as Buyer Sophistication, are not things that can be influenced (absent unethical business practices)—sales representatives have to deal with the buyers who are facing them in the negotiation. However, the training of sales representatives, such as the type of training, frequency of training, and appropriateness of training, is within the control of Polymat.
Interestingly, Jane places Supply Demand Balance in the Medium Control category despite its appearance as an environmental factor outside Polymat's control. The reasoning behind this is that although Supply Demand Balance itself cannot be directly controlled, Polymat's leadership team can control the timing of any price increase in response to market conditions. She feels that this timing could be better managed to ensure that price increases are attempted only when the overall supply/demand balance is favorable, such as in periods of relative shortage.
The Xs toward the top right of the Impact and Control Matrix are clearly the ones on which Jane and the team should focus in the Improve phase of DMAIC. These Xs have a big impact and can be strongly influenced or controlled by better process design.
5.6.2. Improvement Plan
After his sponsor review meeting with Jane and the team, Bill is delighted. "I told you that I thought we were leaving money on the table in our pricing negotiations. Now, thanks to your fine work, I have the analysis that really convinces me!"
Moreover, Bill is extremely enthusiastic about the visual capabilities of JMP. He admits privately to Jane that he was concerned that he might not be able to convince his colleagues of the need to adopt a Six Sigma approach. His colleagues are not very process-oriented and have little time for what they view as the "statistical complexity of the Six Sigma approach." Bill can see that by using Visual Six Sigma he and Jane are better able to tell a simple but compelling story that shows a clear direction for Polymat's pricing efforts.
Together with Jane, Bill pulls together an improvement plan focusing on four key areas:
Product Category. The analysis has illustrated the power of Jane's product categorization method for Polymat. Because this work used only sample products and customers, Bill agrees to convene workshops to classify all of the significant products in Polymat's portfolio in this way. Bill and Jane also develop a review process to keep this classification current.
Sales Representative Training. The analysis highlighted the relative weakness of sales representatives in the price negotiation process. Sophisticated buyers are much more successful in keeping prices low than are sales representatives in negotiating prices up. This was reinforced by the sales representatives themselves, who requested more training in this area.
Consequently, Bill agrees to focused training sessions to improve negotiation skills. These are to be directly linked to the new product categorization matrix to ensure that sales representatives fully exploit the negotiating strength provided by Polymat's Strategic Critical and Strategic Security products.
New Rules for Supply/Demand Balance Decisions. Recognizing the need to understand the prevailing supply/demand balance before adjusting pricing targets, Bill allocates one of his senior market managers to join Jane's team. His role is to develop a monitoring process using trade association data to track market dynamics by quarter. This process will be designed to take account of fluctuations in demand and also to track imports, exports, and the start-up of new suppliers. Business rules will flag when price increases are likely to be successful, and Polymat's leadership team will trigger the price management process to make an appropriate response.
Price Management Process Redesign. Bill agrees that a total re-engineering of the price management process is needed. Jane and Bill set up a workshop to begin the process redesign, and, during an intensive two-day offsite meeting, the workshop team develops a redesign with the following features:
Step 1. Based on a target-setting worksheet, Polymat sales managers will review each key customer and product combination and agree to the percent price increase target for that particular product at that customer. This replaces the blanket 5 percent increase that has been used up to now. Typically, the targeted increase will be in the range 0–10 percent.
Step 2. Using the worksheet, price negotiations will be tracked at weekly account reviews. The current status will be flagged using red-yellow-green traffic signals, so that sales managers can support the sales representatives' negotiations as needed.
Step 3. At the agreed date of the price increases, the newly mandated price targets will be input into the order entry system for subsequent transactions.
Step 4. Following the price increases, the actual invoiced prices will be downloaded from the order entry system and checked against the new target. Any remaining pricing defects can then be remediated as necessary. A dashboard of summary reports will allow the Polymat business leadership team to track planned versus actual performance.
The leadership team agrees to take a phased approach to implementing the new process design, starting with a six-month pilot in one market segment. Unfortunately, the market seems to be switching from Oversupply to Shortage just as the pilot starts.
5.6.3. Verifying Improvement
About six months later, Jane sits down with Bill and some new data in JMP. Jane's new data table is called PilotPricing.jmp. It consists of data on all of the product and company combinations used in the previous study that had activity during the pilot period. Over the period of the pilot study, only three companies did not purchase the product that they had purchased during the baseline study. Consequently, the data table consists of 237 rows.
Jane immediately selects Analyze > Distribution and assigns % Price Increase to the Y, Columns role. She clicks OK. From the top red triangle, she selects Stack. The resulting report, shown in Exhibit 5.46, indicates that the new pricing management process has delivered a mean price increase of about 5.8 percent. Jane saves this script as Distribution for % Price Increase.
Figure 5.46. Distribution Report for % Price Increase during Pilot Study
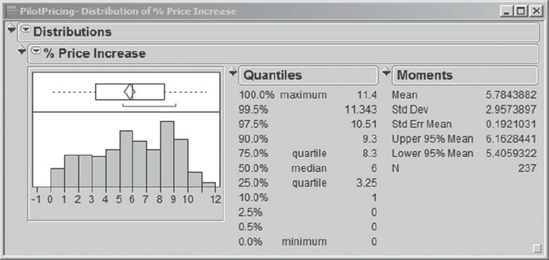
Jane reminds Bill that the 5.8 percent figure should be compared with the baseline data when there was a supply shortage, which showed a mean increase of 4.7 percent. Although an approximate 1 percent gain in % Price Increase does not appear dramatic, Jane works this through to the bottom line and calculates that for the complete Polymat portfolio this is worth in excess of 2 million British pounds per year.
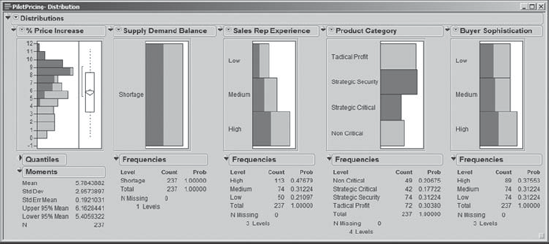
Jane then delves a little more deeply into the data to see the nature of underlying changes. She selects Analyze > Distribution, assigns the column roles as shown in Exhibit 5.47, and clicks OK. She saves the script as Distribution for Five Variables.
Figure 5.47. Distribution Dialog for Five Variables

She explores the data by clicking on bars in the graphs, just as she did when exploring the baseline data. She is intrigued by the following: When she shift-clicks on the Strategic Security and Strategic Critical bars in the Product Category bar chart, she sees that there has been a noticeable impact on % Price Increase (Exhibit 5.48).
Figure 5.48. Distribution Report Showing Product Category Impact
In fact, the mean % Price Increase for these two categories is 8.12 percent! Jane sees this as follows. She selects the two bars of Product Category representing Tactical Profit and Non Critical. Next, she right-clicks in the bar graph and selects Row Exclude. This excludes rows in the data table corresponding to Tactical Profit and Non Critical sales. Finally, Jane clicks on the red triangle next to Distributions and selects Script > Automatic Recalc.
The Distribution analysis automatically updates to show the report for only the unexcluded rows, namely, the Strategic Security and Strategic Critical sales. The Distribution report for % Price Increase shows that the mean for these sales is 8.12 percent. Going back to her baseline data, Jane verifies that the % Price Increase for these two categories during the Shortage period had been only 5.88 percent.
Jane reminds Bill that for these product categories sales representatives have a relatively strong negotiating position due to the small number of alternative options available to the buyer. After the improvements were put in place, the price increase for these products is strongly skewed to markedly higher levels, suggesting much more effective and targeted negotiations during the pilot.
Jane closes her Distribution report and selects Rows > Clear Row States to clear the exclusions from her previous analysis. Now she wants to see the impact of Product Category and Buyer Sophistication on % Price Increase. She selects Analyze > Fit Y By X with % Price Increase as Y, Response and Product Category and Buyer Sophistication as X, Factor. Using the same options that she used earlier, she obtains the report shown in Exhibit 5.49. (The script is Oneway with Comparison Circles.)
Figure 5.49. Oneway Reports for % Price Increase

The comparison circles (and associated tests) show no evidence of a Buyer Sophistication effect on % Price Increase. As expected, though, the Product Category effect is still present. The means for all four categories are given in this report: Strategic Critical and Strategic Security sales average an increase of 7.68 percent and 8.37 percent, respectively, while the other two categories average increases of 4.87 percent and 2.64 percent.
Jane takes the data, these reports, and a summary of her key findings from the pilot to a review meeting with Bill and the Polymat leadership team. Convinced by this study, the leadership team immediately gives the go-ahead to implement the new pricing management process as rapidly as possible across all operations.