
6.8. Utilizing Knowledge
In a formal DMAIC project, the utilization of knowledge begins in the Improve Phase and continues into the Control phase. As part of its Control Phase activities, the team prepares a comprehensive control plan for the anodize process. The plan includes specification of the optimum settings for the five Xs, as well as the new protocol for controlling the variation of these variables. The control plan also specifies the use of statistical process control to monitor the Xs, the four Ys, and the project KPI, process yield. Recall that the project goal was to improve the anodize process yield from 19 percent to a minimum of 90 percent, and to sustain that improvement.
About four months after the new process settings and controls are implemented, Sean and his team collect the associated data, including the final yield numbers. They add the yield values to a data table that contains yields for the initial 60-lot baseline period (BaselineYieldAll.jmp).
The team decides to continue to use an individual measurement chart to monitor process yield. Recall that although the yield measure is truly a proportion defective, Sean had reason to choose an individual measurement chart, rather than a p chart, to monitor this proportion. Sean makes BaselineYieldAll.jmp the active window. He selects Graph > Control Chart > IR and populates the launch dialog as shown in Exhibit 6.79. The column Phase is used to generate control limits for each portion of the data (Before and After). (The script is Control Phase Control Chart.)
Figure 6.79. Launch Dialog for Individual Measurement Chart for Yield

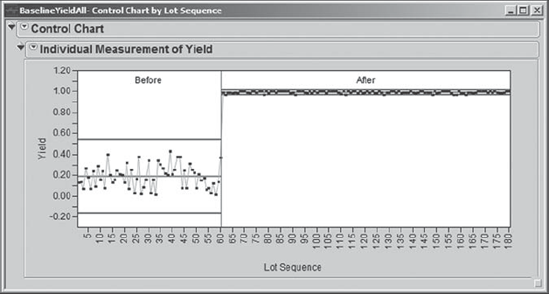
The chart is shown in Exhibit 6.80. The team is delighted! The chart shows that the process is yielding, on average, close to 99 percent. This greatly exceeds the team's goal of improving daily yield to at least 90 percent.
Figure 6.80. Before and After Control Charts for Yield
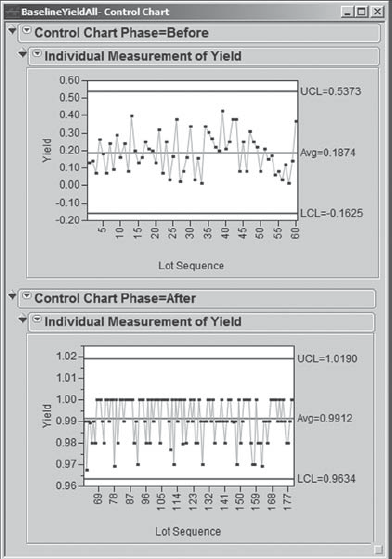
To better see the Control phase detail, Sean reruns the control chart, entering Phase as a By variable rather than as a Phase. Exhibit 6.81 shows the resulting control charts (the script is Control Charts by Phase). The process is consistently yielding at least 96 percent.
Figure 6.81. Before and After Control Charts for Yield, Plotted Separately
At this point, the project is deemed a success. Prior to celebrating and disbanding, the team members transition the process monitoring responsibility to the production manager, who will ensure that the process continues to perform at a high level. Sean and the team also document what they have learned and make recommendations for future improvement projects relating to this process.