CHAPTER FOUR
Data Analytics
The amount of data being collected — and then being made available for data analytics — is growing rapidly. So too is the need to employ effective pipelines that can take all that collected data and transform it into meaningful insights. Building these pipelines in the cloud comes with significant advantages. In addition to virtually unlimited scalability, the cloud offers managed services that eliminate the hassles and risks of managing your own infrastructure and hardware.
A typical data analytics pipeline starts with a data lake — a centralized repository for storing all your structured and unstructured data at scale in its raw form. The pipeline processes the data, cleaning, enriching, and transforming it to make it useful for downstream applications. A data warehouse stores the processed data in a relational format accessible via SQL. Analytics, business intelligence, and data science teams access the data in the data warehouse to create dashboards, machine learning (ML) models for predictions, and more.
This chapter covers the different steps involved in a typical data analytics pipeline, and options available for running them on Google Cloud in a scalable way.
Every application generates data, but what does that data mean? This is a question all data scientists are hired to answer. There is no doubt that this information is the most precious commodity for a business. But making sense of data, creating insights, and turning them into decisions is even more important. As the data keeps growing in volume, the data analytics pipelines have to be scalable to adapt to the rate of change. And for this reason, choosing to set up the pipeline in the cloud makes perfect sense, since the cloud offers on-demand scalability and flexibility.
In this chapter we will demystify how to build a scalable and adaptable data processing pipeline in Google Cloud. Let's start here by discussing the general concepts of a data pipeline that are applicable in any cloud or on-premise data pipeline.
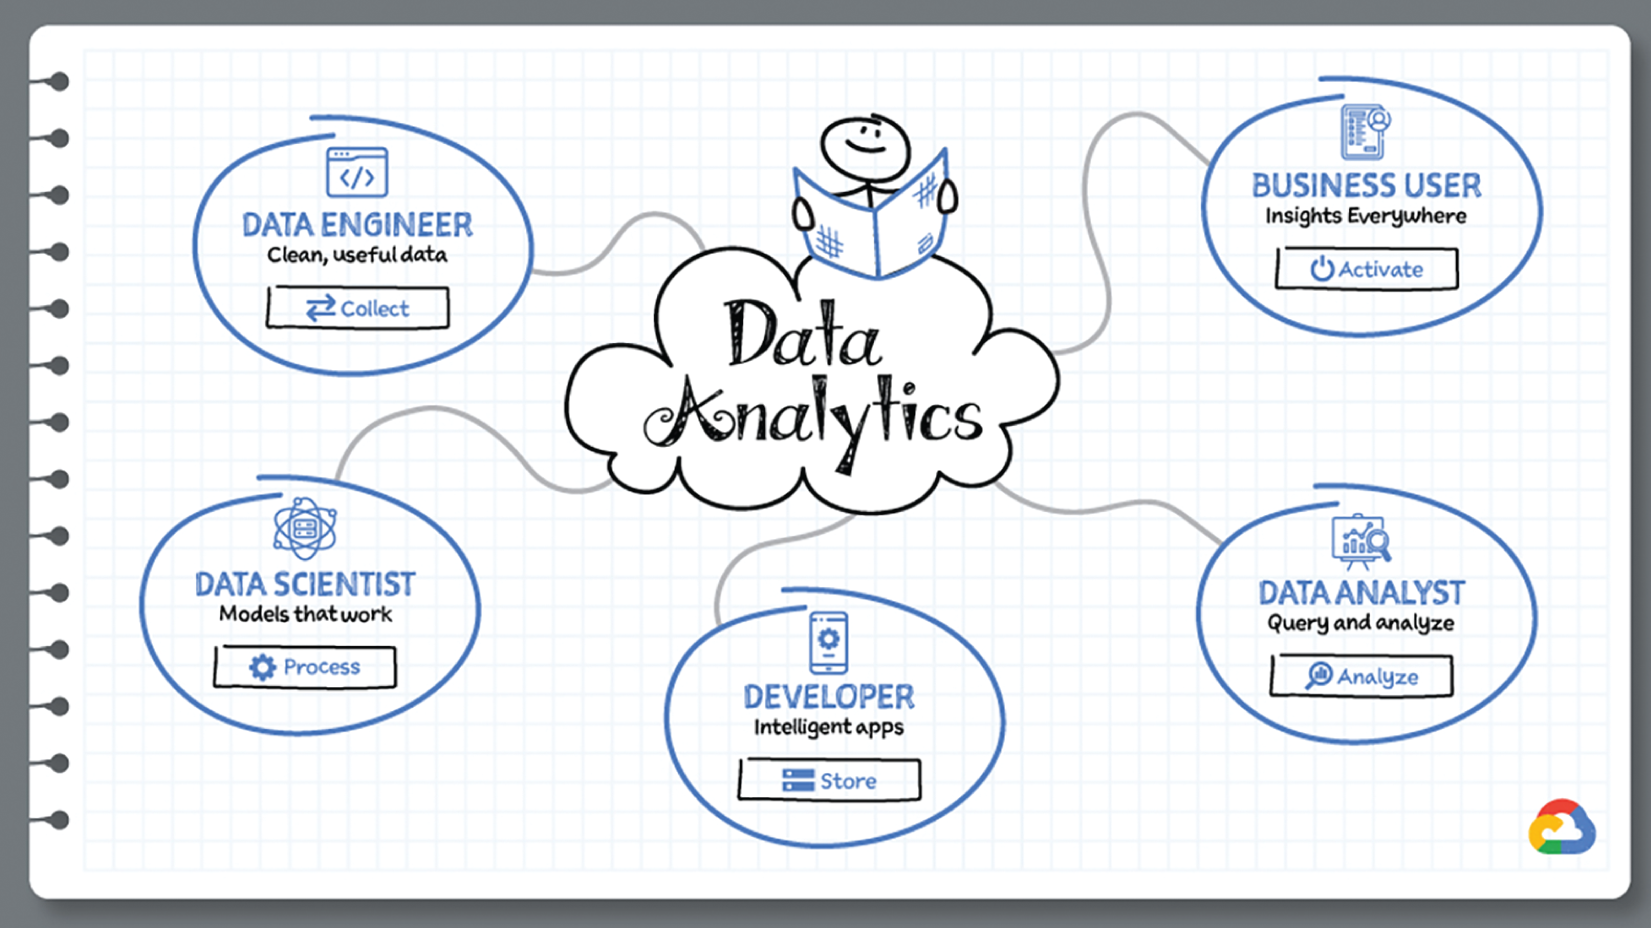
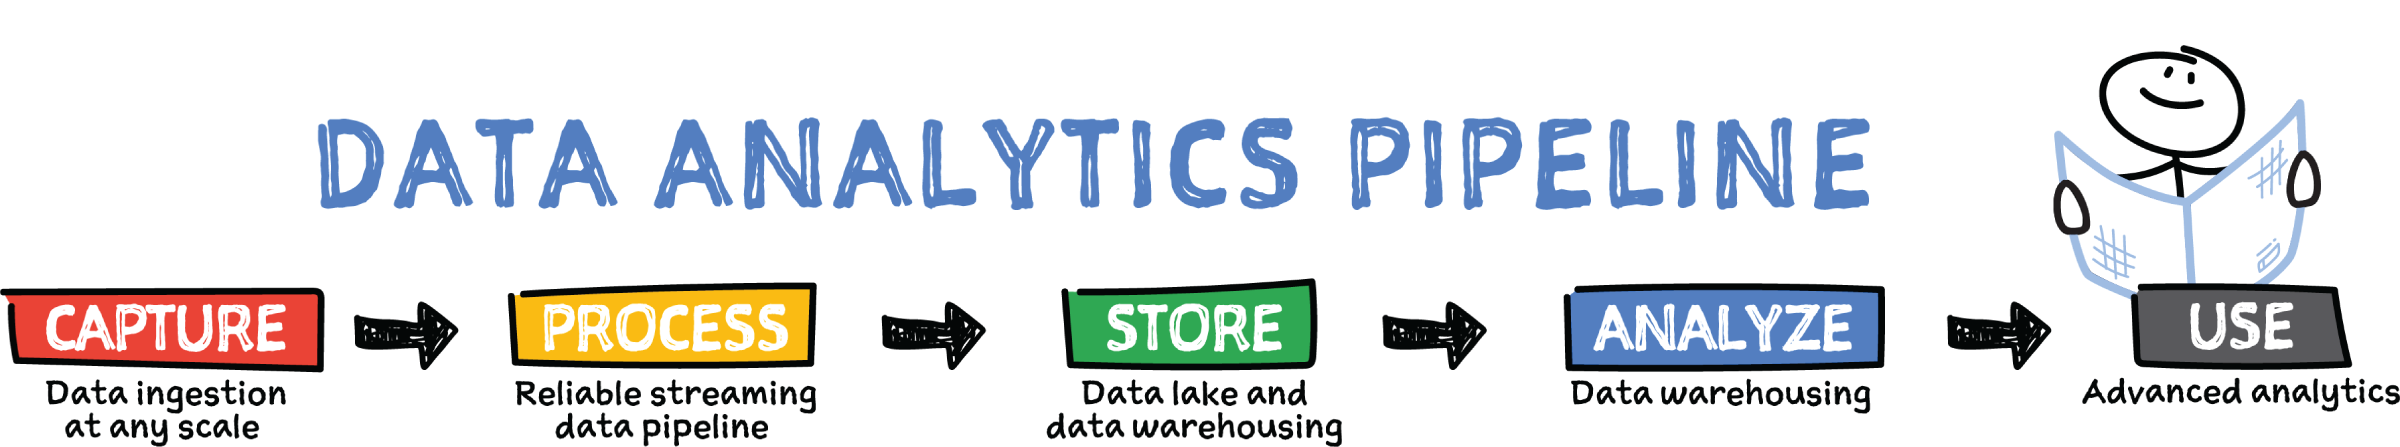
5 Steps to Create a Data Analytics Pipeline
- Capture: First you ingest the data from various data sources. These sources could be either batch or real-time data.
- Batch data is the data that is stored at a regular period of time and further processed in bulk.
- Real-time data is generated from websites such as clickstream data or IoT devices sending streams of data for processing.
- Process: Once the data is ingested, it is processed and enriched so that the downstream system can utilize them in the format it understands best. Business logic is applied on the data in the processing stage, and then the data is dropped into a sink, which is a storage device for the enriched and processed data. For example: Your business logic requires the input data to be maked and tokenized for security reasons and then dumps the tokenized data into a storage device.
- Store: After the data is processing, it needs to be stored so that it can enable analytics projects. There are two types of storage options you can use at this stage of the pipeline:
- Data warehouse is a repository for structured, filtered data that has already been processed for a specific purpose. For example: specific reporting, analysis, data marts, machine learning.
- Data lake is a vast pool of raw data, the purpose for which is either interim or not yet defined. A data lake is a centralized repository designed to securely store large amounts of structured, semi-structured, and unstructured data. It can store data in its native format and process any variety of it, ignoring size limits.
- Analyze: Data stored in a data warehouse can then be used by the downstream systems for analysis. This is the stage where data analysts and data scientists can run queries on the data to explore it for their purposes.
- Use: Once the data is in a data warehouse, it can be used by multiple different internal customers such as data analysts and data scientists. Analysts can analyze the data, and the data scientists can pull the same data into a Jupyter Notebook or train a machine learning model with it. They could create data marts, dashboards, and reports for business purposes or integrate it with external data and reporting systems.
A few factors apply across all these stages of the data analytics pipeline:
- Data integration — Data is always in multiple different places; at any stage you might need a data integration service that brings data from other systems in one place such as a data lake.
- Metadata management — Data scientists and data analysts need to be able to quickly discover, understand, and manage all your data in one place. This is where having a metadata management system enables you to democratize data and insights for both technical and business users.
- Workflow orchestration — Data pipelines are not run just once; most pipelines have to be scheduled and run over a period of time and tasks need to be defined. Across these tasks a workflow orchestration tool is needed to easily author, schedule, and monitor pipelines.
Extract, Transform, and Load (ETL)
You might have come across the term ETL (extract, transform, and load) in the context of data pipelines. ETL is essentially a data processing pipeline that works on a batch of data. Data pipelines don't necessarily have to end in loading data to a storage or analytics system; they can be used to trigger a business process via a webhook.
So, you've said goodbye to the monolithic application and refactored it into services. You are shipping faster and the code is cleaner. But the complexity of communication between the services is causing performance issues. And every time a new team needs to integrate, it's a whole lot of meetings. The time has come to consider asynchronous communication, where services publish and listen for events that flow through a messaging system. The services are decoupled and you can keep scaling. That is where Pub/Sub comes in — a set of fully managed messaging services. You can use Pub/Sub as messaging-oriented middleware or event ingestion and delivery for streaming analytics pipelines. Pub/Sub comes in two flavors:
- It provides messaging and event ingestion for real-time analytics.
- It is serverless, it autoscales, and it auto-provisions as needed.
- It provides the ability to publish and subscribe to events regardless of geography.
- You can create up to 10,000 subscriber apps per topic; it provides independent capacity and billing for publishers and subscribers.
- It supports the push delivery model and is especially useful for communication between microservices
- Optimizes for cost over reliability
- Is up to 90% cheaper than Pub/Sub
- Requires you to manage your capacity and offers less available storage than Pub/Sub
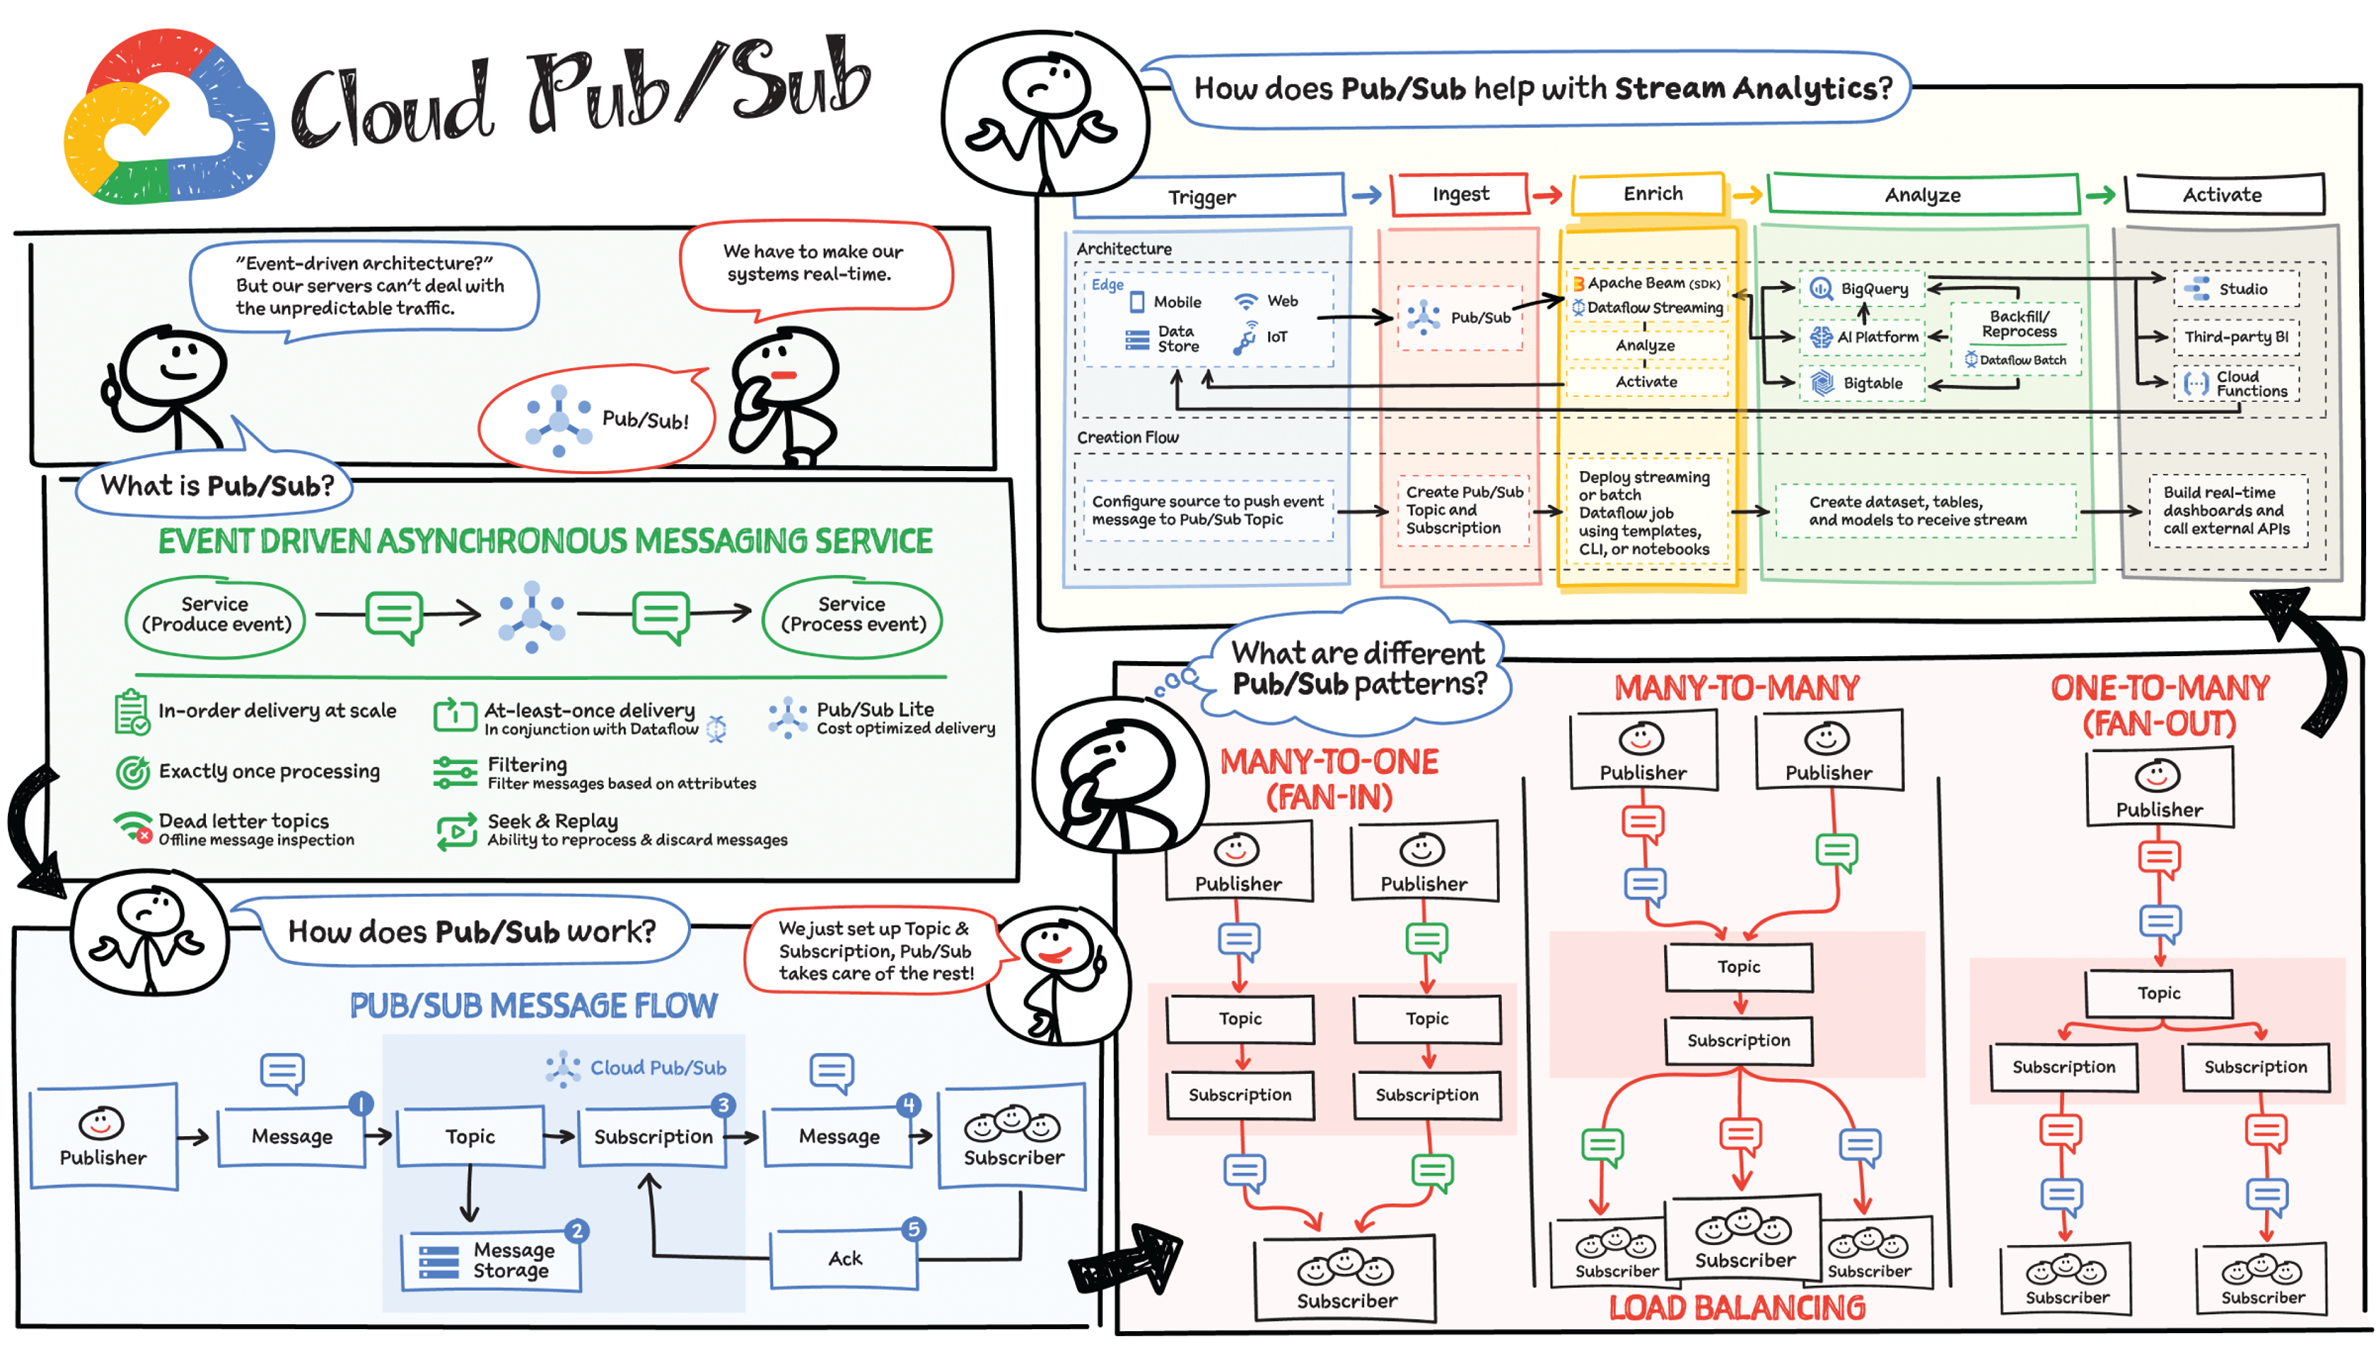
How Does Pub/Sub Work?
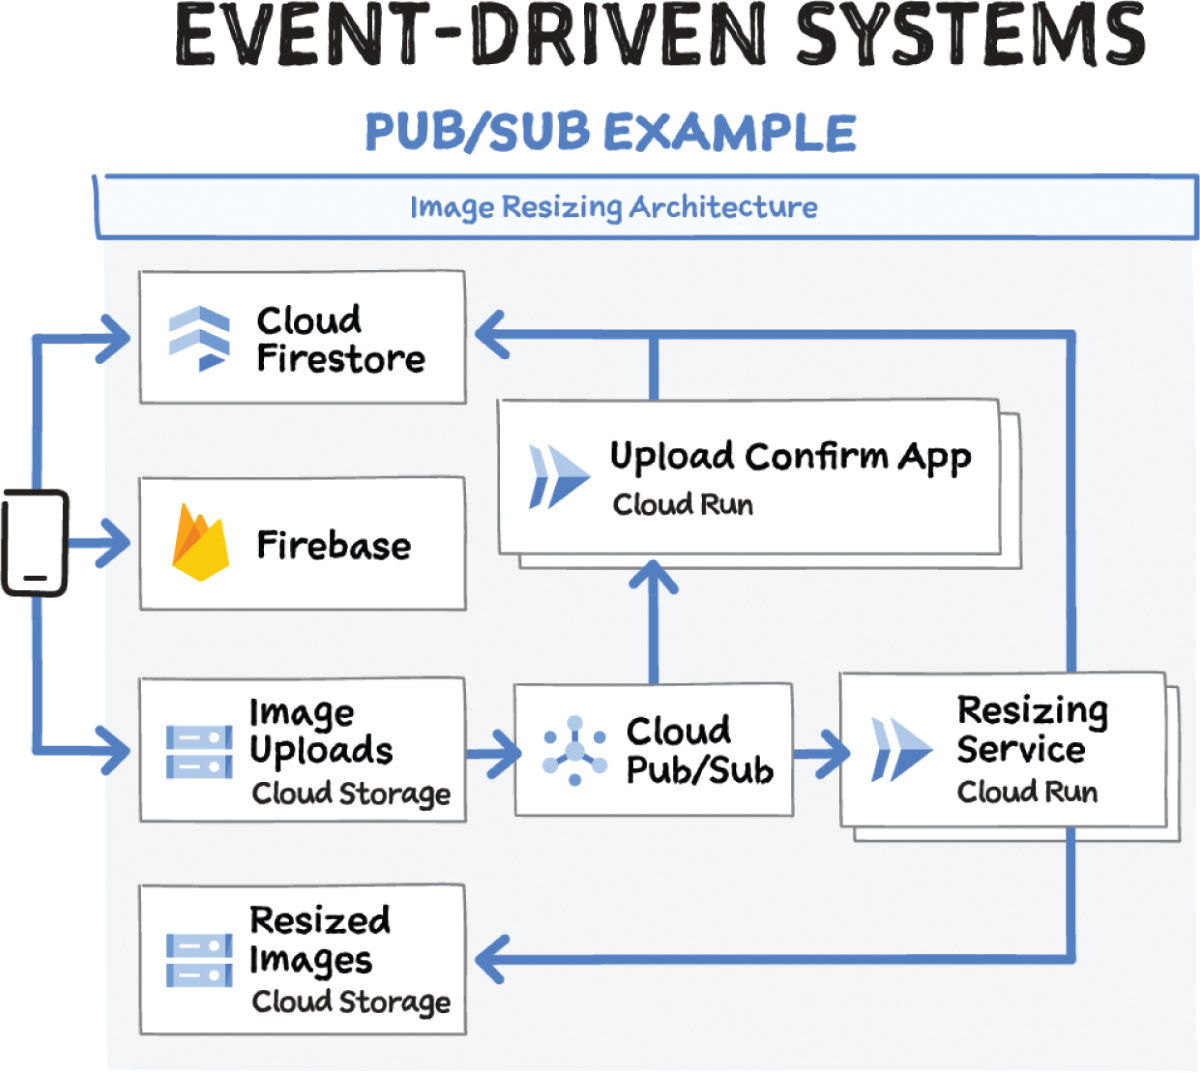
A publisher application creates and sends messages to a topic. Subscriber applications create a subscription to a topic to receive messages from it. Communication can be one-to-many (fan-out), many-to-one (fan-in), and many-to-many.
- A publisher application creates a topic in the Pub/Sub service and sends messages to the topic. A message contains a payload and optional attributes that describe the payload content.
- The service ensures that published messages are retained on behalf of subscriptions. A published message is retained for a subscription until it is acknowledged by any subscriber consuming messages from that subscription.
- Pub/Sub forwards messages from a topic to all of its subscriptions individually.
- A subscriber receives messages either by Pub/Sub pushing them to the subscriber's chosen endpoint, or by the subscriber pulling them from the service.
- The subscriber sends an acknowledgment to the Pub/Sub service for each received message.
- The service removes acknowledged messages from the subscription's message queue.
Pub/Sub Features
- Global routing: You can publish messages to a topic anywhere in the world. It is persisted locally for low latency. On the other end, subscribers, deployed in any region, receive messages from all publish locations without doing anything special.
- Partition-less in-order delivery: If messages have the same ordering key and are in the same region, you can enable message ordering and receive the messages in the order that the Pub/Sub service receives them.
- Dead letter topics: If the Pub/Sub service attempts to deliver a message but the subscriber can't acknowledge it, Pub/Sub can forward the undeliverable message to a dead-letter topic to attempt delivery at a later time.
- Seek and replay: There could be times when you need to alter the acknowledgment stage of messages in bulk; the seek and replay feature allows you to do that.
- Filtering: You can filter messages by message attributes, and when you receive messages from a subscription with a filter, you only receive the messages that match the filter. Pub/Sub automatically acknowledges the messages that don't match the filter.
Pub/Sub Use Cases
- Asynchronous service integration: Pub/Sub works as a messaging middleware for traditional service integration or a simple communication medium for modern microservices. Push subscriptions deliver events to serverless webhooks on Cloud Functions, App Engine, Cloud Run, or custom environments on Google Kubernetes Engine or Compute Engine. Low-latency pull delivery is available when exposing webhooks is not an option or for efficient handling of higher throughput streams.
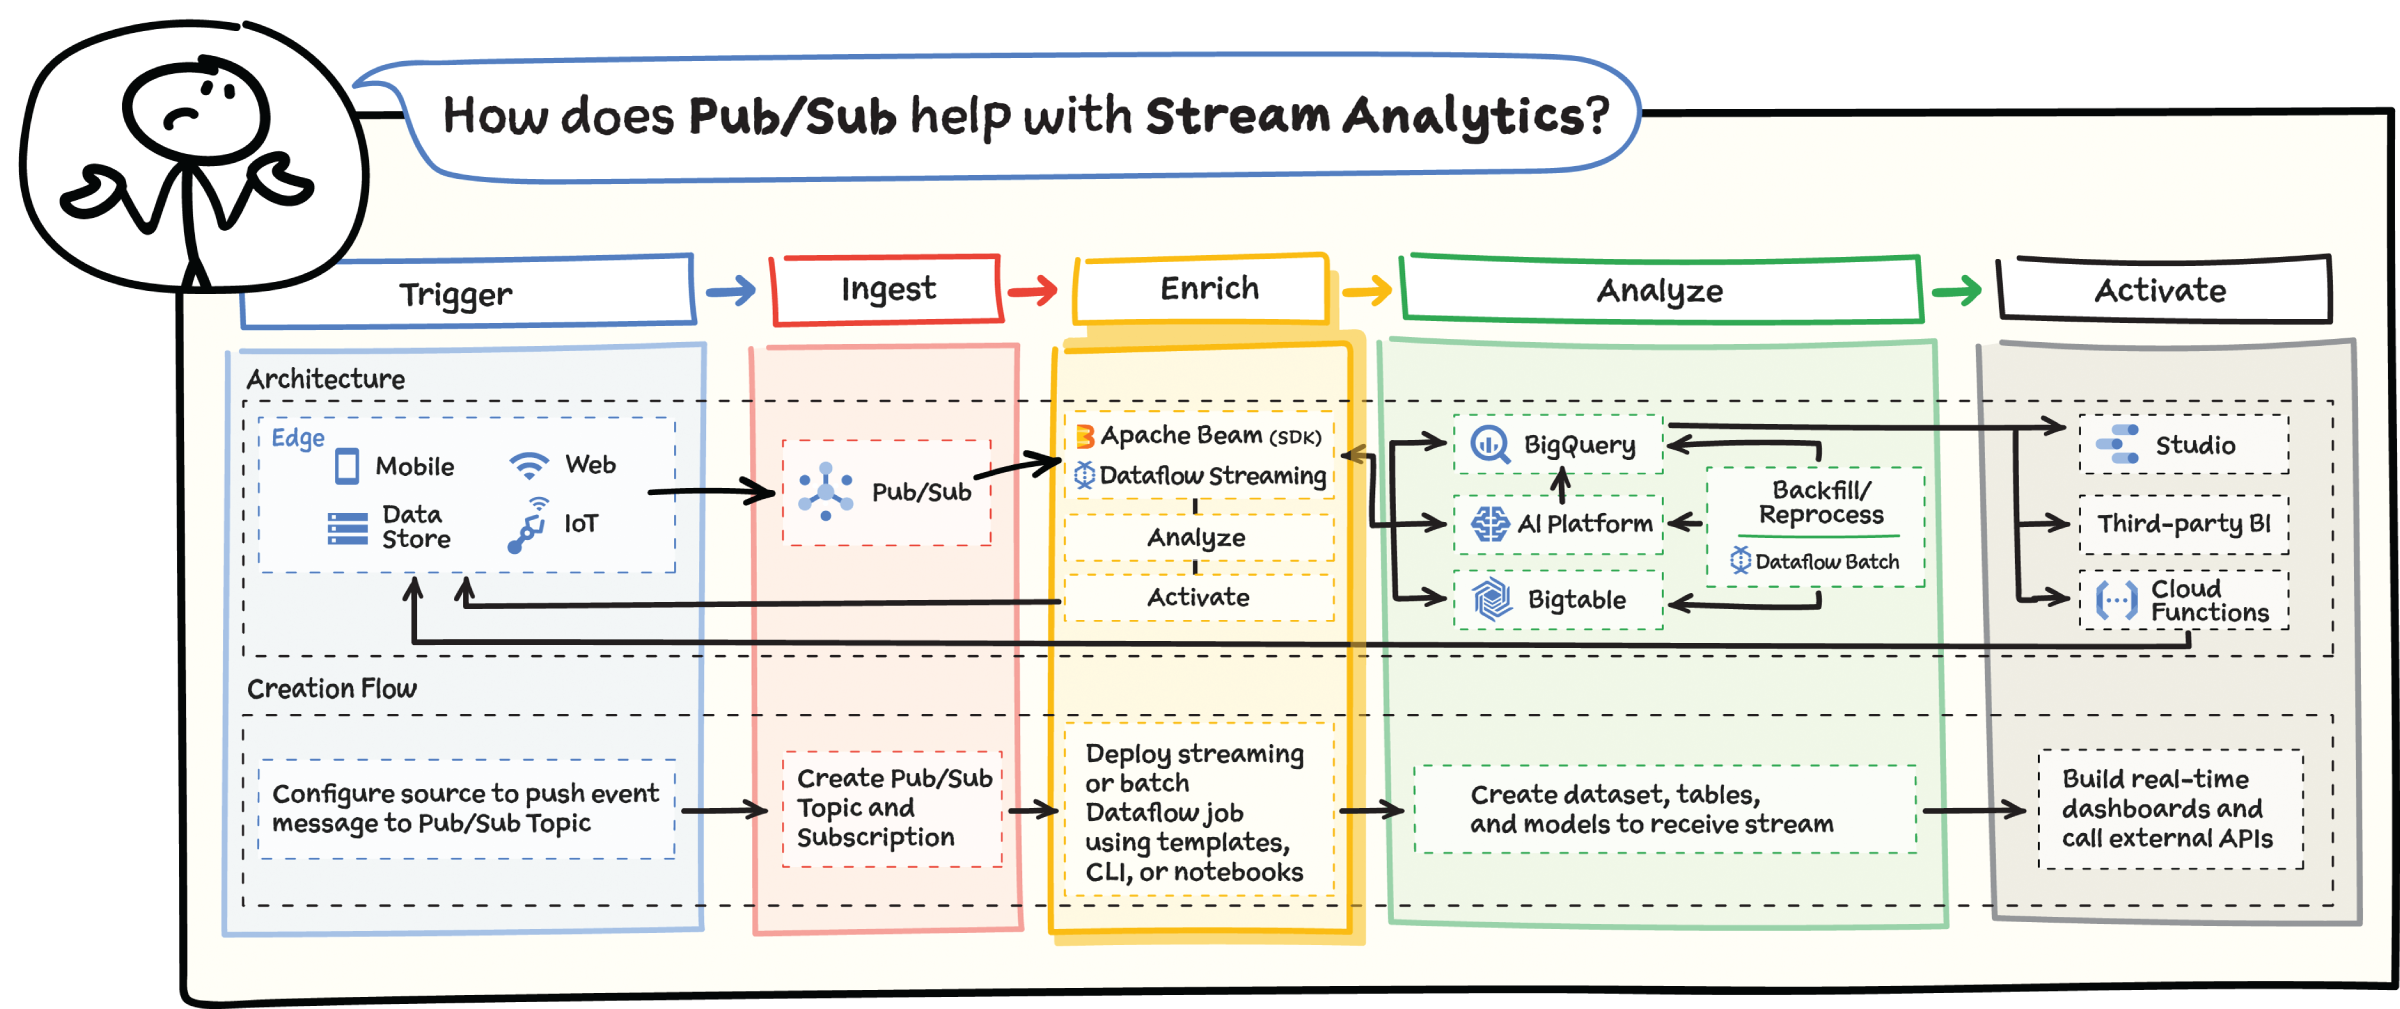
- Stream analytics: Data ingestion is the foundation for analytics and machine learning, whether you are building stream, batch, or unified pipelines. Cloud Pub/Sub provides a simple and reliable staging location for your event data on its journey to processing, storage, and analysis. Use Cloud Dataflow with Cloud Pub/Sub to enrich, deduplicate, order, aggregate, and land events. Mix real-time and batch processing via Cloud Pub/Sub's durable storage.
The ability to gain real-time insights from IoT data can redefine competitiveness for businesses. Intelligence allows connected devices and assets to interact efficiently with applications and with human beings in an intuitive and nondisruptive way. After your IoT project is up and running, many devices will be producing lots of data. You need an efficient, scalable, affordable way to both manage those devices and handle all that information.
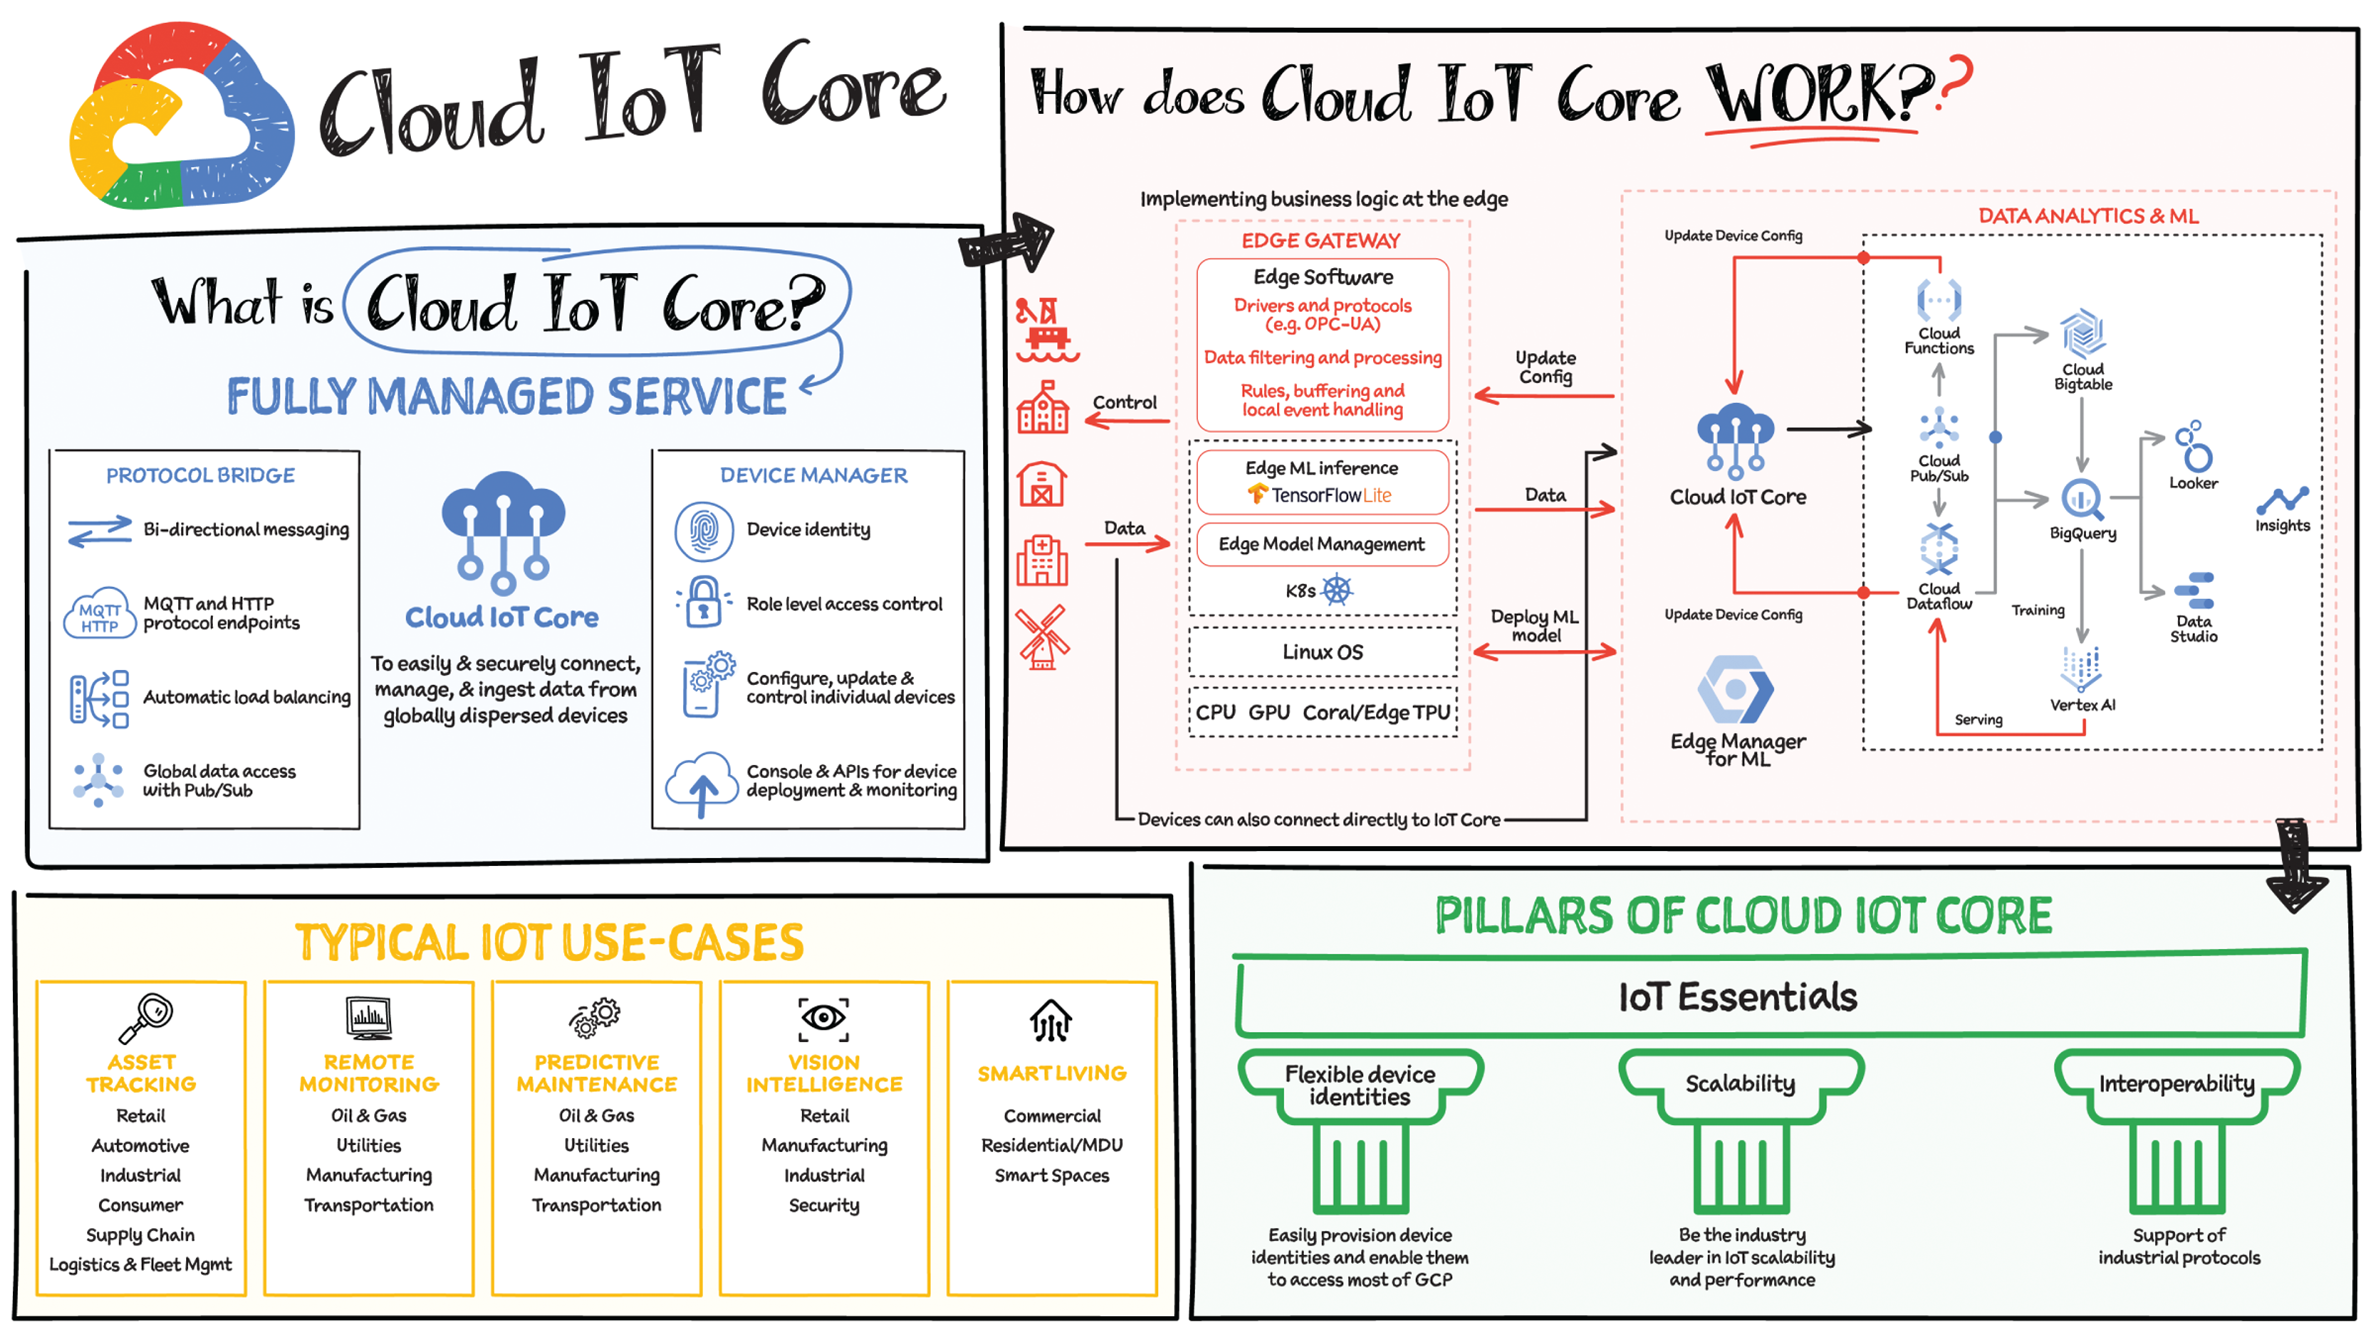
IoT Core is a fully managed service for managing IoT devices. It supports registration, authentication, and authorization inside the Google Cloud resource hierarchy as well as device metadata stored in the cloud, and offers the ability to send device configuration from other GCP or third-party services to devices.
Main Components
The main components of Cloud IoT Core are the device manager and the protocol bridges:
- The device manager registers devices with the service, so you can then monitor and configure them. It provides:
- Device identity management
- Support for configuring, updating, and controlling individual devices
- Role-level access control
- Console and APIs for device deployment and monitoring
- Two protocol bridges (MQTT and HTTP) can be used by devices to connect to Google Cloud Platform for:
- Bi-directional messaging
- Automatic load balancing
- Global data access with Pub/Sub
How Does Cloud IoT Core Work?
Device telemetry data is forwarded to a Cloud Pub/Sub topic, which can then be used to trigger Cloud Functions as well as other third-party apps to consume the data. You can also perform streaming analysis with Dataflow or custom analysis with your own subscribers.
Cloud IoT Core supports direct device connections as well as gateway-based architectures. In both cases the real-time state of the device and the operational data is ingested into Cloud IoT Core and the key and certificates at the edge are also managed by Cloud IoT Core. From Pub/Sub the raw input is fed into Dataflow for transformation, and the cleaned output is populated in Cloud Bigtable for real-time monitoring or BigQuery for warehousing and machine learning. From BigQuery the data can be used for visualization in Looker or Data Studio, and it can be used in Vertex AI for creating machine learning models. The models created can be deployed at the edge using Edge Manager (in experimental phase). Device configuration updates or device commands can be triggered by Cloud Functions or Dataflow to Cloud IoT Core, which then updates the device.
Design Principles of Cloud IoT Core
As a managed service to securely connect, manage, and ingest data from global device fleets, Cloud IoT Core is designed to be:
- Flexible, providing easy provisioning of device identities and enabling devices to access most of Google Cloud
- The industry leader in IoT scalability and performance
- Interoperable, with supports for the most common industry-standard IoT protocols
Use Cases
IoT use cases range across numerous industries. Here are some typical examples:
- Asset tracking, visual inspection, and quality control in retail, automotive, industrial, supply chain, and logistics
- Remote monitoring and predictive maintenance in oil and gas, utilities, manufacturing, and transportation
- Connected homes and consumer technologies
- Vision intelligence in retail, security, manufacturing, and industrial sectors
- Smart living in commercial, residential, and smart spaces
- Smart factories with predictive maintenance and real-time plant floor analytics
Data is generated in real-time from websites, mobile apps, IoT devices, and other workloads. Capturing, processing, and analyzing this data is a priority for all businesses. But data from these systems is not often in the format that is conducive for analysis or for effective use by downstream systems. That's where Dataflow comes in. Dataflow is used for processing and enriching batch or stream data for use cases such as analysis, machine learning, or data warehousing.
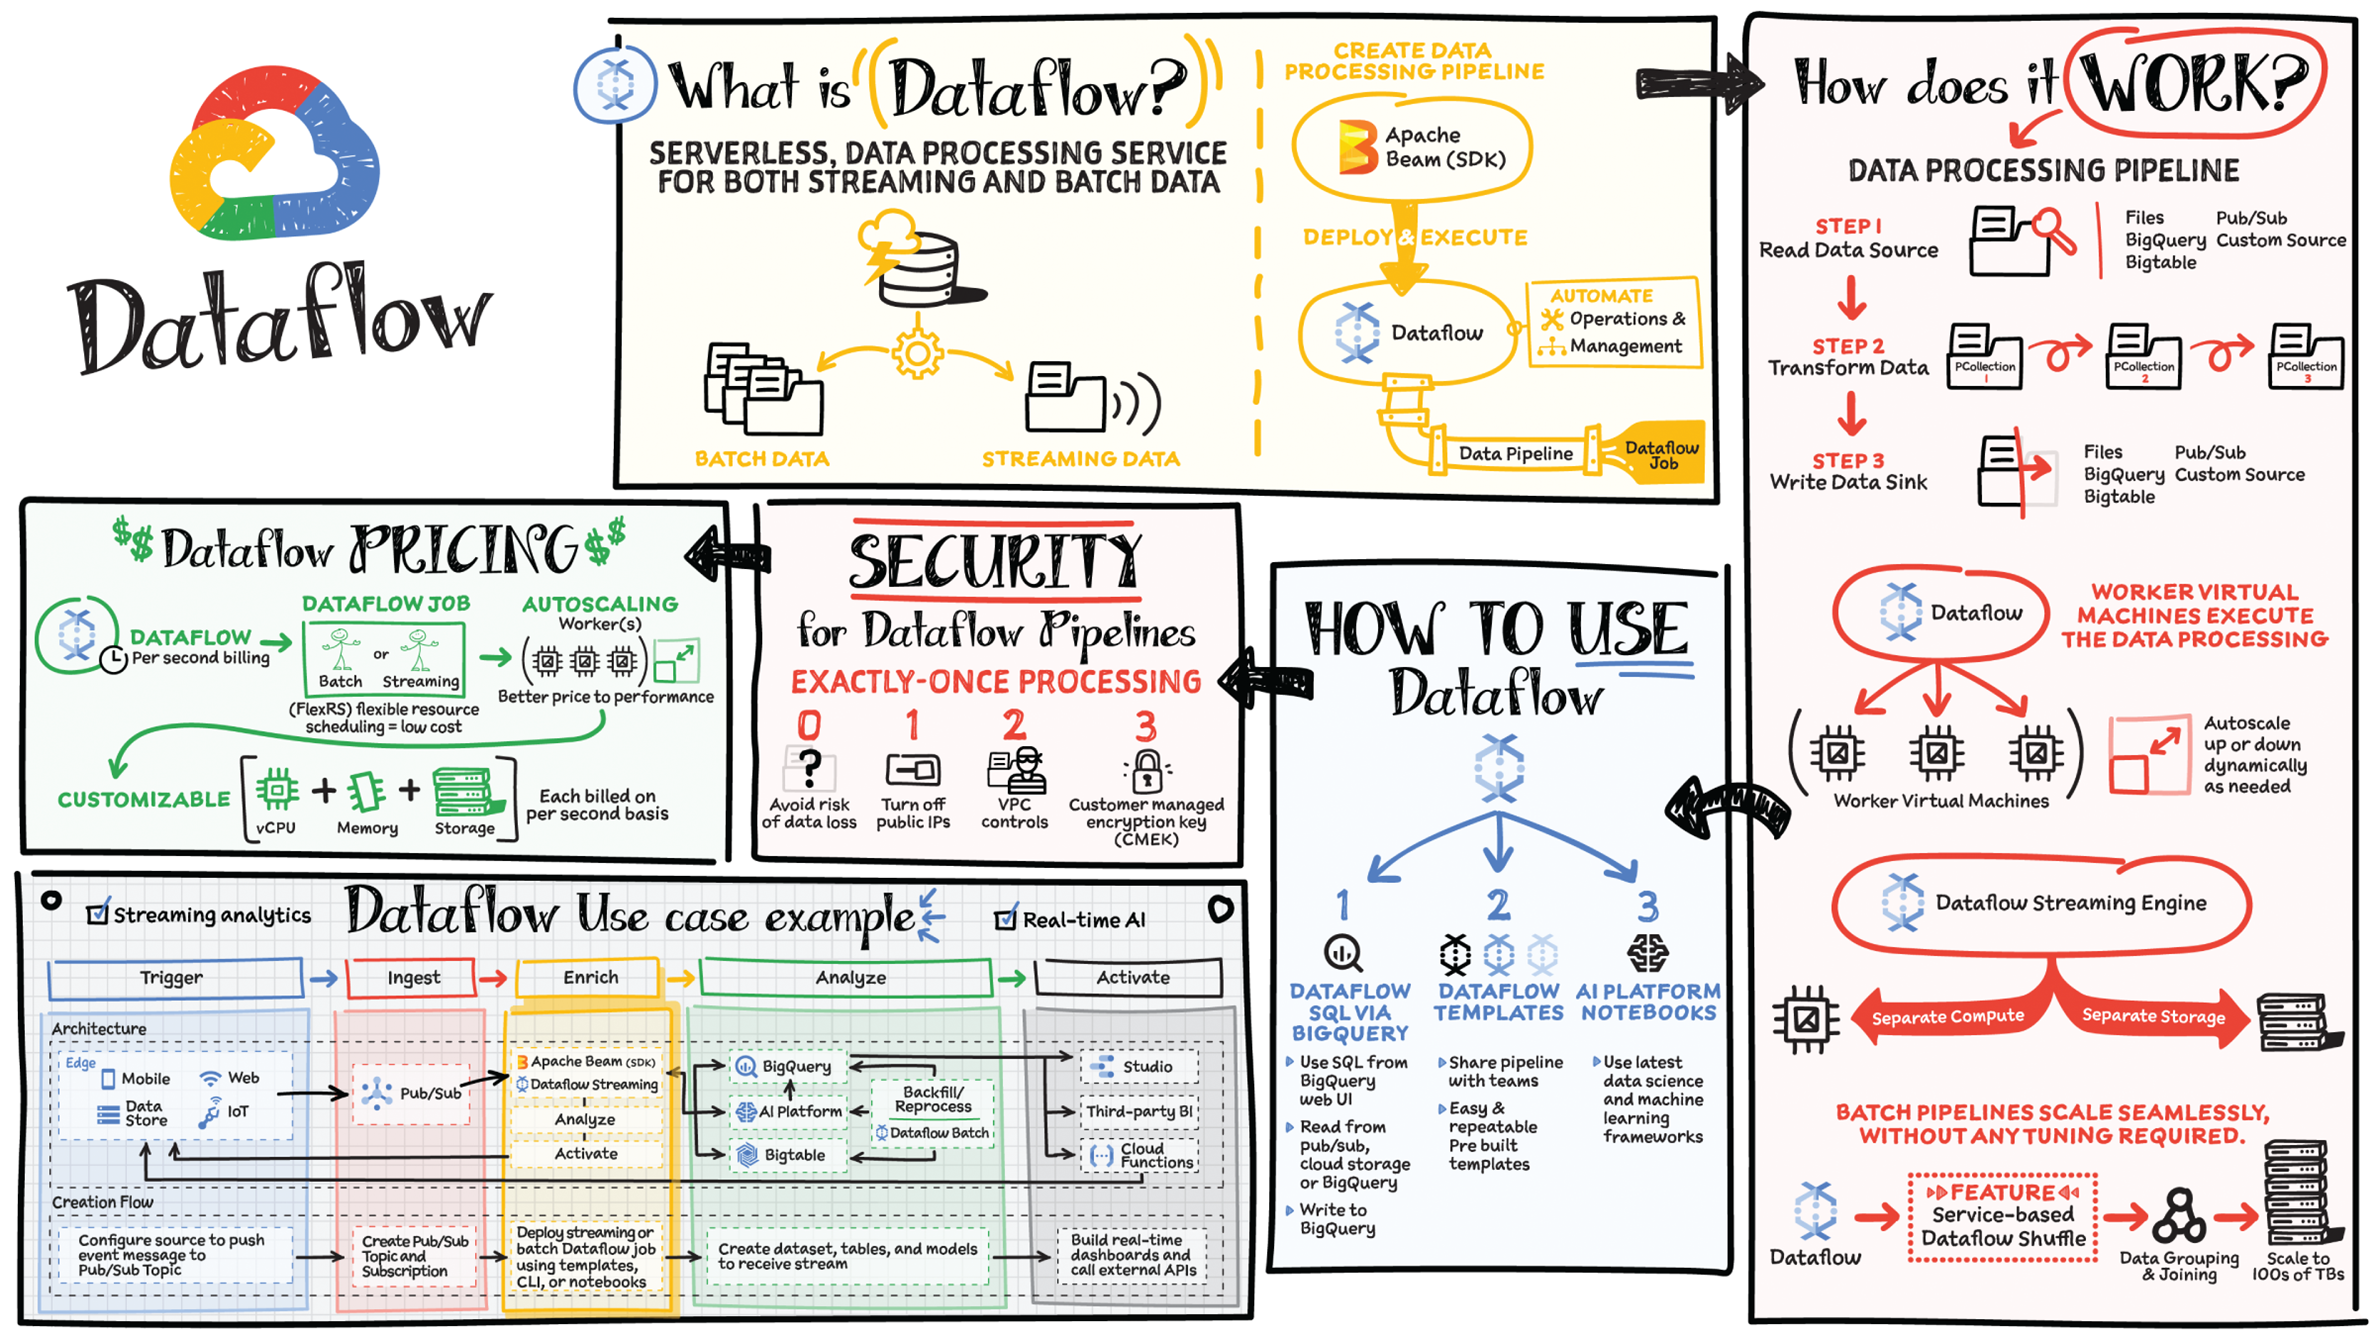
Dataflow is a serverless, fast, and cost-effective service that supports both stream and batch processing. It provides portability with processing jobs written using the open source Apache Beam libraries and removes operational overhead from your data engineering teams by automating the infrastructure provisioning and cluster management.
How Does Data Processing Work?
In general a data processing pipeline involves three steps: you read the data from a source, transform it, and write the data back into a sink.
- The data is read from the source into a PCollection. The P stands for “parallel” because a PCollection is designed to be distributed across multiple machines.
- Then it performs one or more operations on the PCollection, which are called transforms. Each time it runs a transform, a new PCollection is created. That's because PCollections are immutable.
- After all of the transforms are executed, the pipeline writes the final PCollection to an external sink.
Once you have created your pipeline using Apache Beam SDK in the language of your choice, Java or Python, you can use Dataflow to deploy and execute that pipeline, which is called a Dataflow job. Dataflow then assigns the worker virtual machines to execute the data processing; you can customize the shape and size of these machines. And, if your traffic pattern is spiky, Dataflow autoscaling automatically increases or decreases the number of worker instances required to run your job. Dataflow streaming engine separates compute from storage and moves parts of pipeline execution out of the worker VMs and into the Dataflow service backend. This improves autoscaling and data latency.
How to Use Dataflow
You can create Dataflow jobs using the cloud console UI, gcloud CLI, or the API. There are multiple options to create a job.
- Dataflow templates offer a collection of prebuilt templates with an option to create your own custom ones. You can then easily share them with others in your organization.
- Dataflow SQL lets you use your SQL skills to develop streaming pipelines right from the BigQuery web UI. You can join streaming data from Pub/Sub with files in Cloud Storage or tables in BigQuery, write results into BigQuery, and build real-time dashboards for visualization.
- Using Vertex AI notebooks from the Dataflow interface, you can build and deploy data pipelines using the latest data science and machine learning frameworks.
Dataflow inline monitoring lets you directly access job metrics to help with troubleshooting pipelines at both the step and the worker levels.
Dataflow Governance
When using Dataflow, all the data is encrypted at rest and in transit. To further secure data processing environment you can:
- Turn off public IPs to restrict access to internal systems.
- Leverage VPC Service Controls that help mitigate the risk of data exfiltration.
- Use your own custom encryption keys, or customer-managed encryption keys (CMEKs).
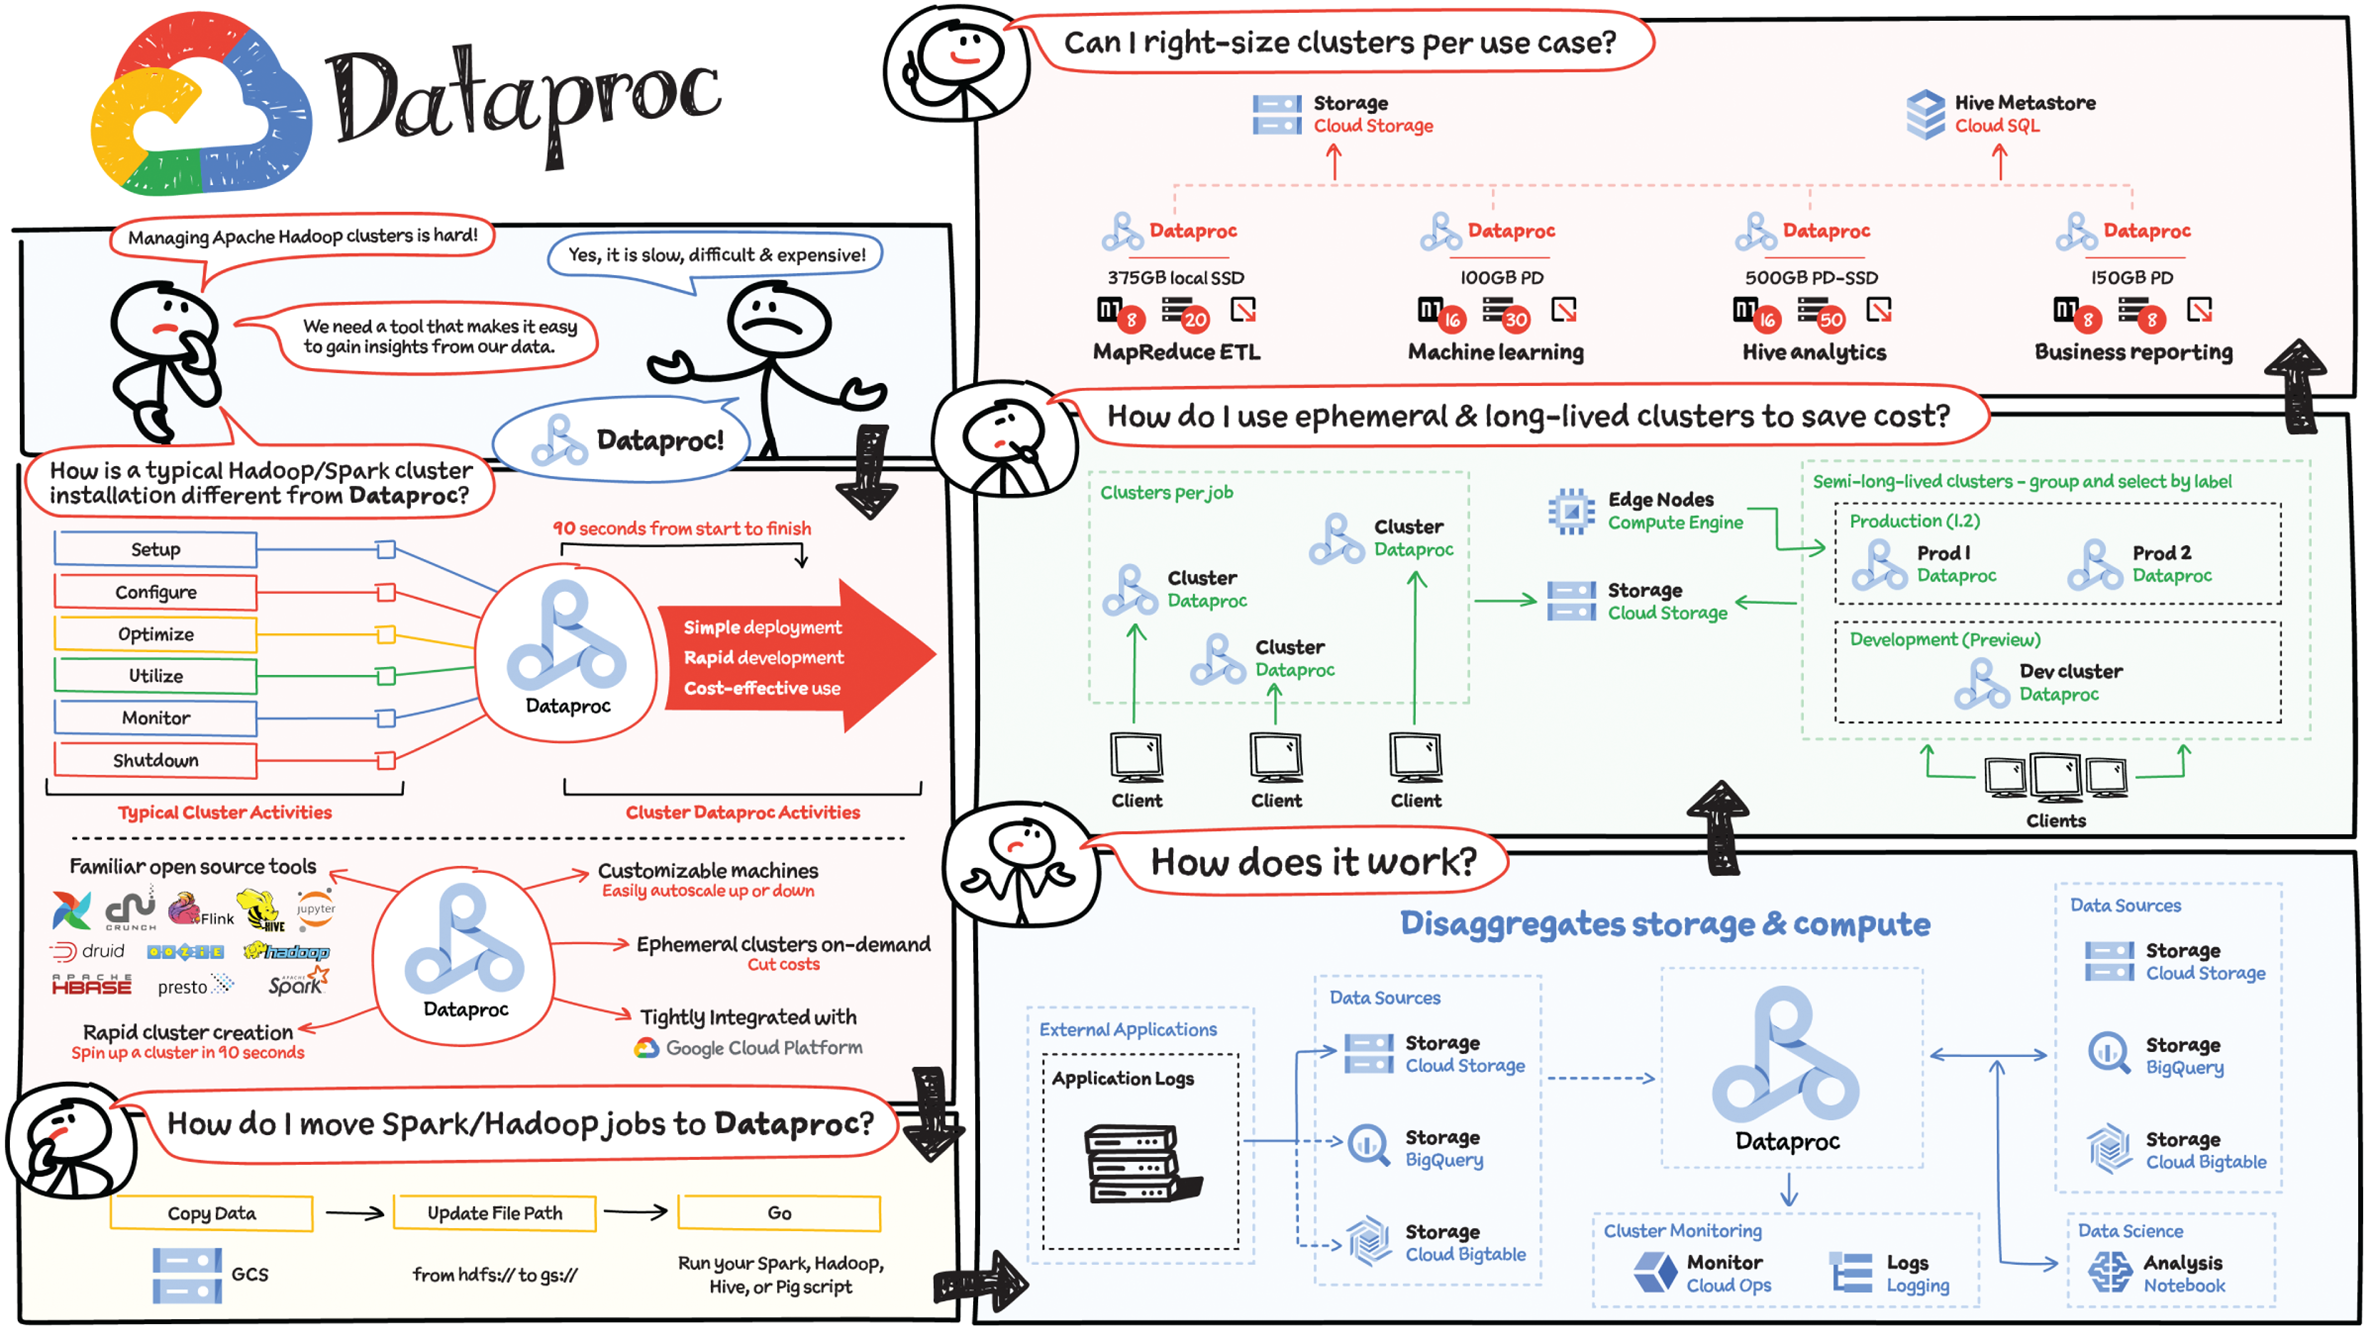
If you are analyzing your data in the on-premise Hadoop and Spark ecosystem, then you know that is costly and time consuming and requires a lot of manual management. That's where Dataproc comes in. It is a fully managed Apache Spark and Apache Hadoop service.
Dataproc Features
- Dataproc clusters take 90 seconds or less, on average, to start, scale, and shut down, making it simple, fast, and cost effective to gain insights as compared to traditional cluster management activities.
Dataproc is much more cost effective than an on-premise data lake because it takes away the cluster creation and management responsibilities so teams can focus more on using the data instead of worrying about infrastructure.
- Dataproc clusters can include on-demand ephemeral preemptible instances that have lower compute prices, saving you money.
- It supports the familiar open source tools and data analytics ecosystem — Hadoop, Spark, Hive, Presto, and Flink.
- It is tightly integrated with the Google Cloud services, including BigQuery, Bigtable, and Cloud Storage.
- When you create a Dataproc cluster, you can enable Hadoop Secure Mode via Kerberos to provide multi-tenancy via user authentication, isolation, and encryption inside a Dataproc cluster.
- You don't need to learn new tools or APIs to use Dataproc, making it easy to move existing projects into Dataproc without redevelopment. And you can interact with your data using Notebooks, Looker, or any BI tools.
- Dataproc enables data science users through integrations with Vertex AI, BigQuery, and Dataplex
- To move an existing Hadoop/Spark jobs, all you do is copy your data into Cloud Storage, update your file paths from Hadoop File system (HDFS) to Cloud Storage, and you are ready!
How Does Dataproc Work?
Dataproc disaggregates storage and compute, which helps manage your costs and be more flexible in scaling your workloads. Assume a use case where an external application is sending logs for analysis. You store them in a data store such as Cloud Storage, BigQuery, or Bigtable. From there the data is consumed by Dataproc for processing, which then stores it back into Cloud Storage, BigQuery (BQ), or Bigtable (BT). You could also use the data for analysis in a notebook and send logs to Cloud Monitoring. Since storage is separate, for a long-lived cluster you could have one cluster per job, but to save costs you could use ephemeral clusters that are grouped and selected by labels. You could also use the right amount of memory, CPU, and disk space to fit the needs of your application.
Migrating HDFS Data from On-Premises to Google Cloud
Plan to migrate data incrementally so you can leave time to migrate jobs, experiment, and test after moving each body of data.
There are two different migration models you should consider for transferring HDFS data to the cloud: push and pull. The push model is the simplest where the source cluster on-premises runs the distcp jobs on its data nodes and pushes files directly to Cloud Storage. The pull model is more complex, but has some advantages. An ephemeral Dataproc cluster runs the distcp jobs on its data nodes, pulls files from the source cluster on-premises, and copies them to Cloud Storage.
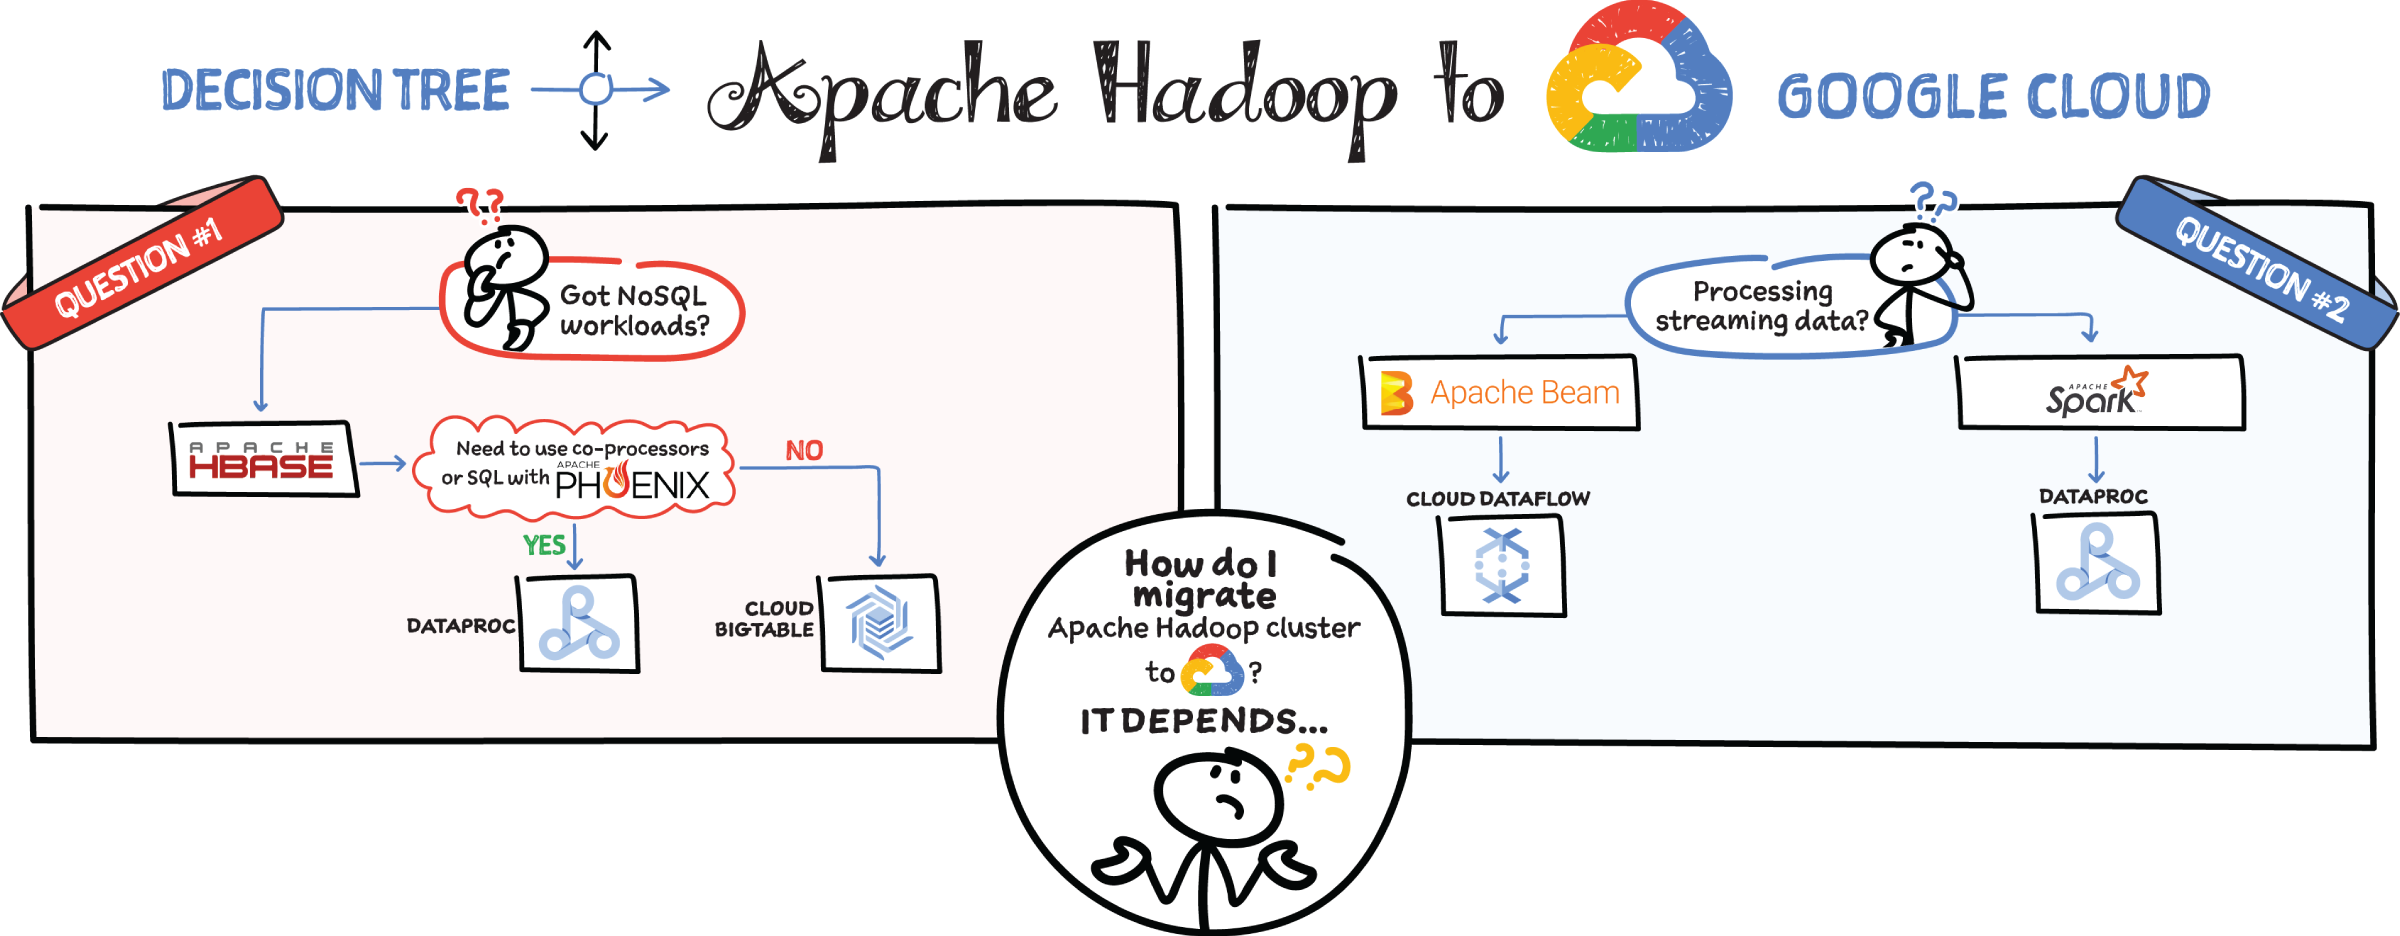
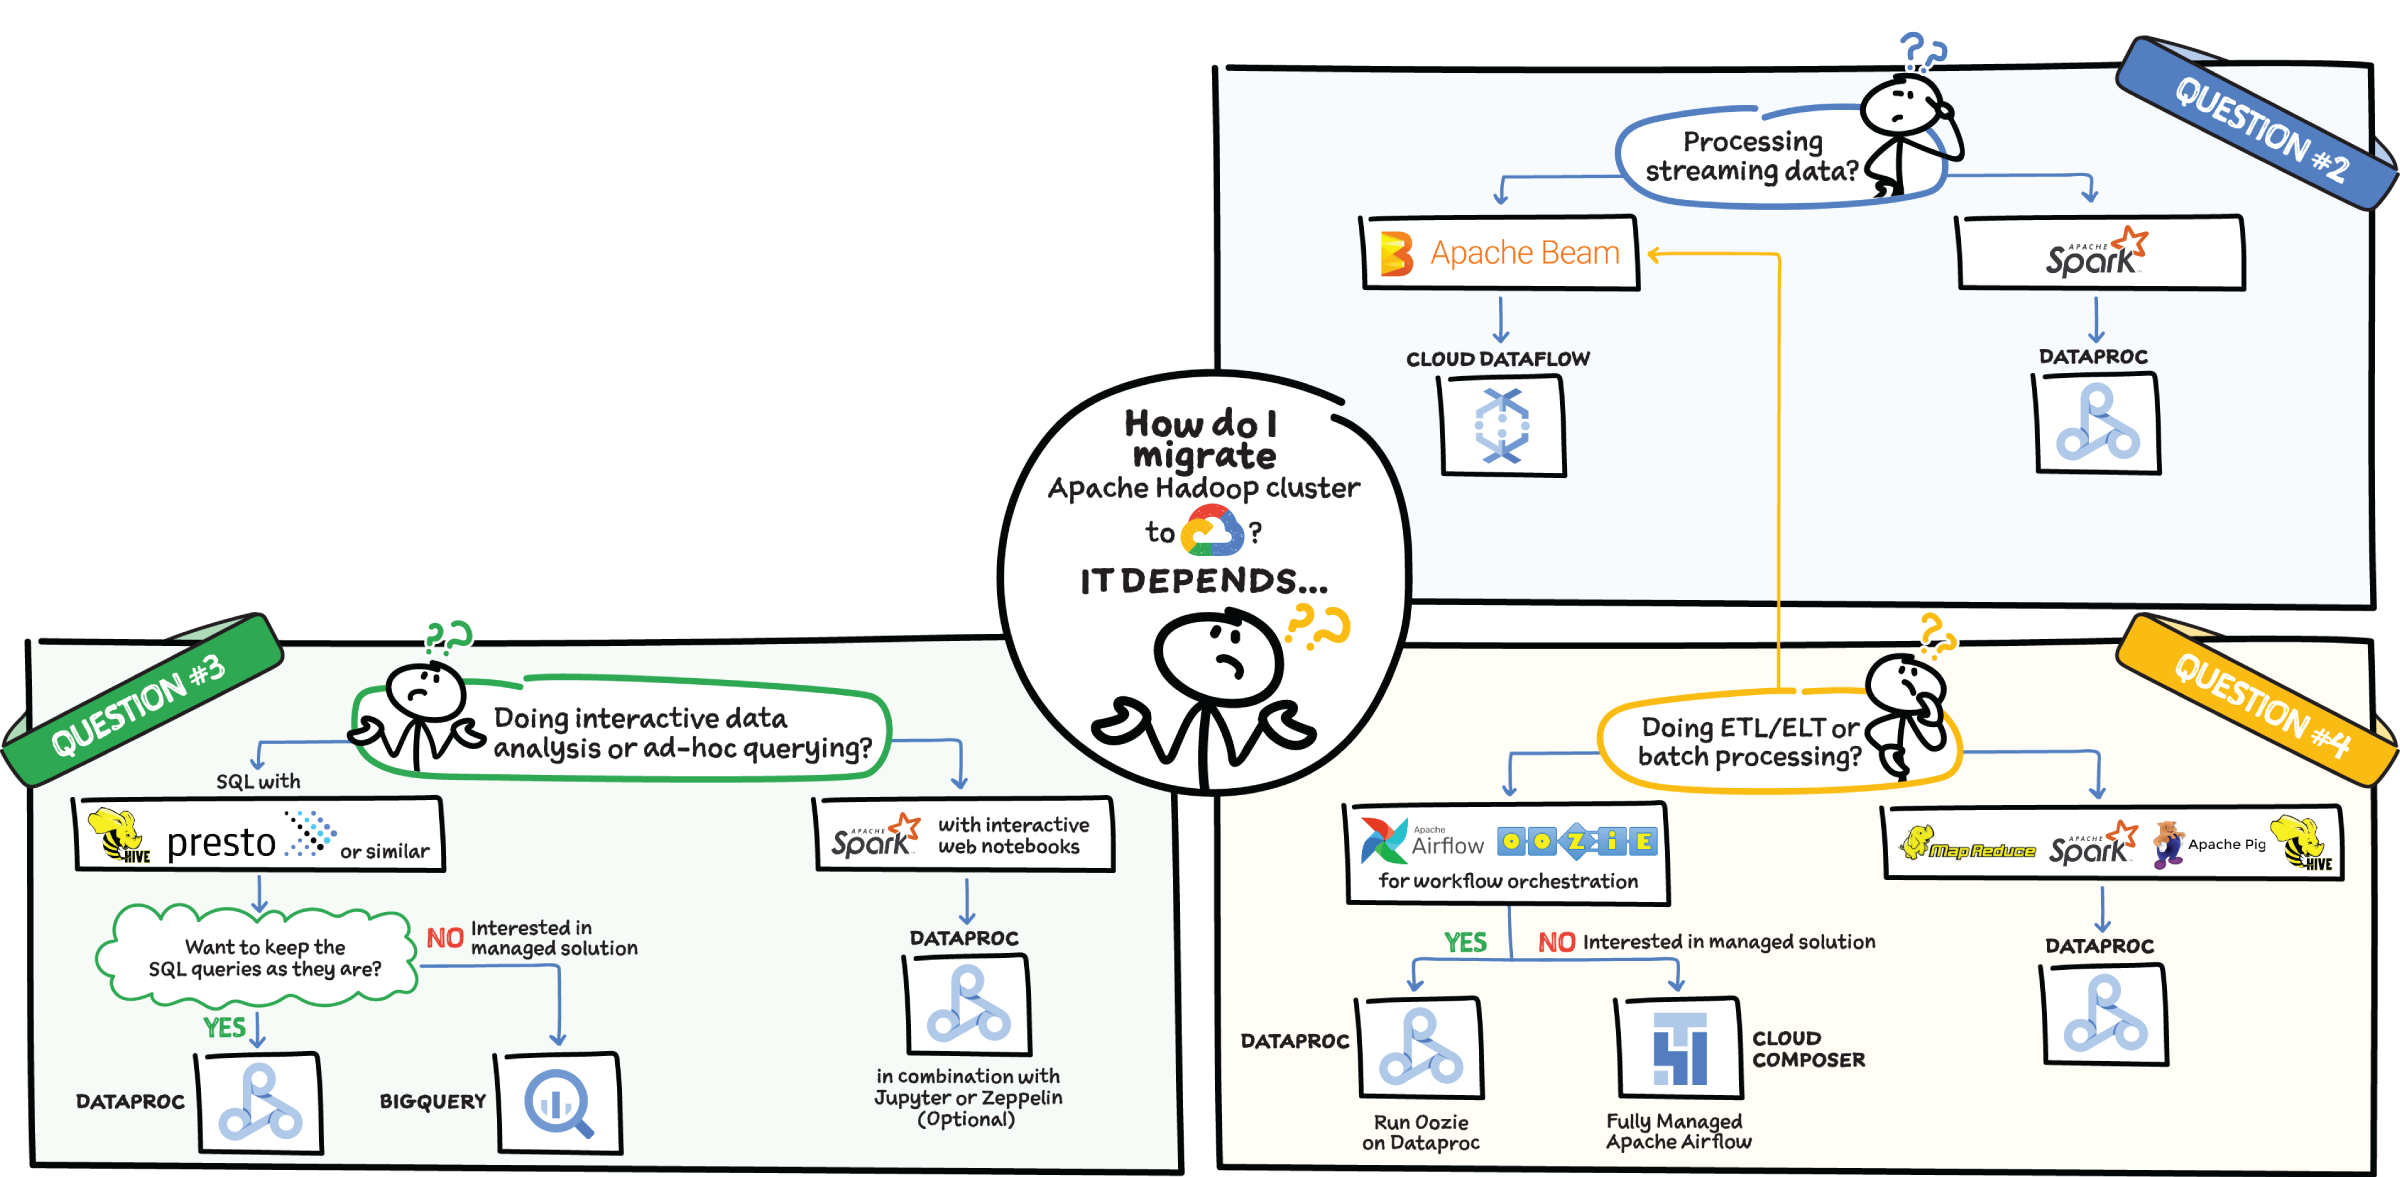
Here are four common scenarios that can help you decide how to migrate Apache Hadoop Cluster to Google Cloud:
- If you are migrating NoSQL workloads and if you use Hbase, then check if you need to use co-processors or SQL with Phoenix. In that case, Dataproc is the best option. If not, then Bigtable is a good choice, because it is a managed wide-column NoSQL database.
- If you are processing streaming data and you use Apache Beam, it makes sense to use Dataflow because it is based on the Apache Beam SDK. If you are using Spark or Kafka, then Dataproc is best, since it manages all Spark and Hadoop workloads.
- If you are doing interactive data analysis or ad hoc querying in Spark with an interactive notebook, then Dataproc is great in combination with managed Jupyter notebooks in Vertex AI or Zeppelin. If you are doing data analysis with SQL in Hive or Presto and want to keep it that way, then also Dataproc is perfect. But if you are interested in a managed solution for this interactive data analysis, then use BigQuery, a fully managed data analysis and warehousing solution.
- If you are doing ETL or batch processing using mapreduce, pig, spark, or hive, then use Dataproc. Similarly, if you use the workflow orchestration tool such as Apache Airflow or Oozie and want to keep the jobs as they are, Dataproc is perfect. But if you want to pick a managed solution, then use Cloud Composer, a managed Apache Airflow service.
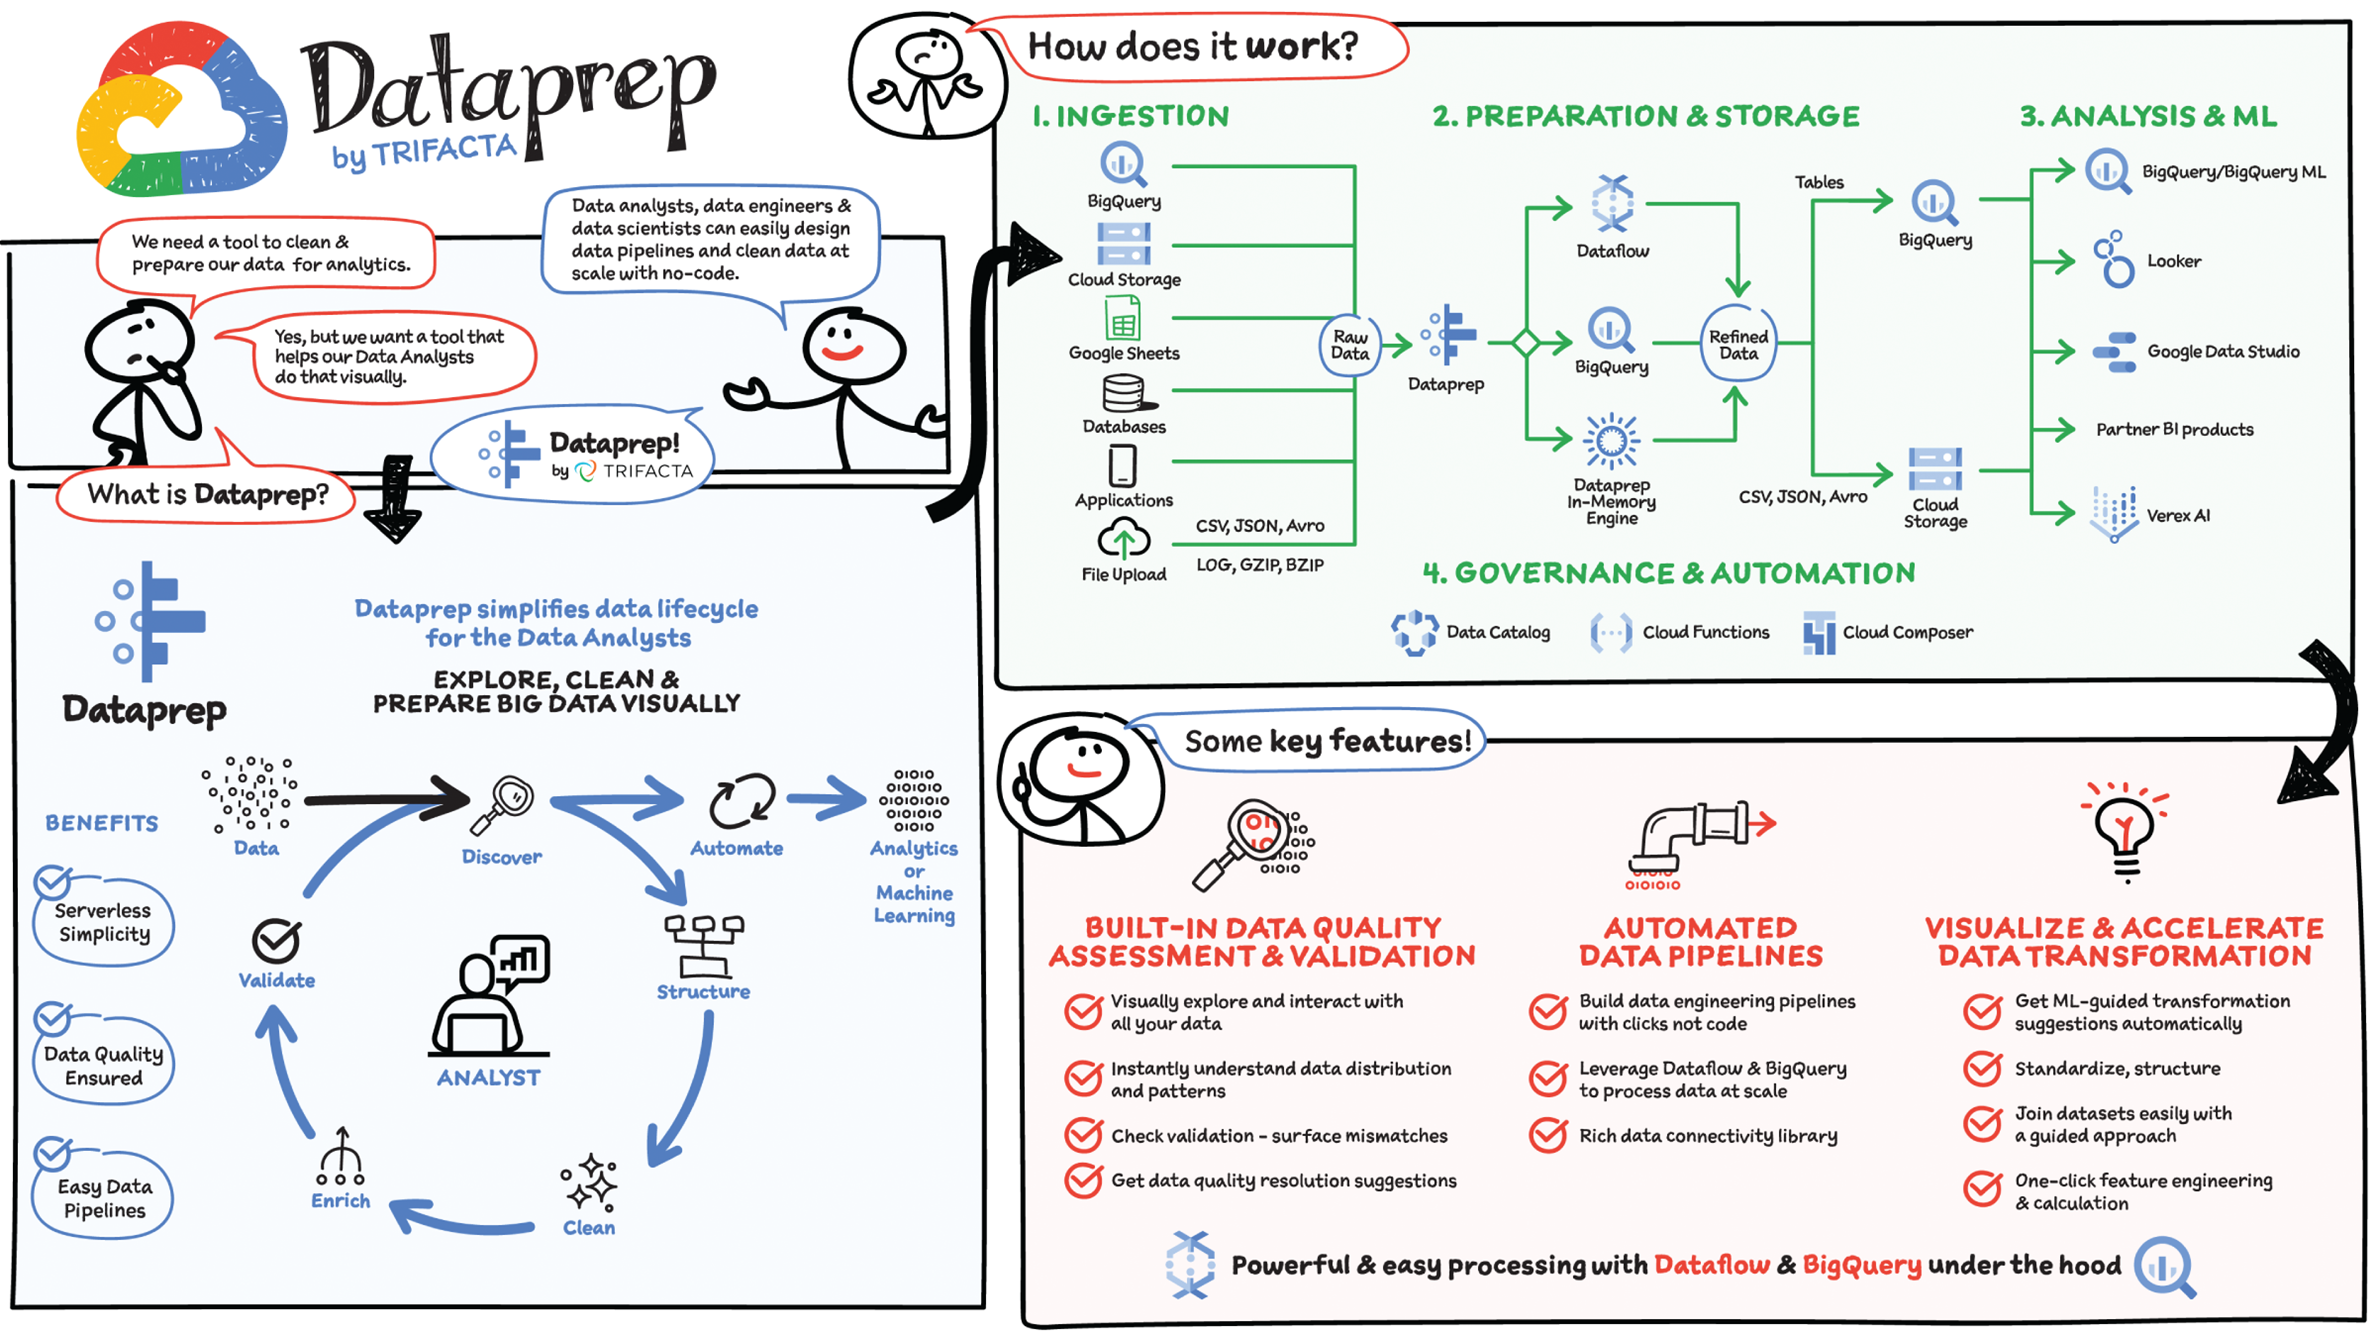
Whether you are in a leadership position leveraging data for decision-making or in a support role to deliver clean and trustworthy data, you know how much effort (and often frustration) it takes to prepare data and make it ready for consumption. Where is the data? How do I access it? What's in the data? Can I trust the data? How can I turn it into a format that I can use? How do I combine it with other sets of data? How do I automate all this process? Let's see how you can turn this cumbersome and painful process into a seamless and fun experience with Dataprep!
Dataprep by Trifacta is a serverless and native Google Cloud data preparation solution as part of the broader Google Cloud Smart Analytics portfolio. Dataprep allows data analysts, business analysts, data engineers, and data scientists to visually explore, clean, and prepare big data.
What Is Data Preparation?
Data preparation, also known as data wrangling, is a self-service activity to access, assess, and convert disparate, raw, messy data into a clean and consistent view for your analytics and data science needs. Preparing data is critical but time-intensive; data teams spend up to 80% of their time converting raw data into a high-quality, analysis-ready output.
The work of preparing raw data into a pristine asset consists of five iterative steps:
Discover
How do I access the data? What is in the data? Can I trust it? Dataprep helps you access diverse data sources and discover features of the data to quickly determine its value.
Structure
Can the data be used with its current format? Structuring refers to actions that change the form or schema of your data. Splitting columns, pivoting rows, and deleting fields are all forms of structuring. Dataprep predicts and suggests the next best transformation based on the data you're working with and the type of interaction you applied to the data.
Clean
Are all the dates valid? Is the category correct? Is a SKU missing? During the cleaning stage, Dataprep surfaces data quality issues, such as missing or mismatched values, and suggests the appropriate transformations.
Enrich
Do you want to keep your data alone or augment it with other datasets from public or internal repositories? The data you need may be spread across multiple files, applications, and databases. With Dataprep you can quickly execute lookups to data dictionaries or perform joins and unions with disparate datasets.
Validate
Do you trust the transformations you applied to your data? Is this an accurate result? Dataprep profiles and provides data quality indicators across the complete transformed dataset. Here, you can do a final check for any data inaccuracy that wasn't initially identified.
When your data has been successfully structured, cleaned, enriched, and validated, it's time to publish your wrangled output for use in downstream analytics processes.
How Does Dataprep Work?
Dataprep connects to BigQuery, Cloud Storage, Google Sheets, and hundreds of other cloud applications and traditional databases so that you can transform and clean any data you want.
Dataprep is built on top of Dataflow and BigQuery. That means any data transformation and cleaning rules you design can easily scale to transform any data, big or small, by translating Dataprep data transformation recipes into Dataflow jobs or BigQuery SQL statements.
Once your data is ready in BigQuery or Cloud Storage, you can analyze it with Data Studio or Looker, train ML models with Vertex AI services, or get insight with other analytics partner solutions such as Qlik or Tableau.
Dataprep, as a native service to Google Cloud, can be governed and automated via APIs to be controlled by Cloud Composer and Cloud Functions, for example.
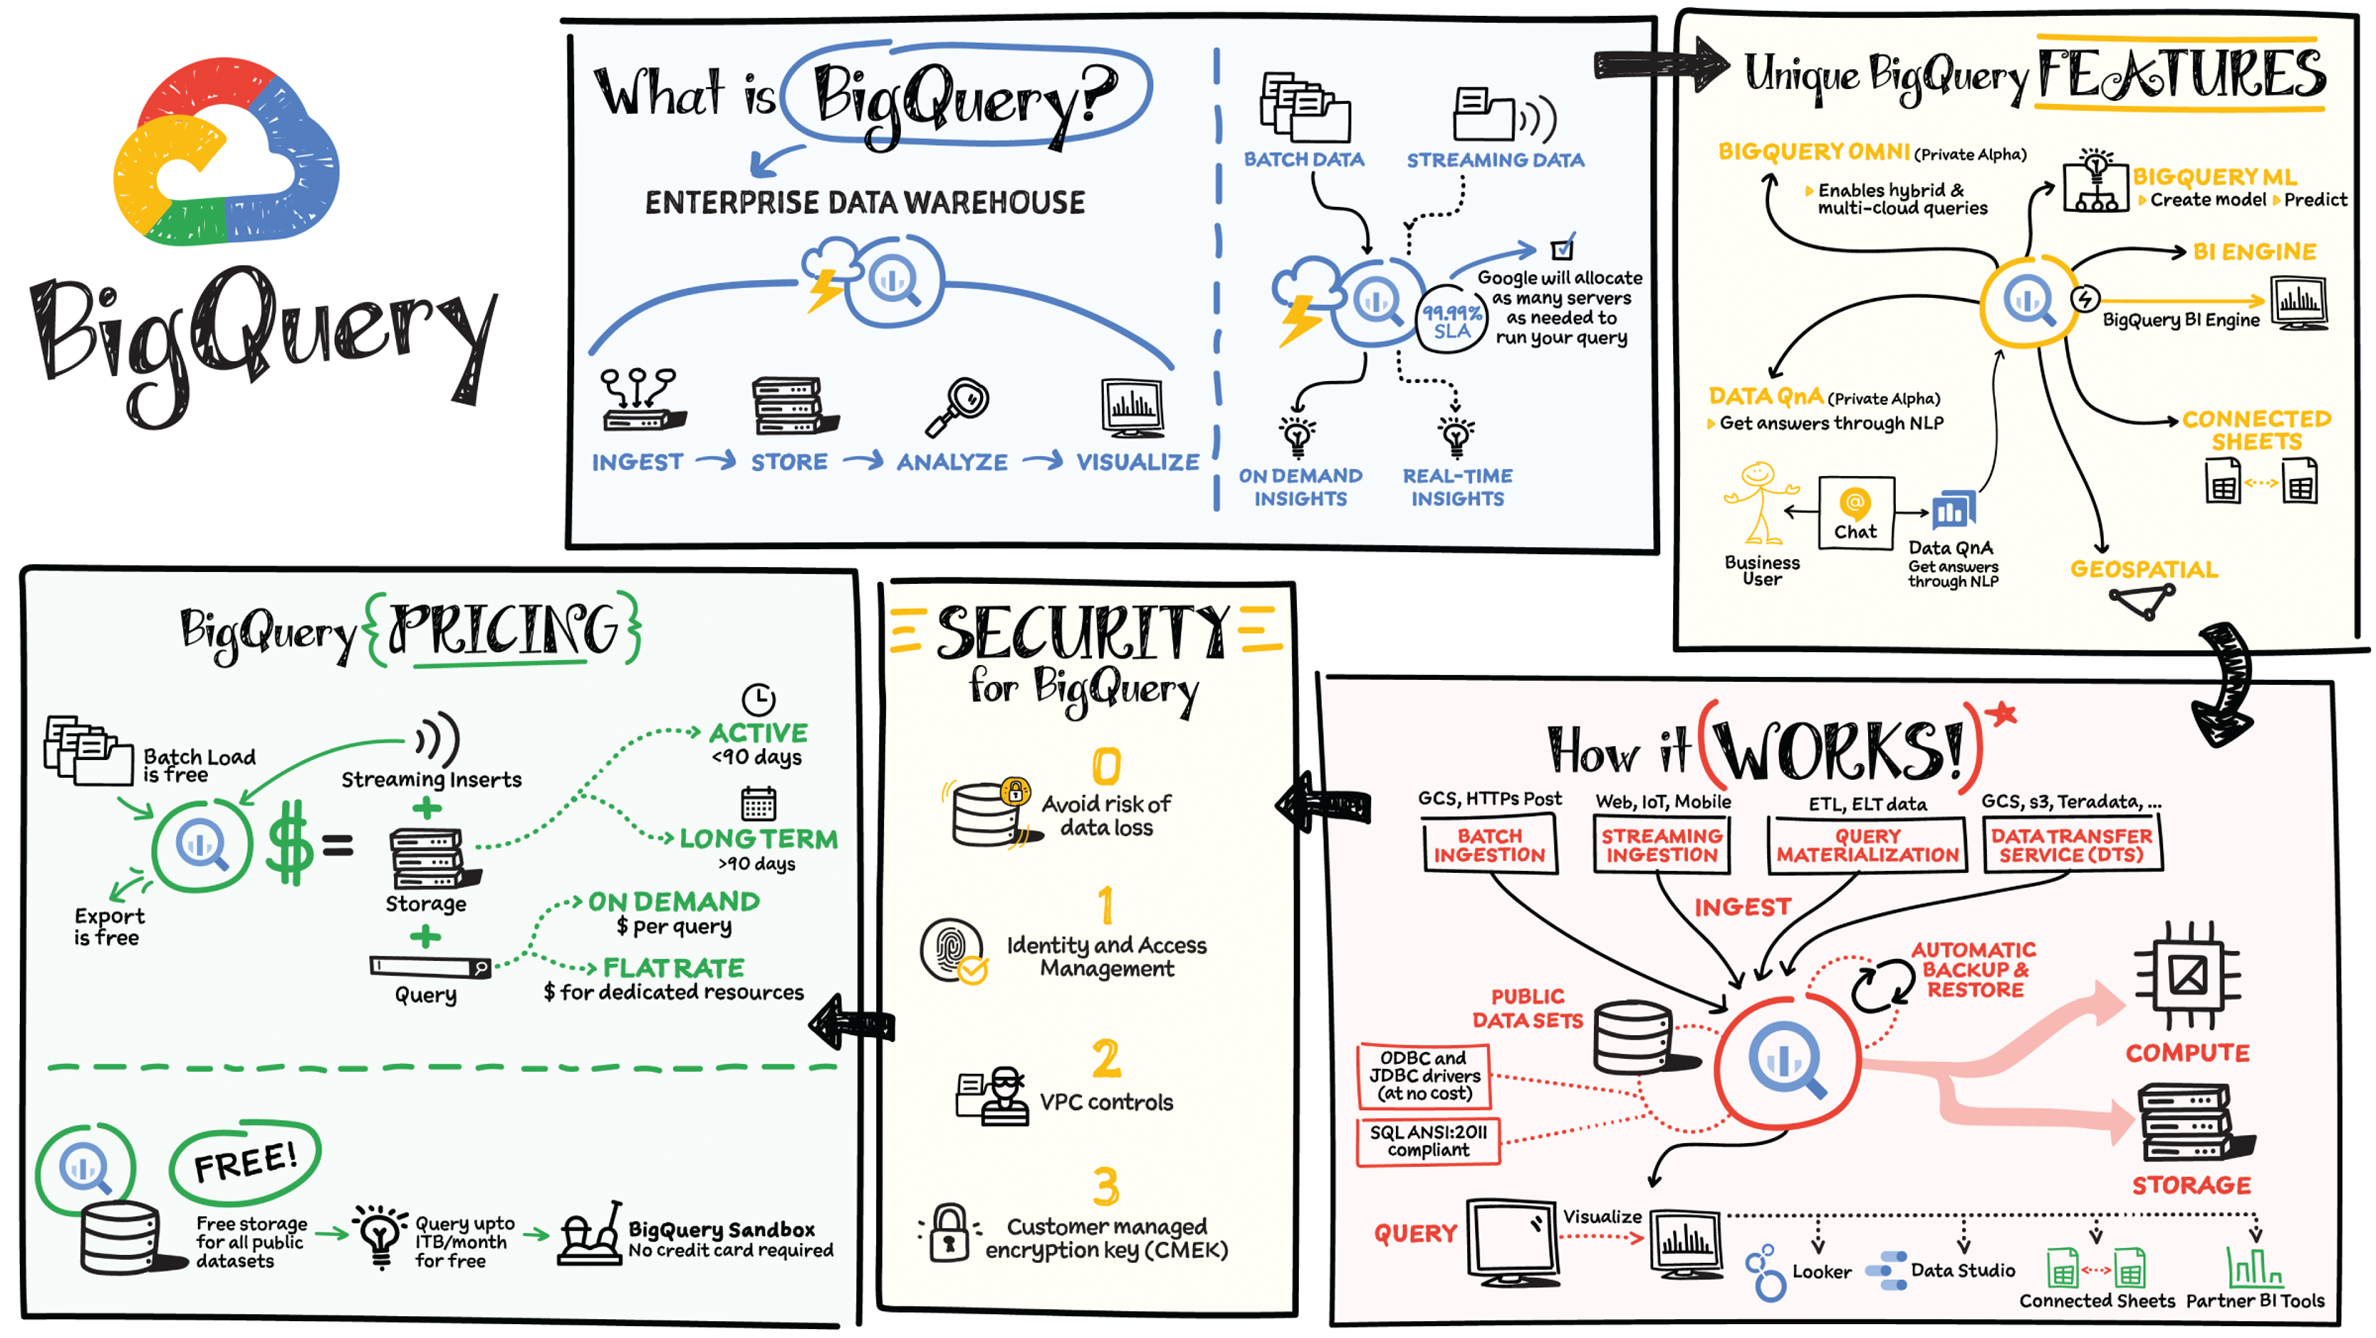
Organizations rely on data warehouses to aggregate data from disparate sources, process it, and make it available for data analysis and to support strategic decision-making. BigQuery is Google Cloud's enterprise data warehouse designed to help organizations run large-scale analytics with ease and quickly unlock actionable insights. You can ingest data into BigQuery either through batch uploading or streaming data directly to unlock real-time insights. As a fully managed data warehouse, Google takes care of the infrastructure so you can focus on analyzing your data up to petabyte scale. BigQuery supports Structured Query Language (SQL) for analyzing your data, which you may be familiar with if you've worked with ANSI-compliant relational databases.
BigQuery Unique Features
- BI Engine — BigQuery BI Engine is a fast, in-memory analysis service that enables sub-second query response time with high concurrency. BI Engine integrates with Google Data Studio and Looker for visualizing query results and enables integration with other popular business intelligence (BI) tools.
- BigQuery ML — BigQuery ML is unlocking machine learning for millions of data analysts. It allows data analysts or data scientists to build and operationalize machine learning models directly within BigQuery by using simple SQL.
- BigQuery Omni — BigQuery Omni is a flexible, multi-cloud analytics solution powered by Anthos that lets you cost-effectively access and securely analyze data across Google Cloud, Amazon Web Services (AWS), and Azure, without leaving the BigQuery user interface (UI). Using standard SQL and the same BigQuery APIs, you can break down data silos and gain critical business insights from a single pane of glass.
- Data QnA — Data QnA enables self-service analytics for business users on BigQuery data as well as federated data from Cloud Storage, Bigtable, Cloud SQL, or Google Drive. It uses Dialogflow and allows users to formulate free-form text analytical questions with auto-suggested entities while users type a question.
- Connected Sheets — This native integration between Sheets and BigQuery makes it possible for all business stakeholders, who are already quite familiar with spreadsheet tools, to get their own up-to-date insights whenever they need it.
- Geospatial data — BigQuery offers accurate spatial analysis with geography data type over GeoJSON and WKT formats. It supports core GIS functions — measurements, transforms, constructors, etc. — using familiar SQL.
How Does It Work?
Here's how it works: You ingest your own data into BigQuery or use data from the public datasets. Storage and compute are decoupled and can scale independently on-demand. This offers immense flexibility and cost control for your business since you don't need to keep your expensive compute resources up and running all the time. This is very different than the traditional node-based cloud data warehouse solutions or on-premise systems. Backup and restore of data are performed automatically so you don't have to.
You can ingest data into BigQuery in batches or stream real-time data from web, IoT, or mobile devices via Pub/Sub. You can also use Data Transfer Service to ingest data from other clouds, on-premise systems, or third-party services. BigQuery also supports ODBC and JDBC drivers to connect with existing tools and infrastructure.
Interacting with BigQuery to load data, run queries, or even create ML models can be done in three different ways. You can use the UI in the Cloud Console, the BigQuery command-line tool, or the API using client libraries available in several languages.
When it comes time to visualize your data, BigQuery integrates with Looker as well as several other business intelligence tools across our partner ecosystem.
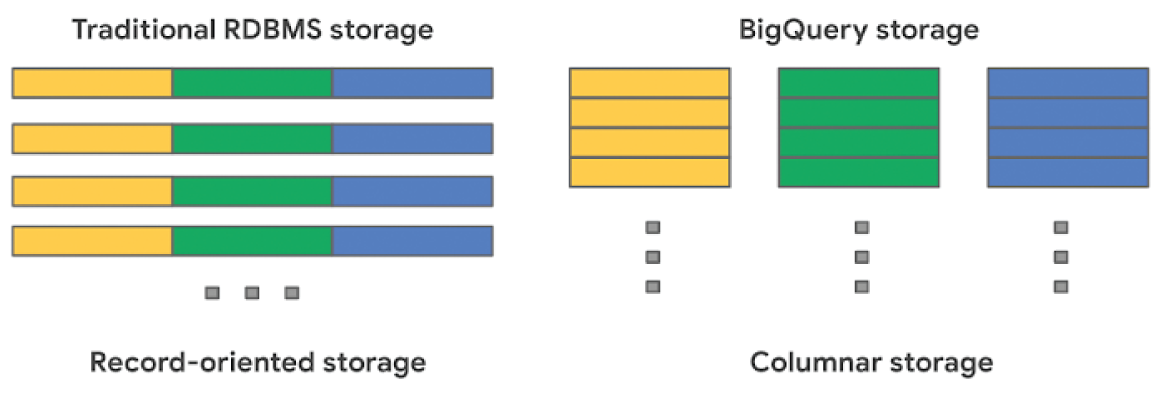
BigQuery Storage Internals
BigQuery offers fully managed storage, meaning you don’t have to provision servers. Sizing is done automatically and you only pay for what you use. Because BigQuery was designed for large scale data analytics data is stored in columnar format.
Traditional relational databases, like Postgres and MySQL, store data row-by-row in record-oriented storage. This makes them great for transactional updates and OLTP (Online Transaction Processing) use cases because they only need to open up a single row to read or write data. However, if you want to perform an aggregation like a sum of an entire column, you would need to read the entire table into memory.
BigQuery uses columnar storage where each column is stored in a separate file block. This makes BigQuery an ideal solution for OLAP (Online Analytical Processing) use cases. When you want to perform aggregations you only need to read the column that you are aggregating over.
Dremel: BigQuery’s query engine
Dremel is made up of a cluster of workers. Each one of these workers executes a part of a task independently and in parallel. BigQuery uses a distributed memory shuffle tier to store intermediate data produced from workers at various stages of execution. The shuffle leverages some fairly interesting Google technologies, such as our very fast petabit network technology, and RAM wherever possible. Each shuffled row can be consumed by workers as soon as it’s created by the producers.
This makes it possible to execute distributed operations in a pipeline. Additionally, if a worker has partially written some of its output and then terminated (for example, the underlying hardware suffered a power event), that unit of work can simply be re-queued and sent to another worker. A failure of a single worker in a stage doesn’t mean all the workers need to re-run.
When a query is complete, the results are written out to persistent storage and returned to the user. This also enables us to serve up cached results the next time that query executes.

Security
BigQuery offers built-in data protection at scale. It provides security and governance tools to efficiently govern data and democratize insights within your organization.
- Within BigQuery, users can assign dataset-level and project-level permissions to help govern data access. Secure data sharing ensures you can collaborate and operate your business with trust.
- Data is automatically encrypted while in transit and at rest, which ensures that your data is protected from intrusions, theft, and attacks.
- Cloud DLP helps you discover and classify sensitive data assets.
- Cloud IAM provides access control and visibility into security policies.
- Data Catalog helps you discover and manage data.
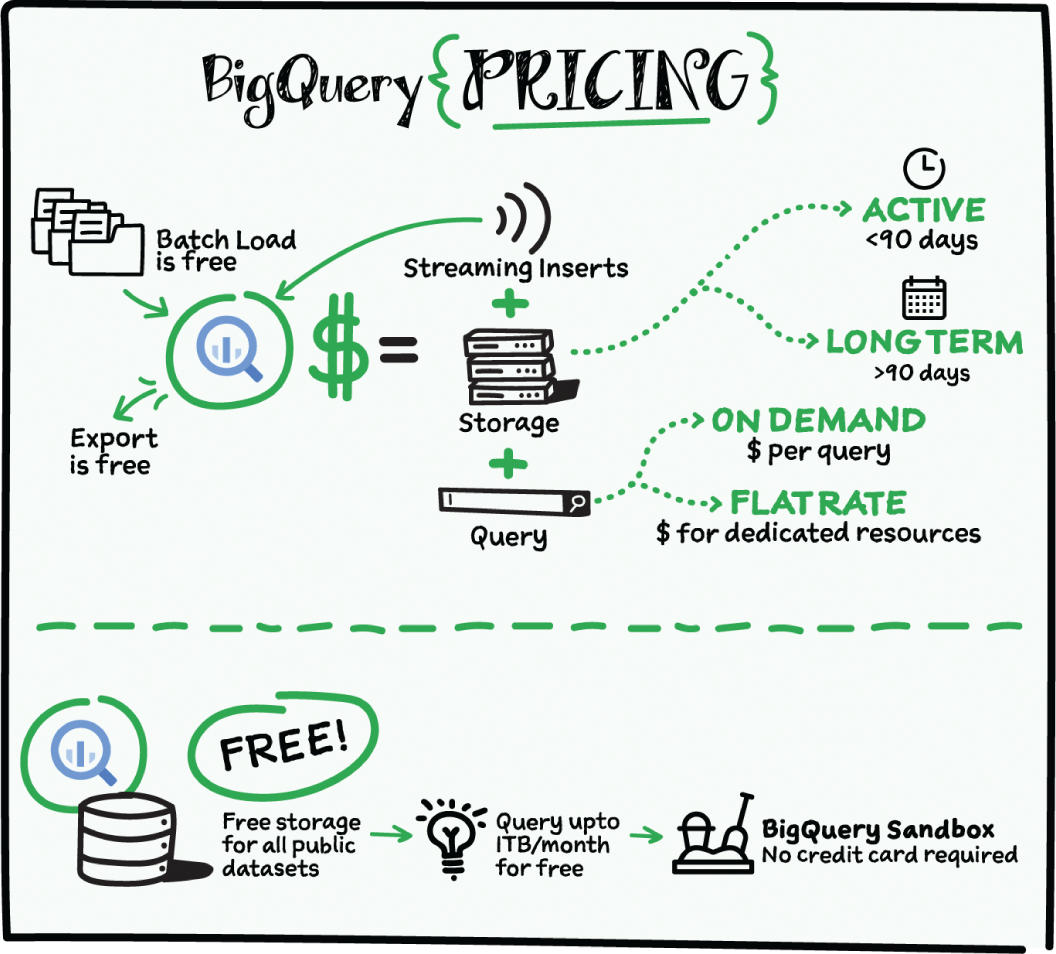
Cost
The BigQuery sandbox lets you explore BigQuery capabilities at no cost and confirm that it fits your needs. BigQuery makes data analysts more productive with flexible and predictable price performance. With BigQuery, you pay for storing and querying data, and streaming inserts. Loading and exporting data are free of charge. Storage costs are based on the amount of data stored and have two rates based on how often the data is changing. Query costs can be either:
- On-demand; you are charged per query by the amount of data processed.
- Flat-rate, if you want to purchase dedicated resources.
Whether initiative-based, ramping over a planned duration, or performing a complete migration of the EDW, choose the model that fits best:
- Start with pay-as-you-go, and move to flat-rate.
- Start with flat-rate, understand usage, and move to pay-as-you-go models for additional workloads .
- Use data warehouse bundles for a fixed monthly cost.
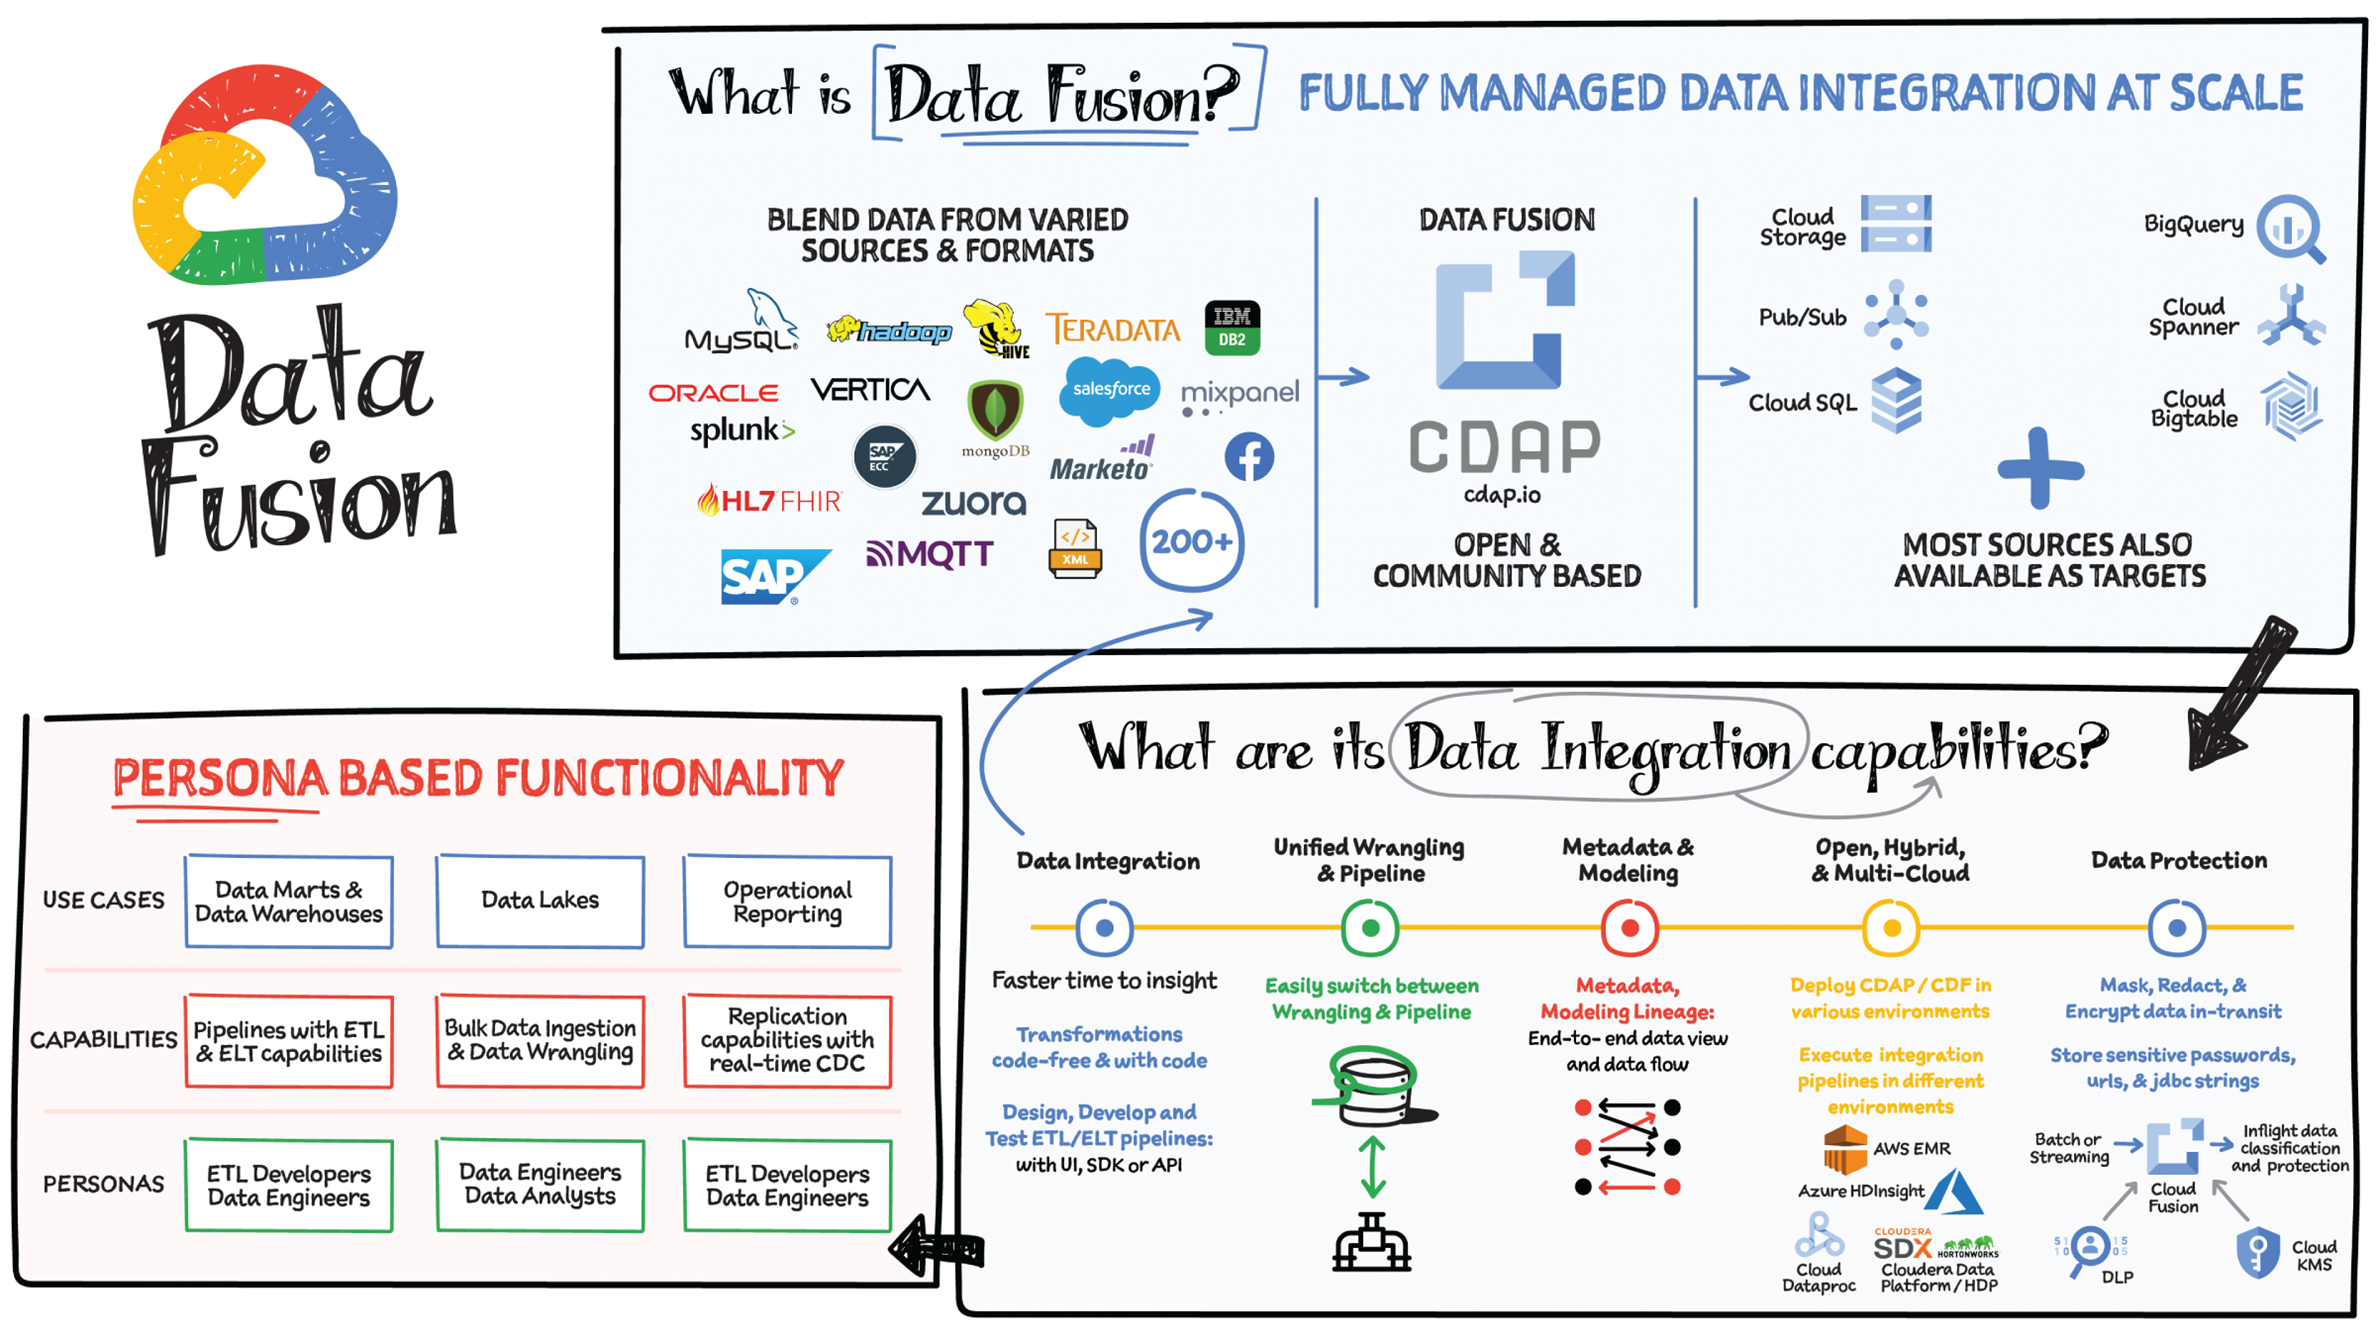
A huge challenge with data analytics is that the data is all over the place and is in different formats. As a result, you often need to complete numerous integration activities before you can start to gain insights from your data. Data Fusion offers a one-stop shop for all enterprise data integration activities, including ingestion, extract transform load (ETL), extract load transform (ELT), and streaming, and with an execution engine optimized for SLAs and cost. It is designed to make lives easier for ETL developers, data analysts, and data engineers.
Data Fusion is Google's cloud-native, fully managed, scalable enterprise data integration platform. It enables bringing transactional, social, or machine data in various formats from databases, applications, messaging systems, mainframes, files, SaaS, and IoT devices; offers an easy to use virtual interface and provides deployment capabilities to execute data pipelines on ephemeral or dedicated Dataproc clusters in Spark. Cloud Data Fusion is powered by open source CDAP, which makes the pipelines portable across Google Cloud or hybrid or multicloud environments.
Data Integration Capabilities
Data Fusion integration capabilities include data integration, unified wrangling and pipeline, metadata and modeling, data protection, and also open, hybrid, and multicloud functionality.
Data Integration
Data Fusion provides data integration for optimized analytics and accelerated data transformations. It supports a broad set of more than 200 connectors and formats, which enable you to extract and wrangle data. You can develop data pipelines in a visual environment to improve productivity. It provides extensive REST API to design, automate, orchestrate, and manage the data pipeline life cycle. It supports all data delivery modes, including batch, streaming, or real-time. It provides operational insights to monitor data integration processes, manage SLAs and help optimize integration jobs. It provides capabilities to parse and enrich unstructured data using Vertex AI, such as converting audio files to text, extracting features from images, documents and more.
Unified Wrangling and Pipeline
Data Fusion builds confidence in business decision-making with advanced data consistency features. It minimizes the risk of mistakes by providing structured ways of specifying transformations, data quality checks, and predefined directives. Data formats change over time, so Data Fusion helps you handle data drift with the ability to identify change and customize error handling.
Metadata and Modeling
Data Fusion makes it easy to gain insights with metadata. You can collect technical, business, and operational metadata for datasets and pipelines and easily discover metadata with a search. It provides end-to-end data views to help you understand the data model and to profile data, flows, and relationships of datasets. It enables exchange of metadata between catalogs and integration with end-user workbenches using REST APIs.
The Data Fusion data lineage feature enables you to understand the flow of your data and how it is prepared for business decisions.
Open, Hybrid, and Multicloud
Data Fusion is cloud-native and powered by CDAP, a 100% open source framework for building on-premises and cloud data analytics applications. This means you can deploy and execute integration pipelines in different environments without any changes to suit business needs.
Data Protection
Data Fusion ensures data security in the following ways:
- It provides secure access to on-premises data with private IP.
- It encrypts data at rest by default or with customer managed encryption keys (CMEKs) to control across all user data in supported storage systems.
- It provides data exfiltration protection via VPC Service Controls, a security perimeter around platform resources.
- You can store sensitive passwords, URLs, and JDBC strings in Cloud KMS, and integrate with external KMS systems.
- It integrates with Cloud DLP to mask, redact, and encrypt data in transit.
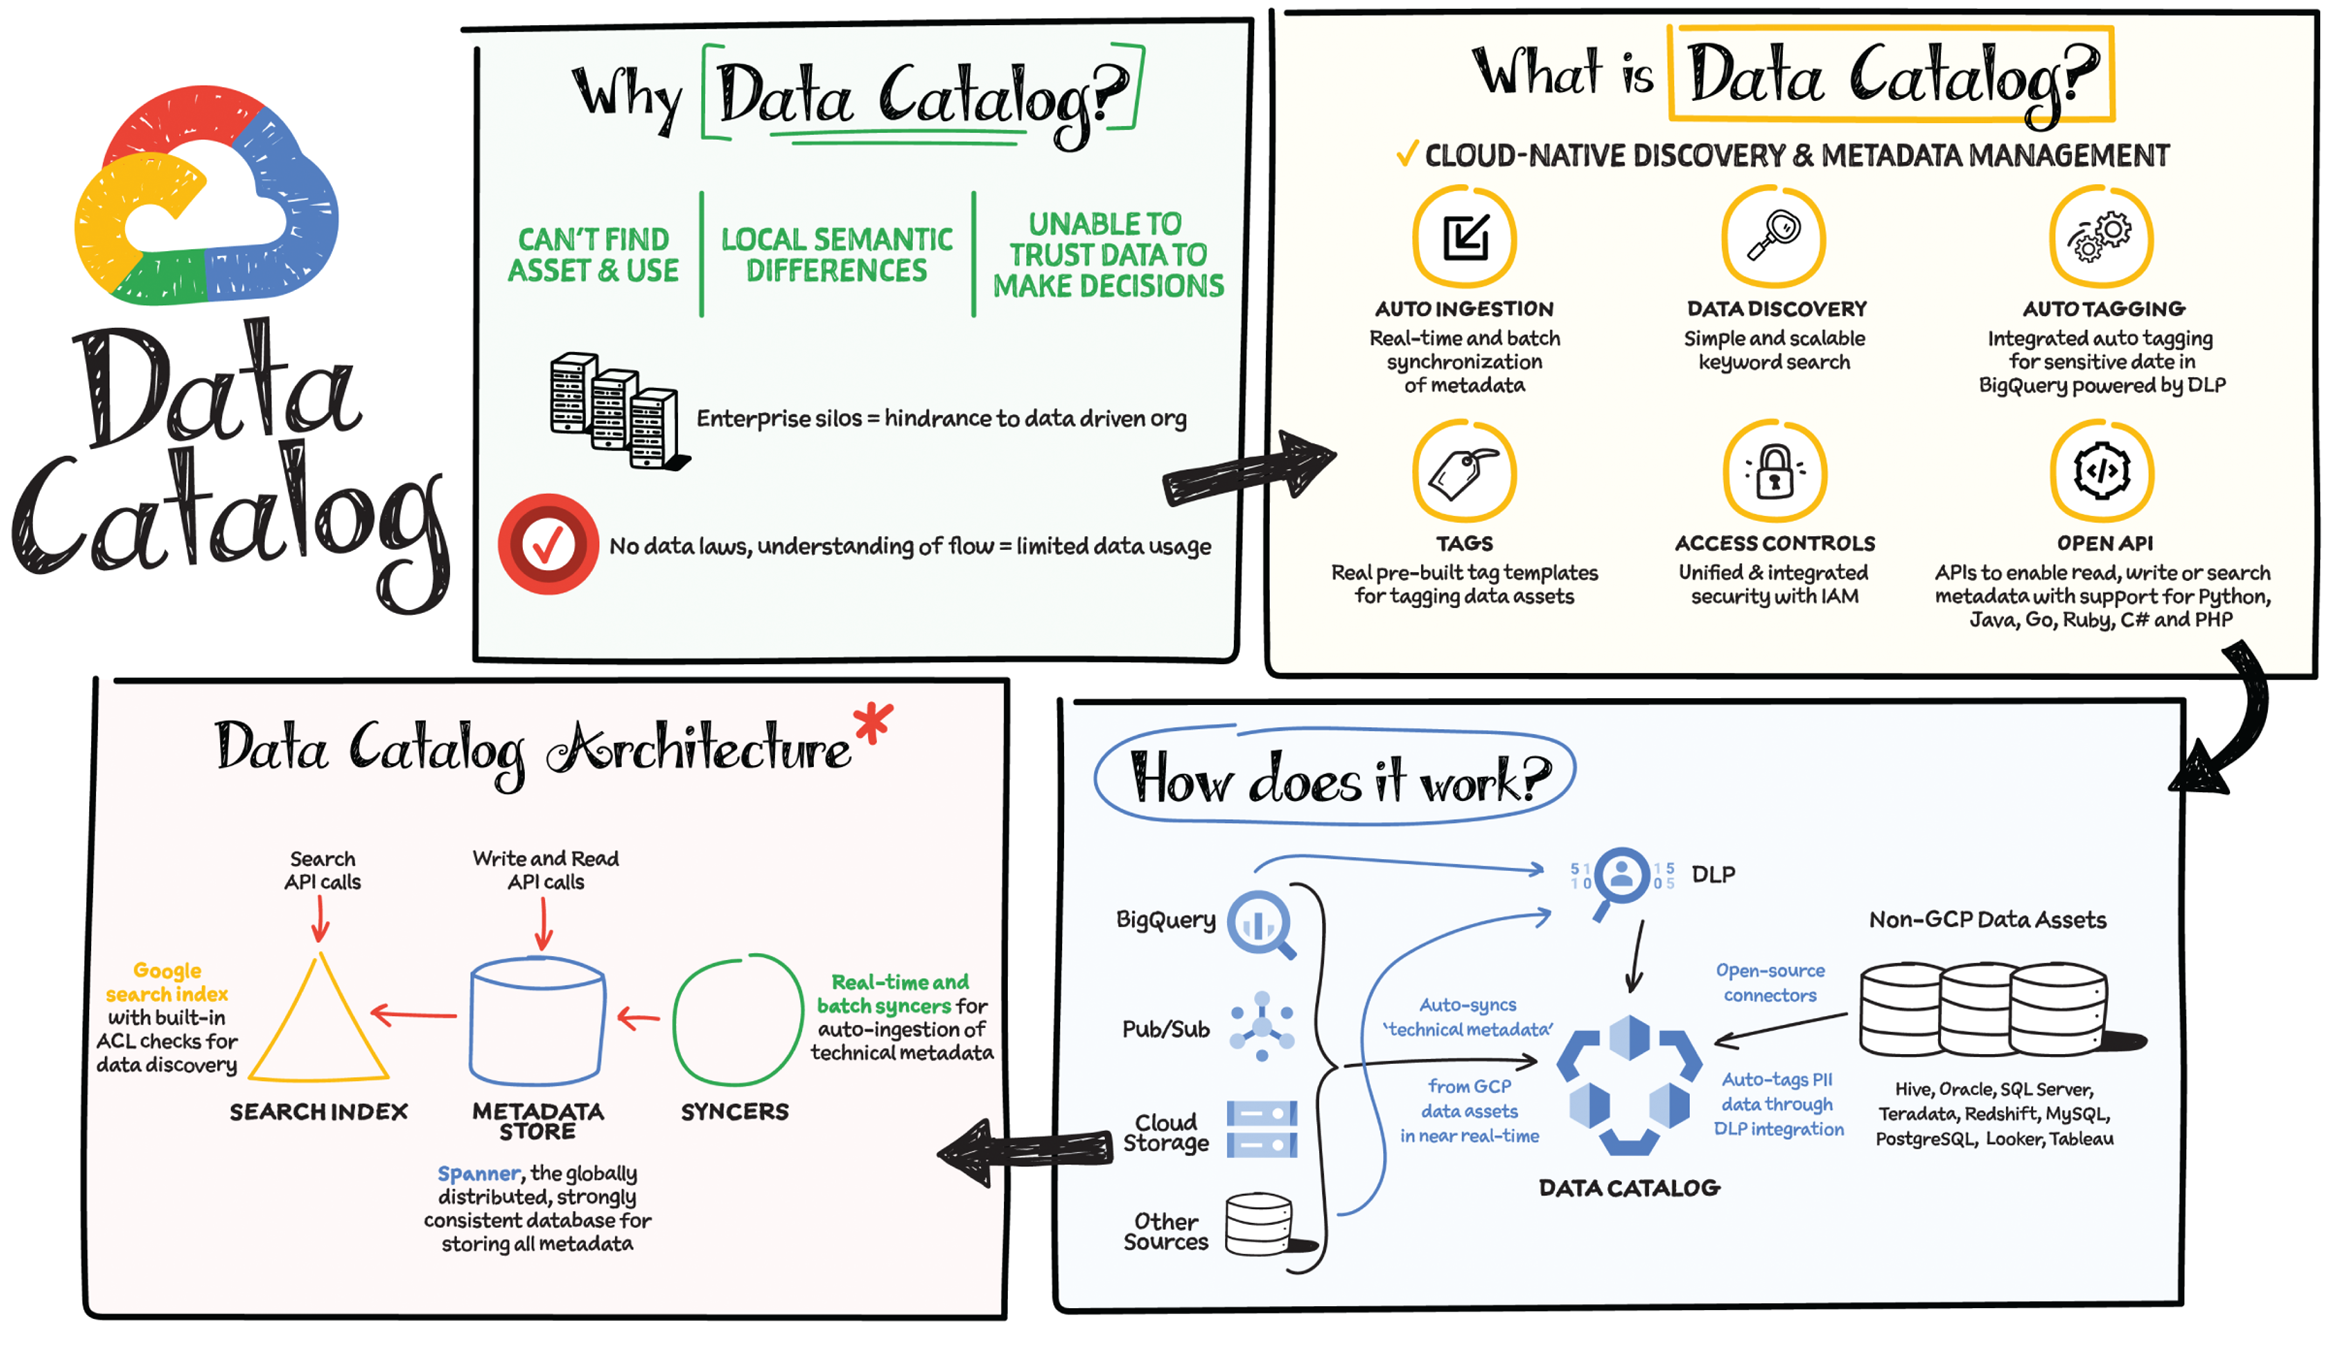
People struggle to find analytic content. The harder it is to find content, the higher the likelihood of business initiative failures. This is why every company, including yours, is on a mission to democratize data and insights by making data discoverable. Due to enterprise silos, teams can't find the assets they need, so they create localized semantics that make it hard to integrate with the rest of the organization and diminishes trust in data quality. These are likely just some of the major challenges hindering your data analytics journey. But how can you make your data easily discoverable? Use Data Catalog!
Data Catalog is a fully managed and scalable metadata management service that empowers you to quickly discover, understand, and manage all your data in one place. It makes data discoverable and democratizes data and insights for both technical and business users, fostering a culture of data-driven decision-making. Data Catalog provides the following:
- A unified view of all your data assets in Google Cloud and in external systems.
- A simple and easy-to-use search interface to quickly and easily discover data assets using the same search technology as Gmail.
- A flexible and powerful system for capturing both technical metadata (automatically) and business metadata (tags) in a structured format.
- Schematized tags, which provide rich and organized business metadata. Tag structure helps you define an implicit relationship between the tag and all the key-value pairs contained within so that you get all the relevant information in a structured form in one glance, which would otherwise have involved looking up multiple tags and deciphering the relationship between them.
- A UI for seamlessly creating and applying business metadata tags.
- Full API access for writing, reading, and searching metadata, as well as for bulk uploads and integration with other systems.
How Does Data Catalog Wor?
Data Catalog provides unified search across all projects, systems, and regions. It does this by:
- Automatically syncing technical metadata from Cloud Storage, Pub/Sub, BigQuery, and other Google Cloud sources
- Providing open source connectors to bring in metadata from external data sources
- Auto-tagging personally identifiable information (PII) data through DLP integration
Data Catalog Architecture
- Syncers: Real-time and batch syncers auto-ingest your technical metadata.
- Metadata store: Spanner, the globally distributed, strongly consistent database, stores all your metadata.
- Search Index: Google Search Index has built-in ACL checks for data discovery using the same technology that powers Gmail and Google Drive.
Data Governance
Data Catalog helps enforce data security policies and maintain compliance through Cloud IAM (Identity and Access Management) and Cloud DLP integrations, which help ensure that only the right people gain access to the right data and sensitive data is protected. Before searching, discovering, or displaying Google Cloud resources, Data Catalog checks that the user has been granted an IAM role with the metadata read permissions required by BigQuery, Pub/Sub, Dataproc Metastore, or other source systems to access the resource.
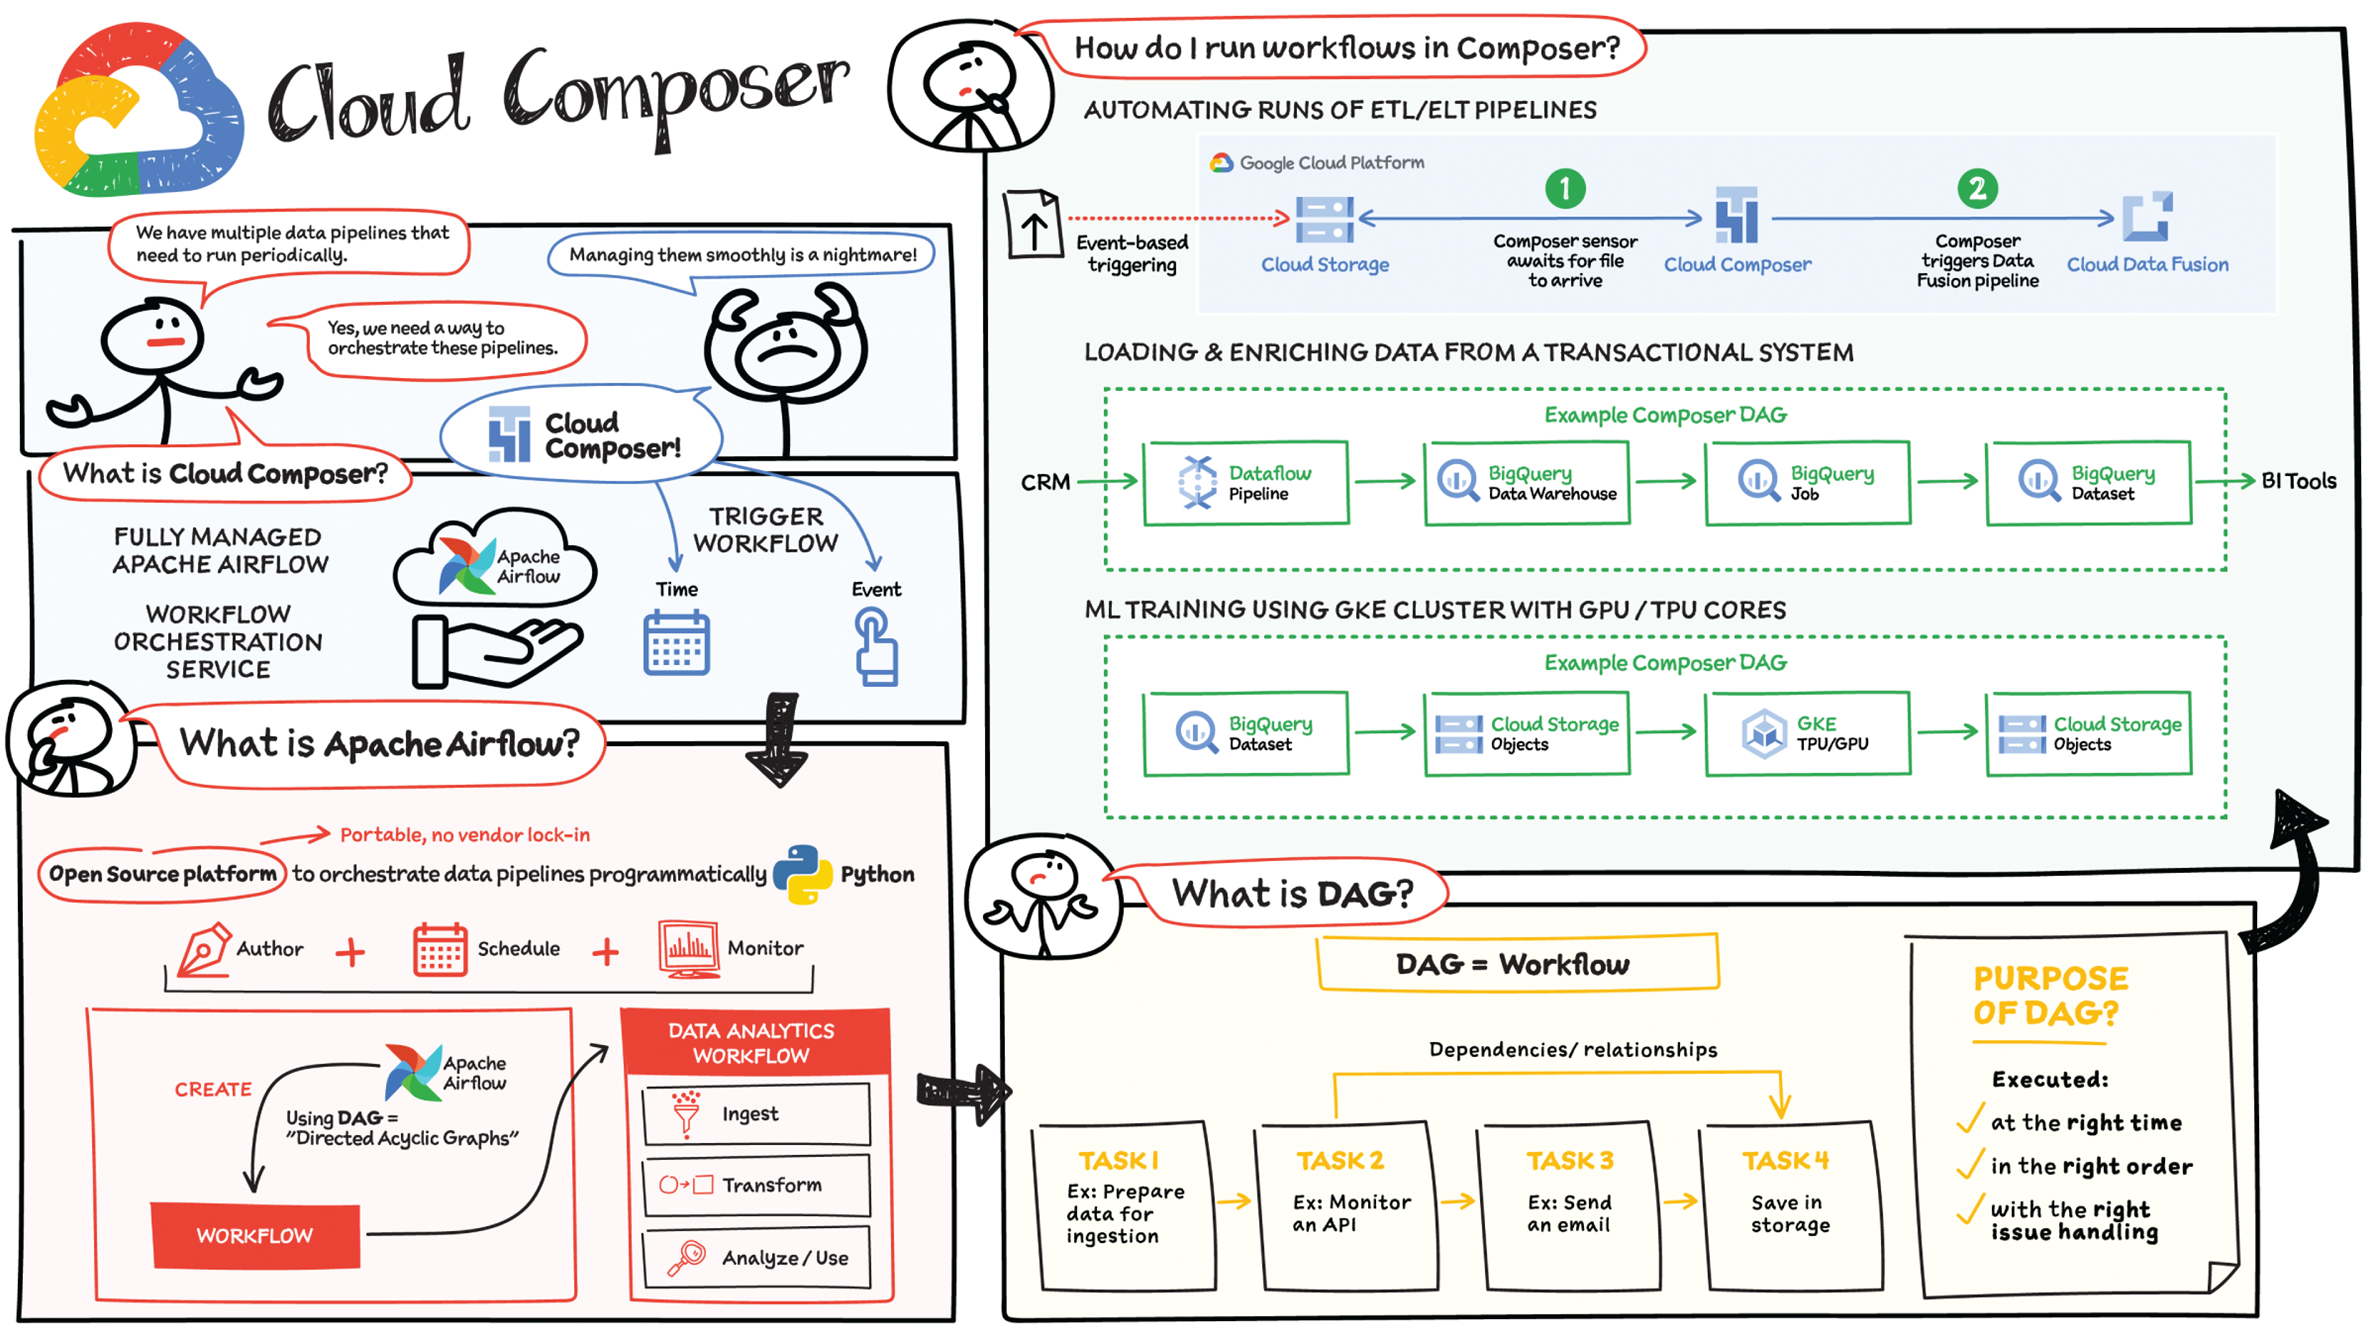
When you are building data pipelines, you need to manage and monitor the workflows in the pipeline and often automate them to run periodically. Cloud Composer is a fully managed workflow orchestration service built on Apache Airflow that helps you author, schedule, and monitor pipelines spanning hybrid and multicloud environments.
By using Cloud Composer instead of managing a local instance of Apache Airflow, you can benefit from the best of Airflow with no installation, management, patching, and backup overhead because Google Cloud takes care of that technical complexity. Cloud Composer is also enterprise-ready and offers a ton of security features so you don't have to worry about it. Last but not least, the latest version of Cloud Composer supports autoscaling, which provides cost efficiency and additional reliability for workflows that have bursty execution patterns.
How Does Cloud Composer Work?
In data analytics, a workflow represents a series of tasks for ingesting, transforming, analyzing, or utilizing data. In Airflow, workflows are created using directed acyclic graphs (DAGs).
A DAG is a collection of tasks that you want to schedule and run, in a way that reflects their relationships and dependencies. DAGs are created in Python scripts, which define the DAG structure (tasks and their dependencies) using code. The purpose of a DAG is to ensure that each task is executed at the right time, in the right order, and with the right issue handling.
Each task in a DAG can represent almost anything — for example, one task might perform data ingestion, another sends an email, and yet another runs a pipeline.
How to Run Workflows in Cloud Composer
After you create a Cloud Composer environment, you can run any workflows your business case requires. The Composer service is based on a distributed architecture running in GKE and other Google Cloud services. You can schedule a workload at a specific time, or you can start a workflow when a specific condition is met, such as when an object is saved to a storage bucket. Cloud Composer comes with built-in integration to almost all Google Cloud products, including BigQuery and Dataproc; it also supports integration (enabled by provider packages from vendors) with applications running on-premises or on another cloud. Here is a list of built-in integration and provider packages.
Cloud Composer Security Features
- Private IP: Using Private IP means that the compute node in Cloud Composer is not publicly accessible and therefore is protected from the public Internet. Developers can access the Internet but the compute node cannot be accessed from the public internet.
- Private IP + Web Server ACLs: The user interface for Airflow is protected by authentication. Only authenticated customers can access the specific Airflow user interface. For additional network-level security, you can use web server access controls along with Private IP, which helps limit access from the outside world by whitelisting a set of IP addresses.
- VPC Native Mode: In conjunction with other features, VPC native mode helps limit access to Composer components in the same VPC network, keeping the components protected.
- VPC Service Controls: Provides increased security by enabling you to configure a network service perimeter that prevents access from the outside world and also prevents access to the outside world.
- Customer-Managed Encryption Keys (CMEKs): Enabling CMEK lets you provide your own encryption keys to encrypt/decrypt environment data.
- Restricting Identities By Domain: This feature enables you to restrict the set of identities that can access Cloud Composer environments to specific domain names, such as @yourcompany.com.
- Integration with Secrets Manager: You can use built-in integration with Secrets Manager to protect keys and passwords used by your DAGs for authentication to external systems.
With data volumes constantly growing, many companies find it difficult to use data effectively and gain insights from it. Often these organizations are burdened with cumbersome and difficult-to-maintain data architectures.
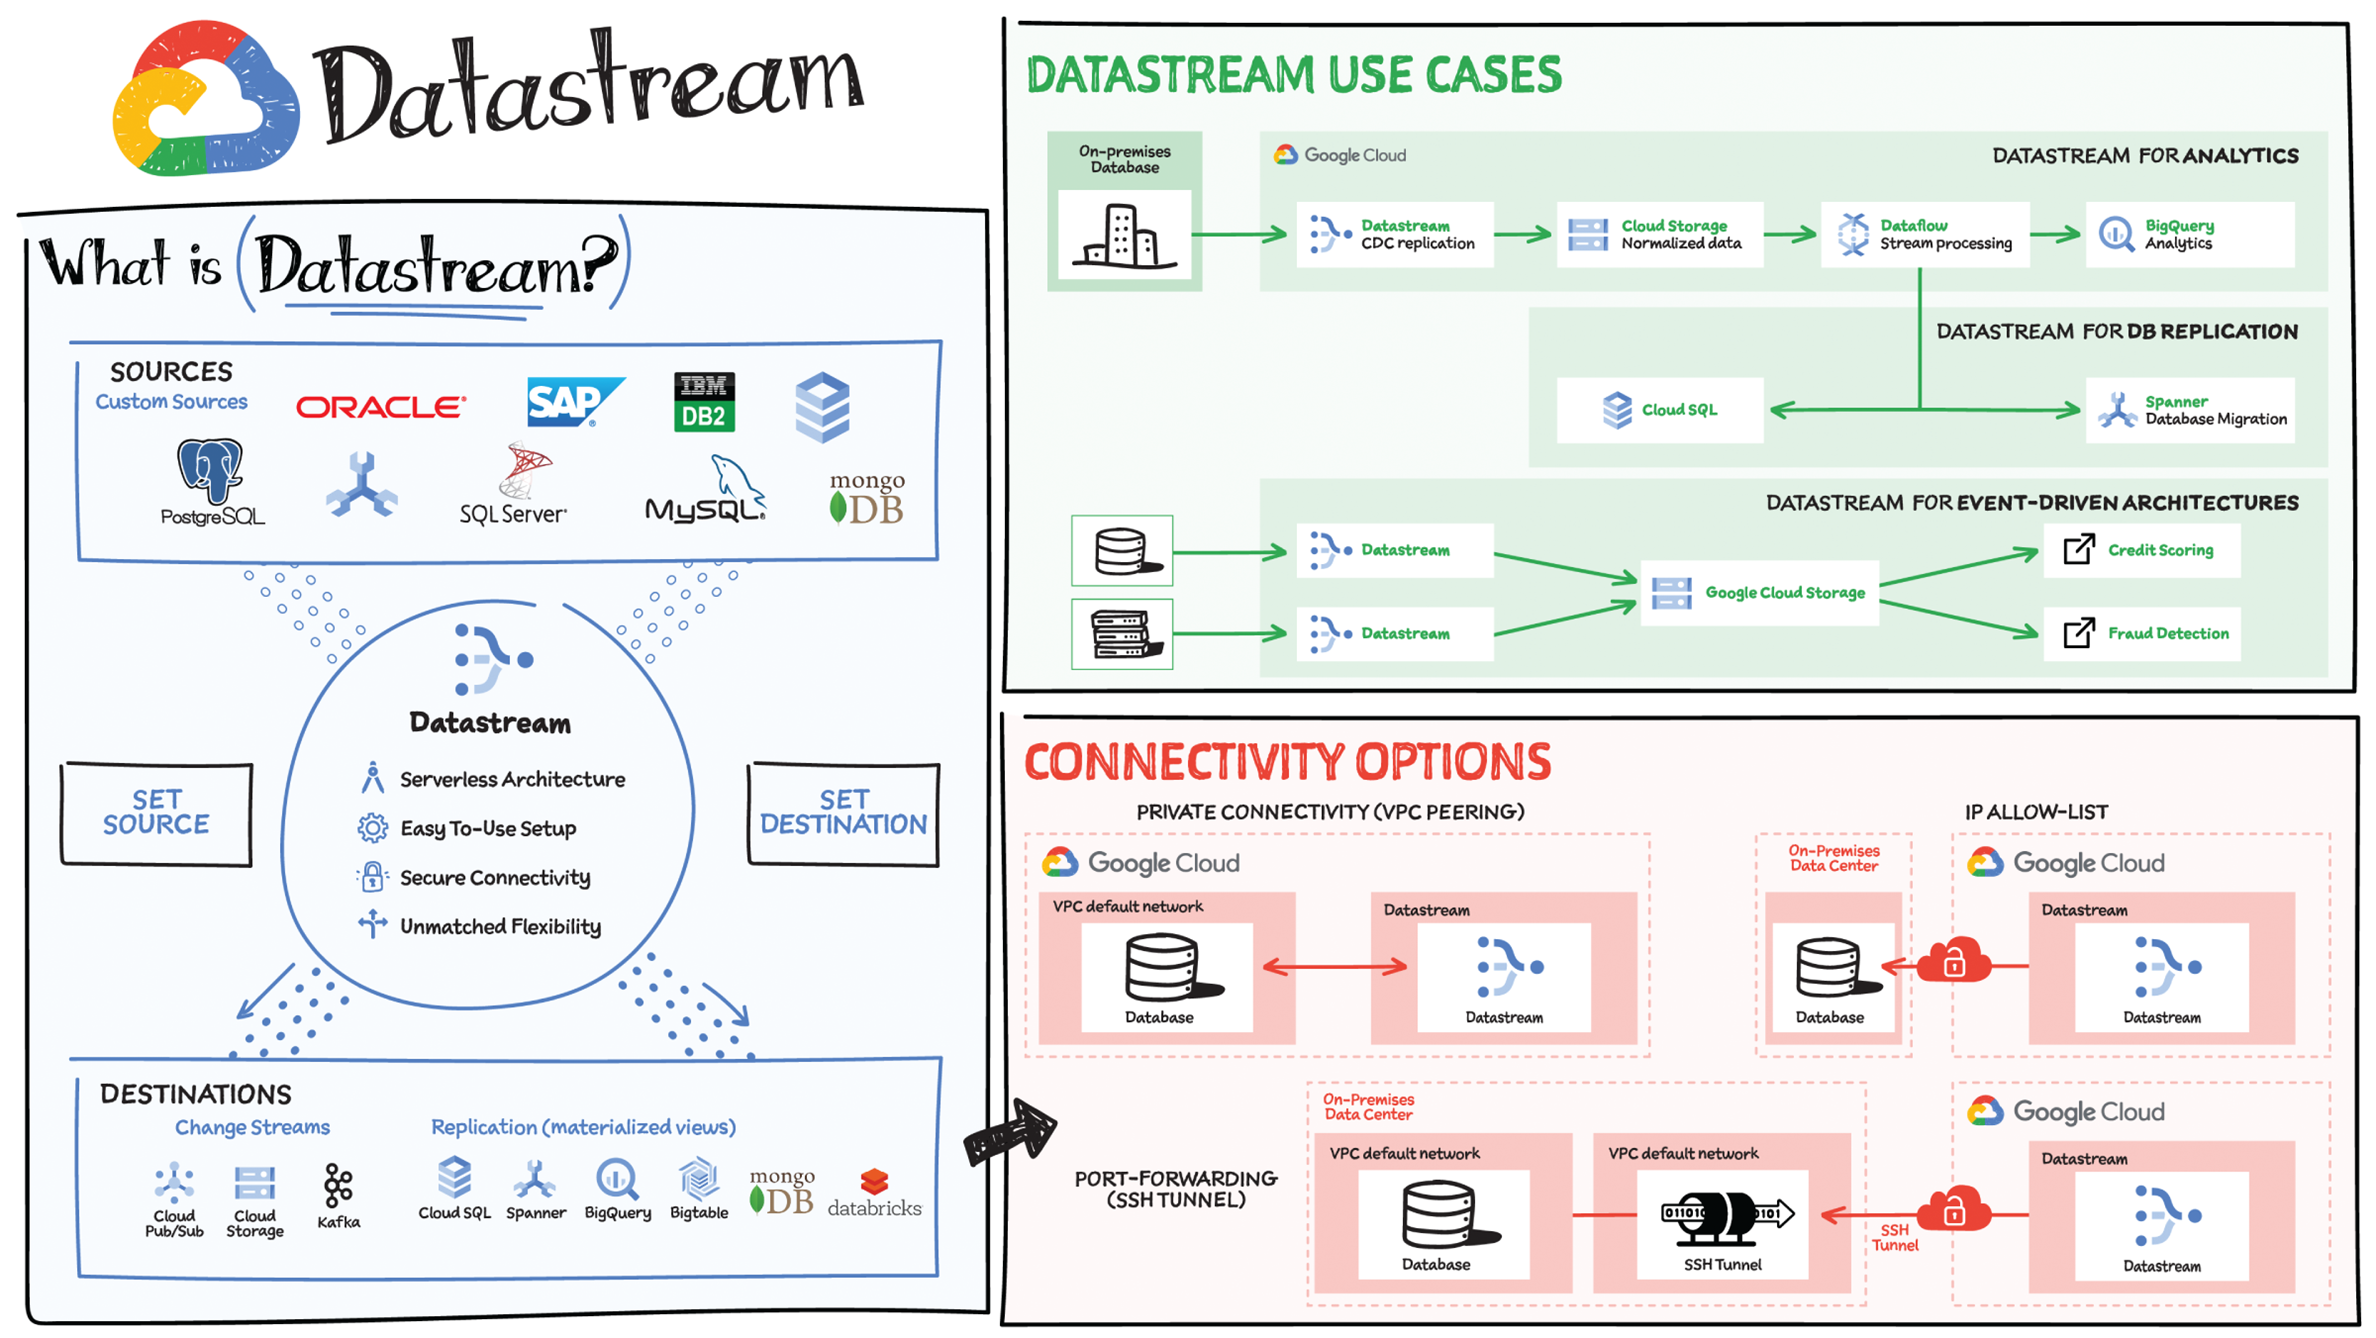
One way that companies are addressing this challenge is with change streaming: the movement of data changes as they happen from a source (typically a database) to a destination. Powered by change data capture (CDC), change streaming has become a critical data architecture building block. Google Cloud recently announced Datastream, a serverless change data capture and replication service. Datastream's key capabilities include:
- Replicate and synchronize data across your organization with minimal latency — You can synchronize data across heterogeneous databases and applications reliably, with low latency, and with minimal impact to the performance of your source. Unlock the power of data streams for analytics, database replication, cloud migration, and event-driven architectures across hybrid environments.
- Scale up or down with a serverless architecture seamlessly — Get up and running fast with a serverless and easy-to-use service that scales seamlessly as your data volumes shift. Focus on deriving up-to-date insights from your data and responding to high-priority issues, instead of managing infrastructure, performance tuning, or resource provisioning.
- Integrate with the Google Cloud data integration suite — Connect data across your organization with Google Cloud data integration products. Datastream leverages Dataflow templates to load data into BigQuery, Cloud Spanner, and Cloud SQL; it also powers Cloud Data Fusion's CDC Replicator connectors for easier-than-ever data pipelining.
How Does It Work?
- Create a source connection profile.
- Create a destination connection profile.
- Create a stream using the source and destination connection profiles, and define the objects to pull from the source.
- Validate and start the stream.
Once started, a stream continuously streams data from the source to the destination. You can pause and then resume the stream.
Connectivity Options
To use Datastream to create a stream from the source database to the destination, you must establish connectivity to the source database. Datastream supports the IP allow list, forward SSH tunnel, and VPC peering network connectivity methods.
Private connectivity configurations enable Datastream to communicate with a data source over a private network (internally within Google Cloud, or with external sources connected over Cloud VPN or Cloud Interconnect). This communication happens through a Virtual Private Cloud (VPC) peering connection.
Datastream Use Cases
Datastream captures change streams from Oracle, MySQL, and other sources for destinations such as Cloud Storage, Pub/Sub, BigQuery, Spanner, and more. Here are some Datastream use cases:
- For analytics, use Datastream with a prebuilt Dataflow template to create up-to-date replicated tables in BigQuery in a fully managed way.
- For database replication, use Datastream with prebuilt Dataflow templates to continuously replicate and synchronize database data into Cloud SQL for PostgreSQL or Cloud Spanner to power low-downtime database migration or hybrid-cloud configuration.
- For building event-driven architectures, use Datastream to ingest changes from multiple sources into object stores like Cloud Storage or, in the future, messaging services such as Pub/Sub or Apache Kafka.
- Streamline a real-time data pipeline that continually streams data from legacy relational data stores (like Oracle and MySQL) using Datastream into MongoDB.
Most companies have data siloed across various applications. Siloed data gets stale quickly because you have to bring it all together from multiple applications and by the time you start analyzing it, the data has often already changed or updated. Additionally, when data is in silos, it can also be hard to ensure data governance — making sure data is easily accessible, credible, and secure. Silos also make it difficult to get a holistic view of the data and to garner fresh insights. To overcome these challenges, companies often centralize their data in a modern data store — such as a database, data warehouse, or data lake — to help enable fast queries as well as optimize performance and cost across various datasets.
Looker's Platform
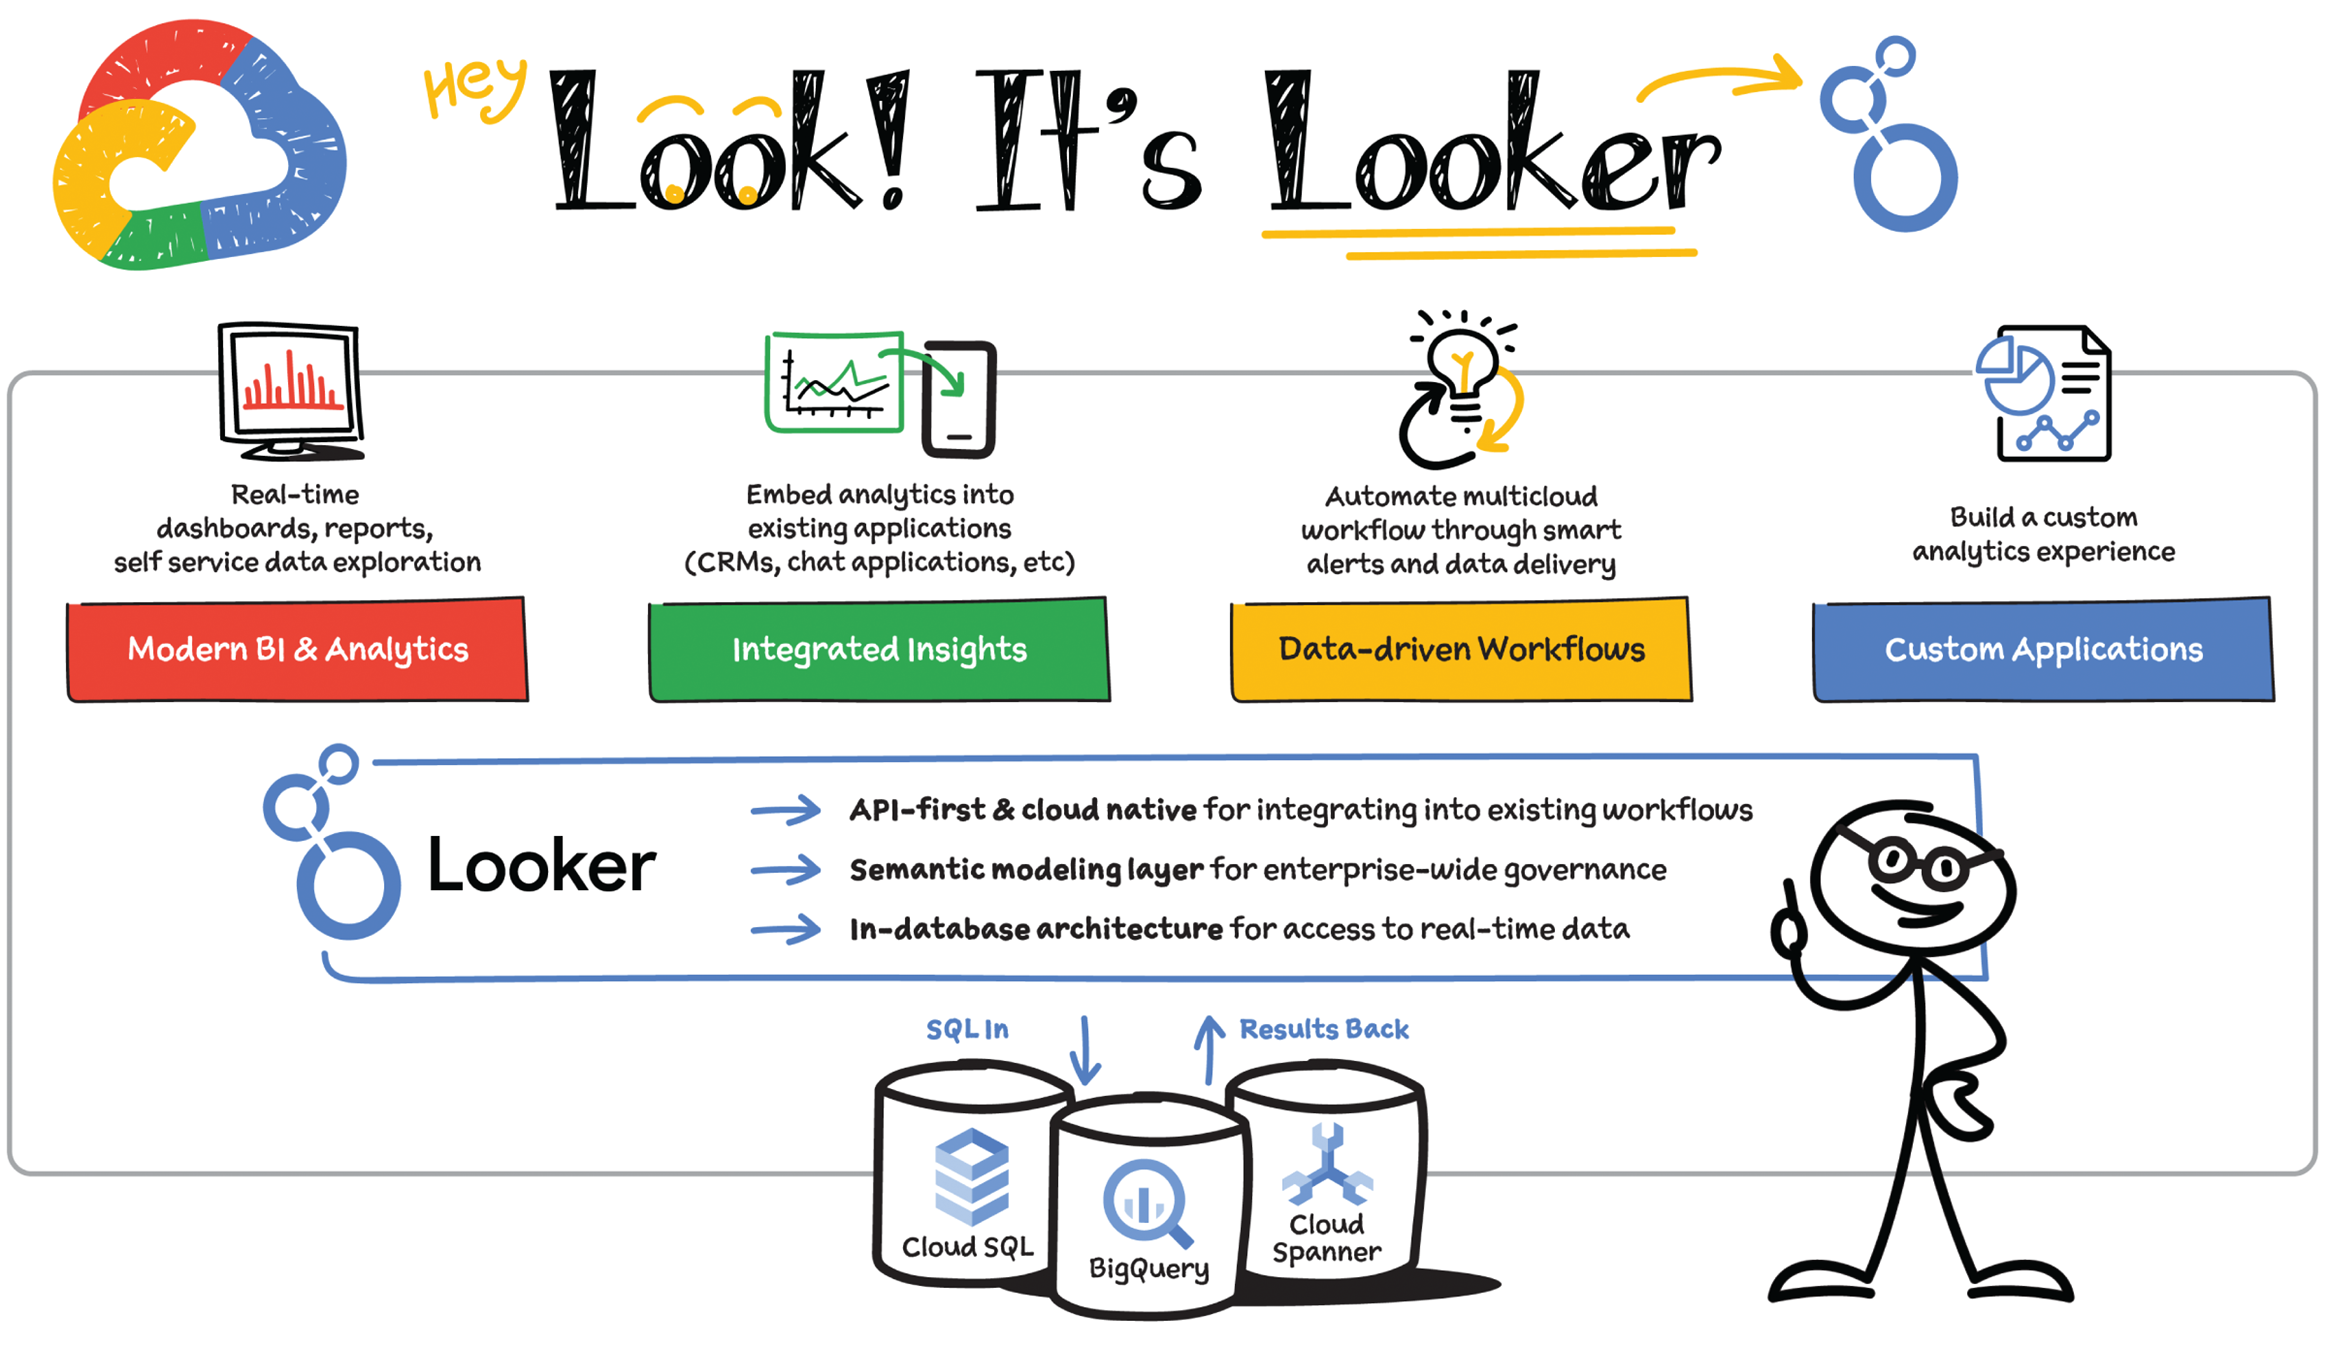
To make the most of your investment in a modern data warehouse such as BigQuery, you need a modern business intelligence (BI) and analytics solution. That's where Looker comes in. Looker, was built to leverage the power of modern data storage and provide governed access to real-time metrics — helping users gain an accurate and up-to-date understanding of their business.
All of this is powered by Looker's platform and its unique architecture, which differentiates itself from other BI tools with a combination of in-database architecture, a semantic modeling layer, and by being cloud-native.
In-Database Architecture
Looker is a 100% cloud-native application that takes advantage the modern enterprise data warehouse (EDW) platforms. Looker sits on top of the database of your choice and leverages its unique functionality, such as creating nested tables in BigQuery or even creating materialized views. This helps provide fast query times over massive datasets, because the computational power comes straight from your warehouse. It also helps provides access to unique features such as geospatial analytics (GIS) and user-defined functions (UDFs). Additionally, the information that you see in Looker is as fresh as what you see in your data warehouse. This means that business users are always making informed decisions, as opposed to working off stale extracts of information. Additionally, Looker's multicloud platform supports more than 50 distinct versions of SQL, so you can maintain the choice and flexibility to host data in the way that works best for you.
Semantic Modeling Layer
With Looker, data teams can build a unified semantic layer using its modeling language, LookML. This enables you to have one definition of metrics and KPIs shared across your organization and easily accessible to everyone who uses data. LookML's integration with Git allows analysts to easily collaborate on metric definitions and provides full version control. Results remain consistent and trust in the data grows internally with your key stakeholders. In addition, you control who accesses what data and how, right down to the row or column level. With LookML, end users can create their own queries on datasets you give them access to without having to know SQL. This empowers your business stakeholders to get real-time access to pressing questions and frees up your data team to focus on driving value and innovation for the business.
Cloud Native
As a cloud-native technology, Looker has rich, extensible APIs that let you send data to where your stakeholders are, such as email or mobile, allowing them to take immediate action on what they see in real-time. With Looker's API and embed capabilities, organizations can build robust data applications that can open up additional revenue streams with limited engineering effort. Using Looker actions, business users can automate operational workflows, thus saving time and ensuring the data is used to make meaningful decisions.
Because of these key differentiators, organizations can leverage Looker's platform to deliver data experiences tailored to the needs of the user. These data experiences range from modern business intelligence and analytics with reports and dashboards to
- integrating insights into user workflows
- creating data-driven workflows with automation
- creating completely new applications that are powered by data
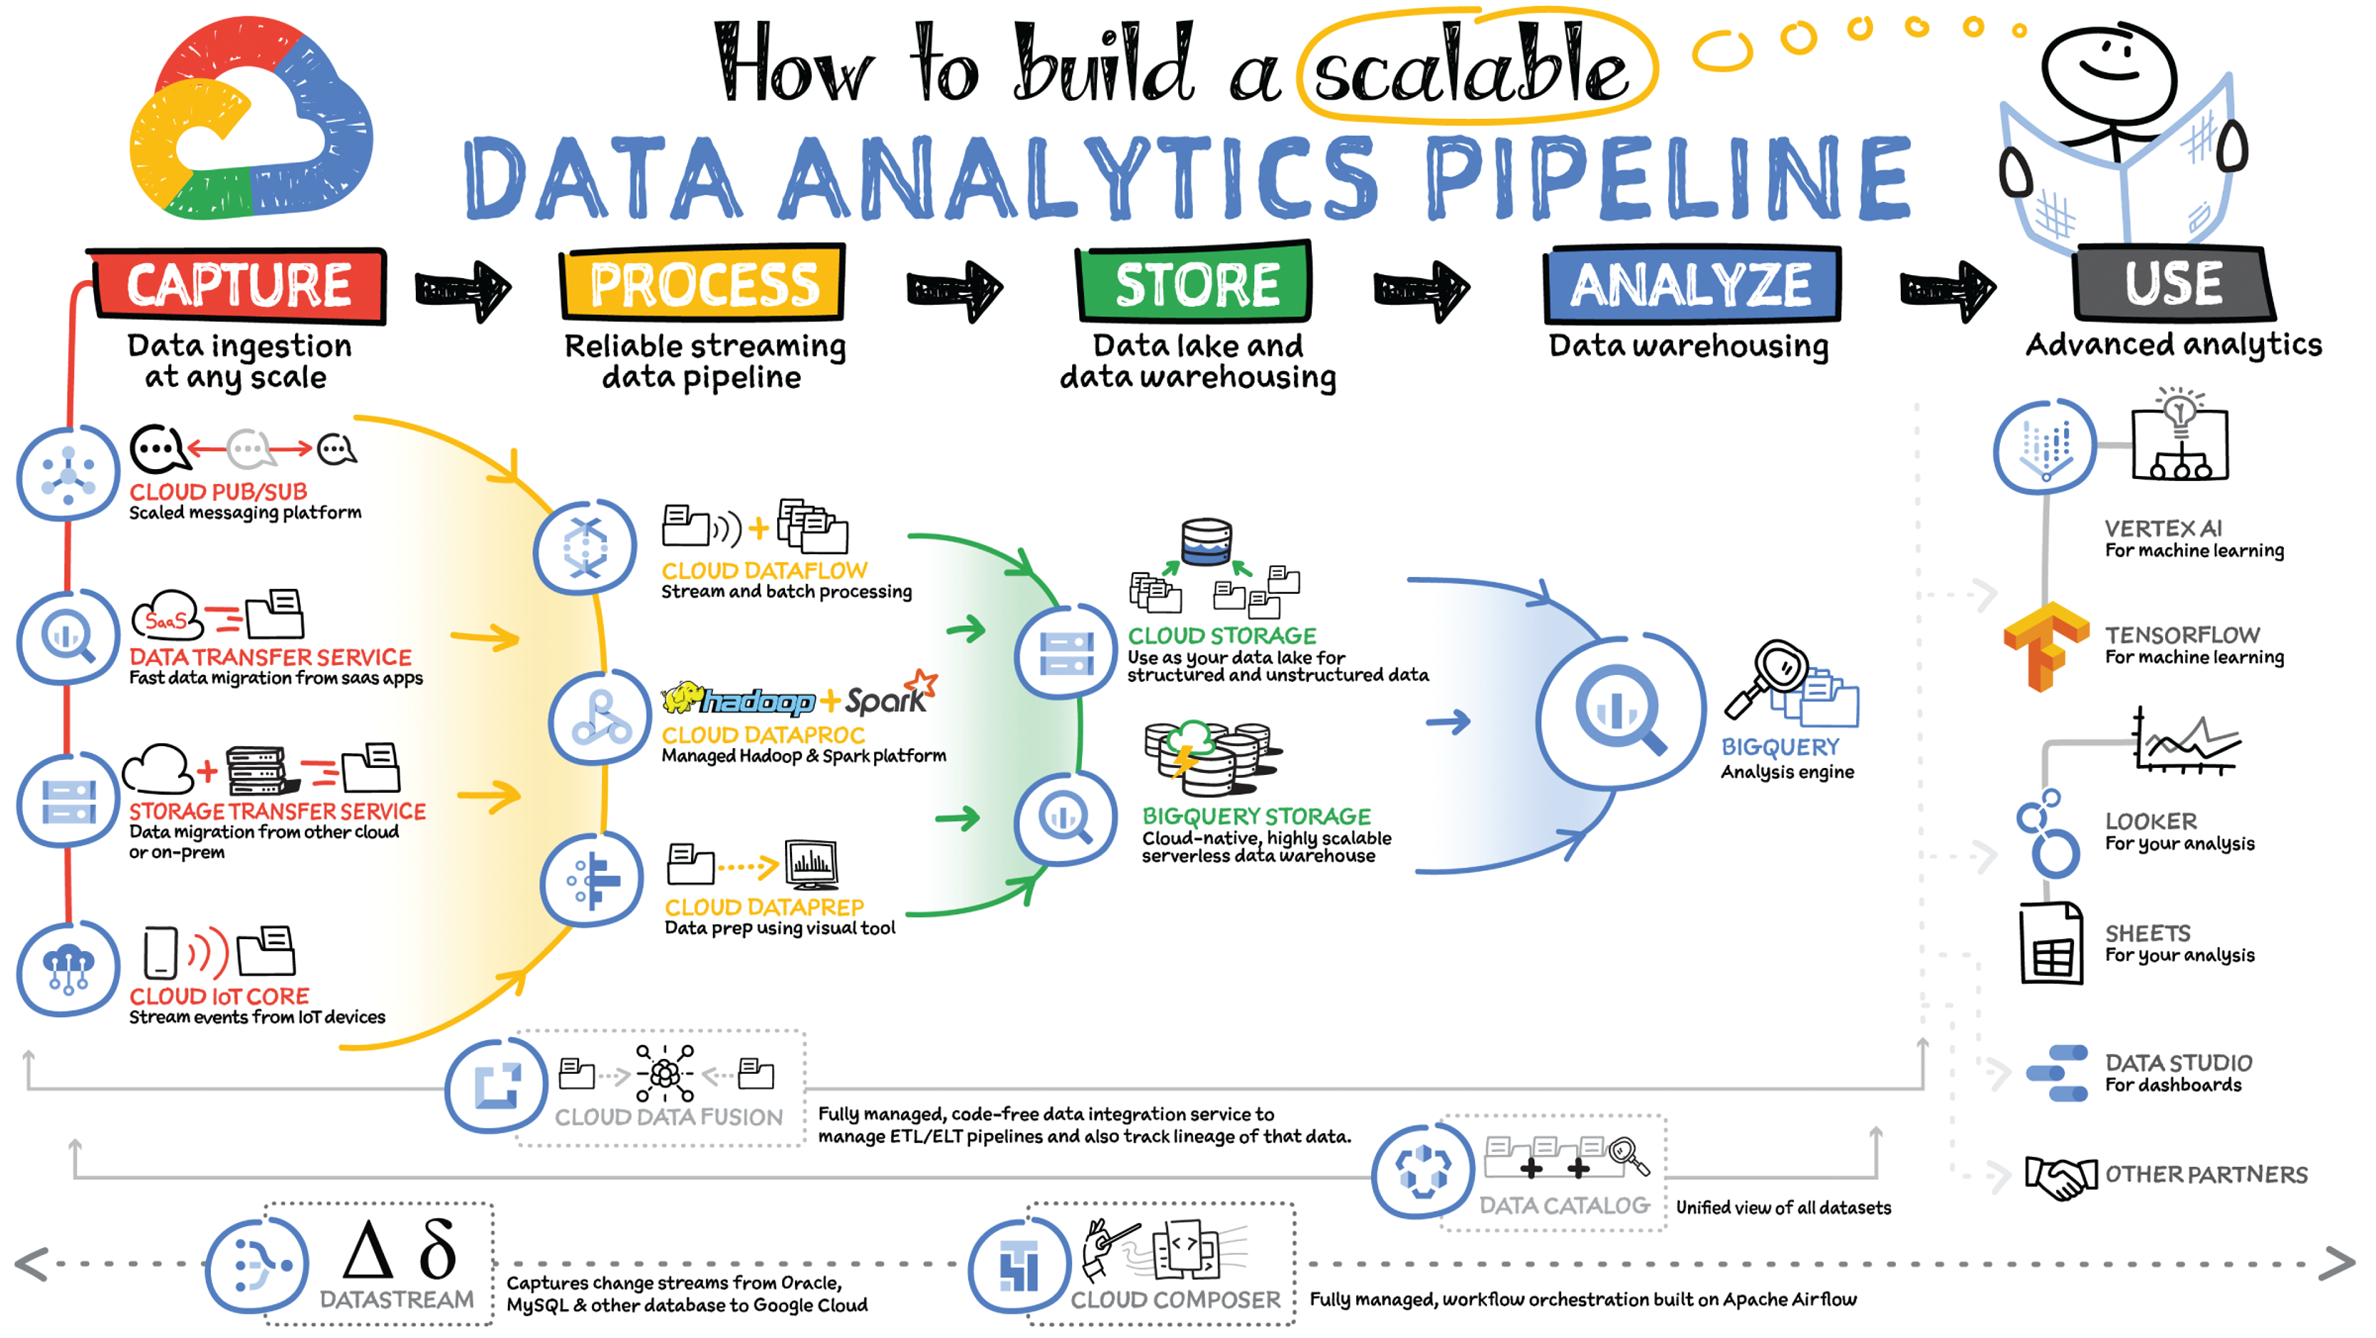
As you saw in the introduction of this chapter, there are roughly five steps to building a data analytics pipeline: capture data, process it, store the resulting enriched data in a data warehouse, analyze it, and finally use it to make meaningful business decisions. Let's see the Google Cloud tools you can use at each step:
Capture
Depending on where your data is coming from, you can have multiple options to ingest them.
Real-time data ingestion:
- You can stream real-time data from applications with Pub/Sub messaging service. You configure a data source to push event messages into Pub/Sub from where a subscriber picks up the message and takes appropriate action on it.
- If you have IoT devices, they can stream real-time data using Cloud IoT Core, which supports the MQTT protocol for the IoT devices. You can also send IoT data to Pub/Sub as events for further processing.
Batch data ingestion:
- There are multiple data migration tools you can use to migrate data from on-premises or from one cloud to another. You can use storage transfer services to transfer data from another cloud or on-premises, and use transfer appliances to transfer large amounts of data from a low-bandwidth or no-Internet location.
- To ingest data from your third-party SaaS services, you can use the BigQuery data transfer service and APIs to store data into BigQuery. You can load data from SaaS applications such as YouTube, Google Ads, Amazon S3, Teradata, RedShift, and more. For more details on these options, check out Chapter 2.
Process
Once the data is ingested, you can process or enrich it in order to make it useful for the downstream systems. There are three main tools that help you do that in Google Cloud:
- Dataproc is a managed Hadoop service. If you use the Hadoop ecosystem, then you know that it can be complicated to set up, involving hours and even days. Dataproc can spin up a cluster in 90 seconds so that you can start analyzing the data quickly.
- Dataprep is an intelligent graphical user interface tool that helps data analysts process data quickly without having to write any code.
- Dataflow is a serverless data processing service for streaming and batch data. It is based on the Apache Beam open source SDK and makes your pipelines portable. The service separates storage from computing, which allows it to scale seamlessly.
Store
Once the data is processed, you have to store it in a data lake or data warehouse for either long-term archival or for reporting and analysis. There are two main tools that help you do that in Google Cloud:
- Cloud Storage is an object store for images, videos, files, and other structured and unstructured data that comes with multiple classes depending on access frequency and use cases — such as standard for high-frequency data access, nearline for lower-cost storage for at least 30 days, coldline for very low cost and at least 90 days storage, and archive for lowest-cost storage for regulatory archives.
- BigQuery is a serverless data warehouse that scales seamlessly to petabytes of data without having to manage or maintain any server. You can store and query data in BigQuery using SQL. Then you can easily share the data and queries with others on your team. It also houses hundreds of free public datasets that you can use in your analysis. And it provides built-in connectors to other services so that data can be easily ingested into it and extracted out of it for visualization or further processing/analysis.
Analyze
Once the data is processed and stored in a data lake or data warehouse, it is ready to be analyzed. If you are using BigQuery to store the data, then you can directly analyze that data in BigQuery using SQL. If you use Cloud Storage to store, then you can easily move the data into BigQuery for analysis. BigQuery also offers machine learning features with BigQueryML, which you can use to create models and predict right from the BigQuery UI using SQL.
Use
Once the data is in the data warehouse, you can visualize the data and use it to gain insights by making predictions using machine learning.
- Machine learning (ML) — For further processing and predictions, you can use the TensorFlow framework and Vertex AI, depending on your needs. TensorFlow is an end-to-end open source ML platform with tools, libraries, and community resources. Vertex AI makes it easy for developers, data scientists, and data engineers to streamline their ML workflows. It includes tools for each stage of the ML life cycle, starting with preparation, moving to build, then validation, and finally deployment.
- Data visualization — There are lots of different tools for data visualization, and most of them have a connector to BigQuery so that you can easily create charts in the tool of your choice. Google Cloud provides a few tools that you might find helpful to consider:
- Data Studio is free and connects not just to BigQuery but also to many other services for easy data visualization.
- If you have used Google Drive, sharing charts and dashboards are exactly like that — extremely easy.
- Looker is an enterprise platform for business intelligence, data applications, and embedded analytics.
Services Spanning the Pipeline
- Data Fusion — Data integration platform powered by open source CDAP, making pipelines portable across hybrid and multicloud
- Data Catalog — Managed metadata management service that helps you quickly discover, understand, and manage all your data in one place
- Composer — Managed workflow orchestration service based on Apache Airflow that lets you author, schedule, and monitor data pipelines
- Datastream — Captures change data streams from Oracle, MySQL, and other sources for destinations such as Cloud Storage, Pub/Sub, BigQuery, Spanner, and more to support use cases such as analytics, database replication, and event-driven architectures.