Chapter 9
“There’s Too Much Uncertainty—and It’s Washington’s Fault”
Our moderator began each roundtable by inviting participants to comment on local economic conditions and recent circumstances for their business. We began our discussions this way both as an easy icebreaker—folks were eager to introduce and talk about their businesses—and because, as mentioned in Chapter 3, we understand that the U.S. economy is not a monolithic whole, but rather an amalgam of many regional and local economies, with certain cities or regions often closely associated with particular industries. For example, Seattle is known for web-based technology and clean energy companies, while Memphis is known for healthcare, bioscience, and medical device companies.1 Starting our discussions by focusing on local conditions helped us get a good read on the area and set the context for what we would hear over the next couple of hours.
While some participants reported steady or even growing business, particularly in the technology space, most reported that conditions—both for the local economy and their business—remained very challenging. As one participant succinctly put it: “There’s just no demand out there.”
That message is, of course, consistent with broader economic indicators. As we discussed in Chapter 1, though the recent recession officially ended in June of 2009, the subsequent recovery has been remarkably weak and fragile. The economy expanded by just 2.4 percent in 2010, 1.8 percent in 2011, and 2.2 percent in 2012. In the fourth quarter of 2012, growth slowed to an annualized rate of just 0.4 percent. An analysis by the Associated Press showed that of the 10 post-recession recoveries of three years or more since World War II, the current recovery is the weakest “by just about any measure.”2 At year-end 2012, economic output was just 7.2 percent larger than it was when the recovery began, compared to double-digit increases during other multi-year recoveries since World War II. Had economic growth remained on trend since 2007, the economy would be more than 12 percent larger than it is today.3 As Neal Soss, chief economist at Credit Suisse, commented to the New York Times: “This is the weakest recovery we’ve ever seen, weaker even than the recovery during the Great Depression. . . If you’re not scared by that, you’re not paying attention.”4
As much as any other factor discussed at our roundtables, the return to anemic growth so soon after the worst economic downturn since the Great Depression jarred and frightened many of our participating entrepreneurs, causing them to second-guess, postpone, or even cancel plans to expand and hire.
“There are a lot of businesses in this area that barely survived the recession and are hanging on by their fingernails,” said Brenda Hall, chief executive of Bridge360, an Austin-based software developer. “If the economy takes another leg down or doesn’t get better soon, there’s going to be a huge second wave of failures as those barely-alive firms are swept away.”
The lack of business, and the uncertainty regarding future business, is the principal obstacle to accelerated hiring, according to many of our roundtable participants.5 “We can’t afford to have another full-time employee, so we’re doing a lot of the work ourselves,” said Elizabeth Barrios, president of Office Wall Solutions in Richmond, Virginia. “It’s one of those vicious circles. We need to get the construction jobs coming in so we can go out and install. If we have the business coming into the company and the money coming in, we can put that into another employee. [But] we’re just not getting the business in.”
“I don’t see a light at the end of the tunnel,” said Suman Saripalli, founder and president of Intellispeak, LLC in Lawrence, Kansas, a research and development venture specializing in the physical sciences and engineering. “I think we have structural problems that are getting more difficult. For example, there are whole classes of jobs that I think will never come back. Classes of jobs that have long been considered the foundations of the middle class. If those jobs are hit and stay deflated, can we really expect any kind of recovery? Another problem is that the housing industry remains down because people don’t have jobs. That’s why they’re not buying, and because they’re not buying other people don’t have jobs. And it just goes round and round.”
“To effectively grow and create jobs, businesses have to think strategically,” said Jerry Ross, Executive Director of the National Entrepreneur Center in Orlando, Florida. “Today, no one is thinking strategically. Everyone is thinking tactically because they have to in order to get through this. So that they’re still around when it’s time to do a strategic plan and think about hiring.”6
A participant in our Austin, Texas, roundtable spoke for many of our entrepreneurs: “I’m about to sign a lease to triple my space because I see growth, but I’m scared. I don’t need another 2008. I’m not normally doom and gloom, but I’m worried.”
And like a dense fog that settles over an area given the right conditions of temperature and humidity, continued economic weakness combined with regulatory burden and complexity, access to capital difficulties, a shortage of qualified talent, and tax complexity have produced a profound uncertainty among many of the entrepreneurs we met.
“There’s a lot of uncertainty and angst out there about the long-term direction and health of the economy,” said Jeff Cornwall, Director of the Center for Entrepreneurship at Belmont University in Nashville, Tennessee. In January, Cornwall was named the Entrepreneurship Educator of the Year by the United States Association of Small Business and Entrepreneurship. “I work with lots of young entrepreneurs and we’re creating a lot of start-ups in our program. These young folks are really thinking about long-term viability and what’s going to sustain them. And quite honestly, many are very pessimist about the next 10 to 20 years—and yet they’re still trying.”
“So much unpredictability is driving decisions,” said Laura Yamanaka, president of teamCFO in Los Angeles. “Our clients are pulling back, sitting on a lot of cash because they don’t know. The patterns aren’t there. They can’t rely on their customers, can’t rely on their vendors, can’t rely on the market, and now we can’t rely on the government.”
And, of course, this psychology of apprehension and hesitation only further reinforces the problem of insufficient demand, as worried business owners postpone spending, investment, expansion, and hiring.
“For us and for most people I talk to, it’s no more business as usual,” said Bob Burns, president of construction management firm RL Burns, Inc. in Orlando, Florida. “We’ve made some pretty good investments in our business in the past—equipment, staff, training, education, and so on. But taking the risk of those investments today is not very wise, and I don’t think many others do it either. It’s very difficult to consider investing money in a future you just can’t see. There’s no way to gauge it or really know what the next year is going to look like. . . So today we’re looking to cut back, get lean, and stay lean. . . We have absolutely no plans to upgrade our equipment or purchase new computers. They’re going to hang around until they blow up. Any kind of long-term investment is off the table.”
Bobbie Kilberg, president and chief executive officer of the Northern Virginia Technology Council in Herndon, Virginia, pointed out an additional source of uncertainty facing businesses in the greater Washington, DC, area: “Many of our members, a lot of whom are small companies, are federal contractors or subcontractors. The inevitable [government] cutbacks are simply going to have to come in defense as well as civilian agencies, given the budget situation. And that will hit particularly hard on small businesses. Those businesses don’t have the ability to put people on the sidelines and wait for those contracts to come back along.”
Travis McCready, former Executive Director of the Kendall Square Association in Cambridge, Massachusetts highlighted a similar problem: “There is great uncertainty about what the federal government will do regarding R&D dollars. If you look back at the history of Kendall Square, MIT, and how some of our best companies have been built over the years, many of them have their roots in R&D dollars from some aspect of the federal government. We have no certainty now, no predictability about federal research dollars. And that’s going to be an issue going forward.”
Rodney Hughes, Managing Partner of Orlando-based South Star Distribution Services, which designs and installs energy reducing roofing materials, explained how protracted economic weakness and uncertainty has changed the way businesses make decisions, including hiring. “Rather than making longer-term decisions about investing in their business and hiring and training people based on trends and what they see coming from farther down the road, now it’s job to job. We hire people as independent contractors based on the jobs we get, rather than hiring full time.”
Perhaps the most fascinating aspect of the problem of too little economic dynamism and too much uncertainty was what, or rather who, the vast majority of our entrepreneurs blame for such debilitating circumstances. While a range of factors were cited as contributing to the halting recovery—the still struggling housing market, continued deleveraging by the American consumer, political turmoil and recession in Europe—most of our participants insistently and even angrily blamed the sluggish U.S. economy on what they perceive as poor leadership, dysfunction, and outright incompetence in Washington, DC. Many cited policymakers’ inexplicable inability or unwillingness to address problems they see as threatening the future of the nation itself, most notably federal budget deficits and the national debt. Others railed against policymakers’ apparent ignorance regarding the needs and priorities of business.
“I could have all the tax credits in the world,” said Craig Sonksen, owner of Krema Natural Peanut Butter and Crazy Richard’s Natural Peanut Butter brands in Dublin, Ohio, “but if I don’t have more business, I’m not going to hire a soul. I cashed my Bush check happily a number of years ago, and I get a payroll tax break now from Obama. But here’s my personal soapbox—quit gerrymandering the economy. How about we get back to some basic free-market capitalism? Stop trying to use this lever and that lever. If they just left us alone to do what we do best, we’d all be much better off.”
Jamie Rhodes, chief executive officer of National NanoMaterials, Inc. in Austin, Texas, and vice chairman of the Angel Capital Association, agreed. “The people in power in Washington not only don’t understand business, they don’t have a clue. When we go to war, I want the generals up there leading. And when the war is kick-starting the economy, I want the people who run businesses, not the career politicians, to be the leaders. Someone who understands business, who understands how to rebuild a healthy middle class—that’s who I want leading. Especially right now when we’re in this economic crisis.”
Still others were more cynical, dismissing policymakers as hopelessly conflicted and, therefore, incapable of making decisions in the best interest of the country. “The politicians are largely ignorant and make decisions based on short-term political considerations,” lamented Laura Yamanaka of teamCFO in Los Angeles. “Or they know the consequences of their decisions, but just don’t seem to care.”
As context, it should be remembered that our roundtables took place over the summer of 2011, with most occurring as Congressional Republicans and the White House were negotiating a deal to raise the nation’s debt ceiling.7 Negotiations became increasingly intense, and as the days ticked down to the deadline of August 2, the date the Treasury Department said it would likely run out of money, the unthinkable—that the United States might default on its national debt—became all too imaginable. Finally, on July 31, President Obama and Speaker of the House John Boehner announced that an agreement had been reached. President Obama signed the Budget Control Act of 2011 into law on August 2.
Four days later, on August 6, Standard & Poor’s downgraded the credit rating of the U.S. government for the first time in our nation’s history. In a press release, S&P stated:
The downgrade reflects our opinion that the fiscal consolidation plan that Congress and the Administration recently agreed to falls short of what, in our view, would be necessary to stabilize the government’s medium-term debt dynamics. More broadly, the downgrade reflects our view that the effectiveness, stability, and predictability of American policymaking and political institutions have weakened at a time of ongoing fiscal and economic challenges to a degree more than we envisioned when we assigned a negative outlook to the rating on April 18, 2011. Since then, we have changed our view of the difficulties in bridging the gulf between the political parties over fiscal policy, which makes us pessimistic about the capacity of Congress and the Administration to be able to leverage their agreement this week into a broader fiscal consolidation plan that stabilizes the government’s debt dynamics any time soon.
Following S&P’s downgrade, markets around the world experienced their most volatile week since the 2008 financial crisis, with the Dow Jones Industrial Average plunging 635 points on August 8.
![]()
In expressing pessimism regarding the ability of Congress and the Administration to work together constructively to address the nation’s fiscal challenges, S&P proved prescient. The Budget Control Act of 2011, which resolved the 2011 debt-ceiling crisis, cut more than $900 billion in discretionary spending over 10 years and created a Joint Select Committee on Deficit Reduction, commonly referred to as the “Supercommittee,” to produce bipartisan legislation by November of 2011 to reduce the deficit by an additional $1.2 trillion over 10 years. If the Committee failed to achieve that objective, the Act required deep across-the-board spending cuts—referred to as “sequestration”—split evenly between defense and nondefense spending. The cuts were to total $110 billion per year, or $1.2 trillion over 10 years.
Sequestration was intended to be so unthinkable given the fragility of the economic recovery, and therefore so painful politically, that it would force members of the Supercommittee to make the hard choices necessary to reach a bipartisan agreement.
But in the end, the Supercommittee, perhaps predictably, failed to reach agreement, triggering sequestration to begin on January 2, 2013. That timing happened to coincide with the expiration of legislation8 that had extended for two years tax cuts from 2001 and 2003, commonly referred to as the “Bush tax cuts.”9 Expiration of all the relevant tax cuts was estimated to amount to an aggregate tax increase of about $400 billion.10 The Tax Policy Center estimated that 80 percent of American households would experience some form of increase, with the average household facing a tax increase of about $3,700.
The coincident timing of the sequestration spending cuts and expiring tax cuts became known as the “fiscal cliff,” a term first used by Federal Reserve Chairman Ben Bernanke.11 According to the Congressional Budget Office (CBO), the total fiscal impact of the cliff would be about $500 billion annually, or about 4 percent of GDP. The CBO also estimated that the spending cuts and additional tax revenue would reduce the federal budget deficit from more than $1 trillion in 2012 to about $640 billion in 2013—and by as much as $7 trillion over the next 10 years, reducing the federal debt-to-GDP ratio to 58 percent in 2023, compared to 90 percent without the cliff. But the CBO also predicted that the fiscal contraction would push the United States back into recession, with the economy likely to contract by 3 percent in the first half of 2013, eliminating some 2 million jobs and raising the already elevated unemployment rate to more than 9 percent.
Business and consumer anxiety provoked by the threat of the cliff likely worsened economic conditions far in advance of the year-end deadline. In July of 2012, CBO Director Doug Elmendorf warned reporters that uncertainty caused by the cliff could reduce economic growth by 0.5 percent. “We think it’s an issue now, and it will be increasingly an issue in the second half of the year for people’s decisions.”12
A report released in October of 2012 by the National Association of Manufacturers concluded that business anxiety in the months approaching the year-end cliff had in fact cost 0.5 percentage points in economic growth in 2012—and as many as 1 million jobs.13 As mentioned in the previous chapter, a survey of more than 900 chief executives of small businesses conducted by the Wall Street Journal in December of 2012 found that, due to anticipated tax increases associated with the fiscal cliff negotiations, 30 percent of respondents indicated they planned to hire fewer workers, while another 32 percent planned to reduce capital and equipment spending.14 In the weeks leading up to the year-end cliff, surveys of consumer and business confidence plunged.15
Following month-long negotiations between the Administration and Congress, a deal was finally reached to avoid the cliff just three hours before the midnight December 31, 2012, deadline.16 President Obama signed the American Taxpayer Relief Act on January 3, 2013. The Act raised tax rates on personal income above $400,000 for individuals and $450,000 for couples from 35 percent to 39.6 percent. According to CBO Director Elmendorf, the higher rates mean 750,000 fewer new jobs in 2013.17 The Act also postponed—until March 1—the deep spending cuts known as sequestration.
March 1st arrived with no further agreement on taxes and spending. And so what was intended to never happen, indeed what was designed to be unthinkable both economically and politically, actually happened. Sequestration, the indiscriminate, across-the-board cuts in government spending, totaling $1.2 trillion over 10 years, went into effect.18 In the weeks and months that followed, furlough notices for thousands of government workers and contractors were issued, a third of the nation’s air traffic control towers were closed, national parks made plans for reduced public access and security during the coming summer, and even public tours of the White House were suspended. In announcing the failure of negotiations to avoid sequestration, President Obama said:
Washington sure isn’t making it easy. At a time when our businesses have finally begun to get some traction—hiring new workers, bringing jobs back to America—we shouldn’t be making a series of dumb, arbitrary cuts to things that businesses depend on and workers depend on, like education, and research, and infrastructure and defense. It’s unnecessary. And at a time when too many Americans are still looking for work, it’s inexcusable. . . This is not a win for anybody. This is a loss for the American people.
According to the CBO, sequestration will shave 0.6 percentage points off economic growth in 2013 and eliminate another 750,000 jobs.19 Other estimates project job losses as high as 1.9 million by year-end 2014.20 Looking ahead, the nation will hit the recently raised debt ceiling sometime in late 2013, raising the specter of yet another dangerous partisan showdown.21
![]()
Reading the previous section—which summarizes what has happened in Washington regarding debt and taxes since our roundtables—one can understand the frustration, exasperation, and even anger expressed by so many of our entrepreneurs.
“We’re on the verge of becoming a third world country,” declared a participant in our Herndon, Virginia, roundtable. “The politicians are playing Russian roulette and they don’t have any damn idea who’s holding the gun. I try to be optimistic about America, but right now I think they’re going to plunge us into the biggest unknown this country has ever seen—and I’m including in that the Civil War. . . The debt ceiling is just a symptom of the disease, which is that we’re spending far more than we bring in. Fix the problem! Do something!”
“Small business owners need customers feeling confident about the economy to start spending their money,” said Clay Banks, director of Economic Development at the Chamber of Commerce in Bartlett, Tennessee, outside Memphis. “When we talk about the fact that we’re already borrowing 50 cents of every dollar we spend, and now we’re talking about borrowing even more, that money has to come from somewhere. It’s coming out of the pockets of consumers that entrepreneurs need out there spending money.”
Patrick Flynn, president of Flynn Construction in Austin, Texas, agreed. “I talked to a buddy of mine last night who has a plant here in Austin—100,000 square feet. He’s a good-sized manufacturer. He said ‘I’ve got a million dollars to invest in equipment right now but, hell, I’m not going to do it. So I’m shedding jobs instead.’ It’s the uncertainty, the lack of stability and consistency. . . This isn’t high school politics. We’ve got to get on with it! We have to lead! We need Washington to lead because you’ve got 315 million people in this country that are scared to death about what’s going to happen tomorrow.”
The National Federation of Independent Business (NFIB) polls its members monthly regarding business conditions, expectations, and confidence. In its January 2013 poll, the first following the fiscal cliff threat, the survey revealed expectations regarding business conditions six months forward to be at their fourth lowest level since the NFIB began its survey 40 years ago. In a press release, NFIB chief economist Bill Dunkelberg stated:
If small businesses were publicly traded companies, the stock market would be in shambles. . . Owner pessimism is certainly not surprising in light of higher taxes, rising health care costs, increasing regulations, and just plain uncertainty.”22
Our roundtable participants’ expressions of acute uncertainty, and the impact of that uncertainty on their ability to expand their businesses and create jobs, are consistent with recent work done by economists Scott Baker and Nicholas Bloom of Stanford University and Steven Davis at the University of Chicago.23 The trio has constructed an index of “policy uncertainty” and analyzed the relationship of the index relative to previous levels of economic output, investment, and employment.24
As Figure 9.1 shows, their index reached its historic high in August of 2011—higher than following the terror attacks of September 11, 2001, or the bankruptcy of Lehman Brothers in September of 2008—due principally to the protracted U.S. debt ceiling negotiations. The index spiked again in the weeks approaching the fiscal cliff. As the economists explained in a Bloomberg editorial:
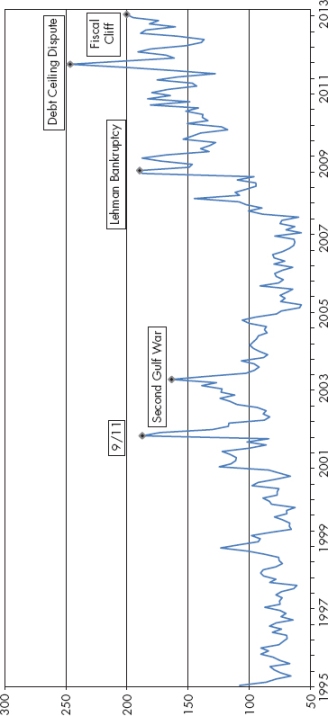
When businesses are uncertain about taxes, healthcare costs, and regulatory initiatives, they adopt a cautious stance. Because it is costly to make a hiring or investment mistake, many companies will wait for calmer times to expand. If too many businesses wait, the recovery never takes off.
Astonishingly, Baker, Bloom, and Davis estimate that if policy uncertainty were restored to 2006 levels, U.S. businesses would create 2.5 million new jobs within 18 months!25 A similar analysis recently conducted by economists at the Vanguard Group concluded that policy uncertainty since 2011 has created a $261 billion “uncertainty tax” on the economy, without which economic growth would have been 3 percent rather than 2 percent, and more than 1 million additional jobs would have been created.26
The paralyzing effect of economic uncertainty is not unique to new and small businesses. On October 25, 2012, the chief executives of more than 80 large corporations issued a statement urging policymakers to avoid the fiscal cliff and reduce the federal budget deficit.27
Policymakers should acknowledge that our growing debt is a serious threat to the economic well-being and security of the United States. It is urgent and essential that we put in place a plan to fix America’s debt. An effective plan must stabilize the debt as a share of the economy, and put it on a downward path. This plan should be enacted now, but implemented gradually to protect the fragile economic recovery and to give Americans time to prepare.
At a CEO Council event sponsored by the Wall Street Journal in November of 2012, nearly three-quarters of the chief executives attending listed the approaching fiscal cliff as the their biggest worry—above continuing political and financial turmoil in Europe, slowing economic growth in China, and conflict in the Middle East.28
Another letter, signed by the chief executives of 160 corporations, was released by the Business Roundtable on December 11, 2012.29 The previous quarter, the Roundtable’s CEO Economic Outlook survey had plunged to its lowest level since the third quarter of 2009, immediately following the end of the Great Recession.30 Jim McNerney, chief executive of Boeing and chairman of the Roundtable told the Financial Times: “The continued inaction in Washington is holding up much-needed tax, fiscal, entitlement, and regulatory reforms that would provide certainty for business, reassure markets, and enhance U.S. economic growth.”31
According to the Federal Reserve, U.S. corporations have $1.8 trillion in cash and liquid securities parked unproductively on their balance sheets. In early February of 2013, prominent hedge fund investor David Einhorn sued Apple to force the company to return some of its $137 billion in cash—an amount larger than Intel’s entire market value—to investors.32 While economists disagree about the precise nature, motivations, and implications of such cash stockpiling,33 there is broad consensus that continued economic uncertainty looms large in the minds of corporate leaders.
A recent analysis by the University of Massachusetts concluded that if corporations channeled their “excess liquid asset hoards” into productive investments, approximately 19 million new jobs would be created, pushing the unemployment rate below 5 percent.34
But as debilitating as Washington-produced uncertainty clearly is for small businesses and larger corporations, start-ups are particularly vulnerable. As we have discussed, new businesses, given their inherent fragility and limited resources, are disproportionately impacted by burdensome regulations and tax complexity. No doubt Washington-created economic uncertainty inflicts a similarly disproportionate blow.
“Where’s the leadership?” asked an exasperated Mark Luden, chief executive of the Guitammer Company in Westerville, Ohio. “It’s the uncertainty out there. When people are uncertain, those with capital sit on their hands. Those who are trying to sell decide to wait. And buyers who are able to wait just wait. It’s the uncertainty that’s killing us. And, yeah, I hear President Obama and people in Congress talk about how innovation is the driver of growth and job creation, but where’s the follow-up? My response to uncertainty is ‘Where’s the leadership?’ Until someone leads and gets rid of some of the uncertainty out there, you’re going to have problems getting people to buy and invest. If you’re a big company like Walmart, you can wait it out. But if you’re new and small, all of this makes it harder to stay afloat.”
Policy Recommendations
The following recommendations are not specifically targeted at start-ups—except that they have everything to do with enhancing the prospects for start-ups in that they are intended to minimize Washington-produced policy uncertainty and to significantly accelerate economic growth, from which businesses of all types, sizes, and ages benefit.
The first two recommendations are rather obvious, and yet sometimes—particularly in Washington, DC—it’s important to have a firm grasp on the obvious.
Gradually But Significantly Reduce the Federal Budget Deficit and National Debt
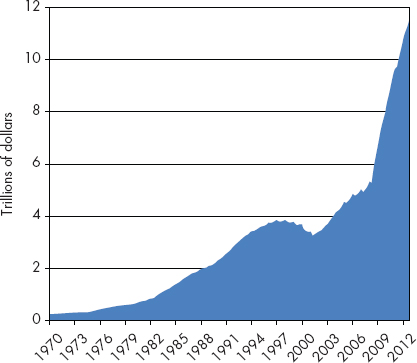
As recently as 2007, U.S. publicly held debt amounted to just 36 percent of GDP. As shown in Figure 9.2, however, since 2007 the nation’s debt has increased by 125 percent. According to the CBO, federal debt will exceed 76 percent of GDP in 2013, and chronic deficits could push debt levels to 87 percent of GDP within 10 years and 200 percent of GDP with in 25 years.35
Over the course of repeated collaborations, including their widely noted 2009 book This Time Is Different and a 2010 paper entitled “Growth in a Time of Debt,” economists Carmen Reinhart and Kenneth Rogoff have argued that high levels of government debt tend to impede countries’ economic growth, weaken their ability to respond to unexpected challenges, and leave them more vulnerable to financial crisis.36 Drawing on public debt data encompassing 44 countries and spanning two centuries, Reinhart and Rogoff contend that government debt levels of 90 percent of GDP or higher are associated with lower median annual growth of 1 percent. High debt levels undermine economic growth by putting upward pressure on interest rates and inflation, and by crowding out private investment.37 Higher debt may also undermine growth by influencing businesses’ expectations with regard to taxes. Indeed, numerous participants in our roundtables made clear that they view high government debt levels as deferred taxes that will have to be paid at some point. Recent studies by the Bank for International Settlements and the International Monetary Fund have also concluded that similarly high levels of debt have a “significant” and negative impact on economic growth.38
Slower growth by an average of 1 percent per year is no small matter over an extended period. Consider the following.
According to CBO’s baseline economic forecast, GDP is projected to grow to $26 trillion in 2023. That same year, according to CBO’s alternative fiscal scenario, U.S. publicly held debt could reach 90 percent of GDP. If the economy grew by an average annual rate of 3 percent over the next 25 years, by 2048 GDP would have expanded to $54 trillion. If, however, the economy grew at an average annual rate of just 2 percent—one percentage point less each year—GDP would grow to $42 trillion by 2048, or $12 trillion less than otherwise. In other words, just one percentage point less in average annual growth would cost America more than 20 percent of projected GDP over 25 years.
It should be noted that Reinhart and Rogoff’s thesis came under intense scrutiny last spring following the revelation of an apparent error in their data by Thomas Herndon, a graduate student in the economics department at the University of Massachusetts Amherst.39 While conceding “a spreadsheet coding error,” Reinhart and Rogoff have vigorously defended their work, arguing that the conclusions of Herndon and his two colleagues “are less dramatic than they would have you believe” and “do not overturn [our] fundamental finding.”40
Beyond the academic debate, a review of the actual relevant figures reveals the extent of American’s debt dilemma Over the past 20 years, federal spending has nearly doubled, increasing 71 percent faster than inflation.41 Spending in fiscal year 2012 reached $3.7 trillion, or 22.8 percent of GDP, significantly above the 40-year average of 21 percent. In 2012, the U.S. spent more than $1 trillion more than it collected in tax revenues, for the fourth year in a row. Spending is projected to increase to $5.5 trillion within 10 years and reach 36 percent of GDP within 25 years.42
Principally responsible for increased federal spending are America’s entitlement programs. Less than half of federal spending 20 years ago, entitlements accounted for 62 percent of federal spending in 2012. The three major entitlement programs—Medicare, Medicaid, and Social Security—accounted for 44 percent of all federal spending. With expenditures of $773 billion in 2012, Social Security is the largest entitlement, larger than Medicare ($478 billion) and Medicaid ($255 billion) combined. Medicare is the fastest growing entitlement program, expanding by 68 percent since 2002, while Social Security and Medicaid grew by 37 percent.43 Spending on these largest entitlements alone is projected to increase from 10.4 percent of GDP in 2012 to 18.2 percent in 2048. Such levels of spending would consume all federal tax revenues, implying that all other government operations—national defense, transportation, education and training, federal law enforcement, and veterans’ benefits—would have to be financed through additional borrowing.
As sobering as such figures are, they’re not the whole story. Looking out over the next 75 years, the federal government has promised entitlement benefits, as yet unfunded, of an estimated $87 trillion—more than five times current GDP.44
Clearly, current trends are unsustainable. If America is to avoid national bankruptcy, and if the U.S. economy is to grow at rates necessary to create millions of new jobs and generate the tax revenue necessary to pay down the nation’s accumulated debt, the rate of government spending must be significantly reduced.
Importantly, the pacing of that needed reduction in spending can and, in our view, should be gradual. As we’ve already noted, the current economic recovery is the weakest post-recession recovery since World War II and remains fragile. Jeopardizing the recovery with sharp and sudden reductions in government spending is not only ill-advised but self-defeating, as even slower growth or a return to recession would reduce tax receipts and lead to even higher levels of debt. Nevertheless, a credible framework for accomplishing meaningful long-term reduction of the nation’s debt is essential if economic growth and job creation are to accelerate.
How can that be achieved?
It’s clear to us that U.S. policymakers must come to terms with a simple reality pointed out by one of America’s most notorious criminals, Willie Sutton. Asked by FBI agents after his capture in 1934 why he robbed banks, Sutton is said to have responded: “That’s where the money is.”
Entitlements are where the money is. No doubt spending can be reduced in other areas of the budget, and sequestration, while hardly an ideal approach, has already begun that process. Moreover, comprehensive reform of the nation’s immensely complex and grossly inefficient tax code would likely produce additional tax revenue (see the next section).
But current debt levels and the government’s future promises have far outstripped the capacity of additional tax revenues to make any meaningful difference. Chris Cox, former chairman of the Securities and Exchange Commission, and Bill Archer, former chairman of the tax-writing House Ways and Means Committee, have pointed out that the combined annual earnings of U.S. households and corporations amount to about $7 trillion per year, while the annual accrued expenses—taking into account current and future spending—of America’s entitlement programs totals over $8 trillion. In other words, even if the government confiscated the entire gross income of all American households and corporations, it wouldn’t be enough to meet accrual basis government spending for a single year.45
America’s runaway entitlement spending is nothing less than a clear and present danger to America’s economic viability—and even to our national security.
In August of 2010, Admiral Michael Mullen, Chairman of the Joint Chiefs of Staff, told CNN: “The most significant threat to our national security is our debt . . . the strength and the support and the resources that our military uses are directly related to the health of our economy.”46 In December of 2012, Mullen, now retired, announced the formation of the Coalition for Fiscal and National Security, the purpose of which is to urge Washington policymakers to lay the foundation for long-term deficit reduction—including new revenue, entitlement reform, and further cuts to nonentitlement spending, including defense. Other members of the coalition include former Secretaries of State Henry Kissinger, George Schultz, James Baker, and Madeleine Albright, as well as former Senators John Warner and Sam Nunn.47
Recent academic research suggests that gradual but substantial reductions in government spending promote economic growth because expectations on the part of businesses of lower future debt and taxes, and therefore higher incomes, encourages private spending and investment.48
The sooner policymakers act, the less severe the required steps need to be and the more gradually they can be implemented.
Enact Comprehensive Competitiveness-Enhancing Tax Reform
The most significant overhaul of the U.S. tax code was signed into law by President Ronald Reagan on October 22, 1986. In the years prior, the tax code had become a monstrosity of complexity, inefficiency, and unfairness, characterized by high individual and corporate tax rates and countless deductions, exemptions, and shelters. In short, the U.S. tax code was a mess and an impediment to economic growth. The basic reform idea was simple: lower rates and broaden the base by eliminating complexity and loopholes.49 The Act and the tax clarity it delivered helped revitalize the U.S. economy and laid the foundation for one of the longest periods of economic expansion in American history.
But, for democratically elected policymakers, the temptation to use the tax code to reward special causes and constituencies is a powerful one. Efforts to undo the historic progress achieved by the Tax Reform Act began almost immediately. As the Wall Street Journal observed on October 23, 1986:
Yesterday, shortly after 11 A.M., Ronald Reagan signed HR 3838, the landmark tax-reform bill of 1986. The battle to get tax reform is over; the battle to keep it is just beginning. Mr. Reagan recognized this in his statement at the signing ceremony, pledging to stop rate increases, and laying out a remarkably thoughtful explanation of the principles behind the movement to cut tax rates. Enjoy it while you can. Congress will be back on January 6, and the movement to take away tax reform will start.
In the years since, Congress has passed nearly 15,000 changes to the tax code and many of the loopholes, deductions, special credits, and expenditures are back.50 Certain tax breaks are referred to as “expenditures” because they reduce tax revenue and subsidize certain activities—like homeownership—just as government spending programs do. According to the Joint Committee on Taxation, the lost revenue associated with just the top 10 tax expenditures totaled $576 billion in 2010.51
Higher marginal rates are also back. The Tax Reform Act of 1986 reduced the rate on ordinary income from 50 percent to 28 percent. The American Taxpayer Relief Act of 2012, signed by President Obama to avoid the fiscal cliff, raised rates on personal income above $400,000 for individuals and $450,000 for couples from 35 percent to 39.6 percent.
Once again, the U.S. tax code has become a monstrosity of complexity, inefficiency, and unfairness, and an impediment to economic growth and job creation. Another overhaul is long overdue.
Modernization of the tax code is also badly needed because the U.S. economy and the world have changed dramatically since Reagan signed the Tax Reform Act. In 1986, a young company called Microsoft had just gone public; Steve Jobs had just been fired from Apple; there was no Internet; and Amazon, Google, Yahoo!, and Facebook were far on the horizon. The U.S. and global economies have been transformed since 1986 by rapid advancements in computing and telecommunications technology, and by the resulting forces of globalization. Cross-border foreign direct investment among all countries has expanded from less than 6 percent of the world’s GDP in 1980 to 33 percent by 2009.52 The global economy of 2013 is more integrated and competitive than could have been imagined in 1986.
This final observation is of crucial importance because the U.S. corporate tax rate, at 35 percent, is the highest in the developed world. Including state and local taxes, the top corporate tax rate is 39.2 percent, nearly 14 percentage points higher than the average of the 33 other members of the Organisation for Economic Cooperation and Development (OECD). Over the past 20 years, every member of the OECD has significantly reduced its corporate tax rate, except the United States. Indeed, the United Kingdom plans to further reduce its corporate tax rate in 2014, from 28 percent to 23 percent.53 Even after adjusting for various deductions, credits, and expenditures, America’s average effective corporate tax rate, at 27.7 percent, significantly exceeds the average of the world’s 58 largest nations (19.5 percent), OECD nations (22.6 percent), and non-OECD nations (16.5 percent).54
The dubious distinction of imposing the highest corporate tax rate in the world not only undermines the competitiveness of U.S. corporations in an ever-more competitive global economy, it undermines the attractiveness of the United States as a place for multinational companies to locate and invest. In 1960, 17 of the world’s 20 largest companies were headquartered in the United States. By 1985, the number had fallen to 13, and by 2010 only six of the world’s 20 largest companies were headquartered in the United States.55
It should also be pointed out that American workers bear an enormous share of the burden of high corporate tax rates. According to the CBO, workers bear about 70 percent of the burden of high corporate tax rates, principally through reductions in corporate investment, which lowers productivity and wages.56 Other research has also found that high corporate tax rates contribute to lower wages by raising the cost of investment capital.57 Additional research has concluded that high corporate tax rates have a “large adverse impact on aggregate investment, foreign direct investment, and entrepreneurial activity.”58 President Obama’s Jobs Council has called the U.S. corporate tax system “an outdated and extremely inefficient system that creates economic distortions and puts U.S. businesses and workers at a disadvantage.”59
One particularly bizarre and counterproductive aspect of the current corporate tax code is that it powerfully incentivizes U.S. businesses to keep foreign profits overseas. The United States is the only major industrial nation that applies income tax to the worldwide earnings of U.S.-based corporations. Most other nations maintain a “territorial” framework whereby taxes are paid only to the government of the country in which the profits are earned. Indeed, 27 of the 34 OECD countries have territorial tax systems. Moreover, of the seven nations that still maintain a worldwide tax system, the United States maintains the highest corporate tax rate by far.
The U.S. government does provide a foreign tax credit up to the amount of taxes U.S. companies pay to foreign governments. Most importantly, income earned overseas is taxed only if it is transferred back to the United States. As long as foreign-earned profits remain abroad, taxes are indefinitely deferred. The U.S. system of assessing taxes on income earned anywhere in the world, together with the deferral of taxation until earnings are repatriated, creates a powerful incentive for U.S.-based corporations to keep their foreign earnings overseas and reinvest them anywhere but back in the United States.
It has been estimated that U.S. corporations currently hold as much as $1.7 trillion overseas and could add as much as $300 billion annually in coming years.60 Moody’s has noted that the practice is particularly common in the technology sector. Recent research indicates that industry sectors that depend on high rates of innovation and, therefore, continuous research and development are particularly sensitive to repatriation taxes.61 The tech sector doubled its overseas holdings between 2006 and 2011 and, according to Moody’s, could double it again by 2014. If that happened, technology companies would hold nearly 80 percent of their cash overseas.62 Microsoft reportedly holds almost 90 percent of its cash and short-term investment overseas.63
Current tax treatment, therefore, encourages many of America’s high growth companies to invest outside the United States. Even worse, a recent survey of senior tax officers at more than 400 U.S. corporations found that 20 percent have invested foreign earnings in assets with a lower rate of return than U.S.-based options, while 44 percent reported that they had actually borrowed money to finance dividend payments, share repurchases, debt payments, and pension contributions while keeping tens of billions of dollars parked unproductively overseas.64
It should be emphasized that overseas investment by U.S. corporations should not be discouraged or penalized. U.S. companies earn a large and growing share of their total earnings overseas as foreign markets continue to grow, particularly in rapidly growing emerging market nations. Overseas operations generate higher earnings, create additional value for shareholders, and promote economic growth and job creation back home (see trade-related recommendation later in the chapter). But the global allocation of companies’ resources should not be artificially driven by powerful and illogical tax-related incentives.
The current worldwide taxation framework misallocates resources, distorts companies’ balance sheets and financing practices, undermines shareholders’ access to significant value, and creates opportunities for earnings management and other accounting abuses.65 More fundamentally, large foreign earnings held abroad represent an enormous loss for the U.S. economy. Economist Douglas Holtz-Eakin has estimated that the repatriation of overseas corporate profits would increase GDP by approximately $360 billion annually and help create nearly 3 million new jobs.66
With all this in mind, we join many others in urging comprehensive competitiveness-enhancing tax reform. As in 1986, the goal should be a simpler and more fair tax code, with lower rates and a broader base achieved by eliminating as many loopholes and expenditures as possible. According to the Joint Committee on Taxation, there were nearly 200 individual income tax expenditures in 2010 totaling nearly $1 trillion in lost revenue—an astonishing number, especially considering that $2.2 trillion in individual income tax revenue was collected that year. If the number of expenditures was reduced or even significantly curtailed—especially by limiting the top few—statutory rates could be dramatically reduced without a reduction in net revenue.
“Tax reform right now has one fundamental thing in common with 1986,” Ed Kleinbard, former chief of staff of the Joint Committee on Taxation, told Politico recently. “That is the country is drowning in tax expenditures.”67
In our view, tax reform should also include a shift to a territorial framework, whereby the foreign earnings of U.S.-based companies would not be subject to U.S. taxation. Such a provision, as part of a simpler, flatter, and lower-rate tax structure would dramatically enhance U.S. international competiveness, promote investment in America by U.S. corporations, attract greater foreign investment, and, thereby, promote economic growth and job creation.
Increase the Research and Development Tax Credit—and Make It Permanent
It has long been understood that innovation is the force principally responsible for driving economic progress. Austrian-American economist Joseph Schumpeter pioneered the connection between innovation and economic development, defining innovation as “doing things differently in the realm of economic life”68 and characterizing innovation’s role in driving economic progress as “a perennial gale of creative destruction.”69 Later, economist Robert Solow demonstrated that more than half of economic growth cannot be attributed to increases in capital and labor, as most economists had previously theorized, but only to technological innovation.70 For his work, Solow won the Nobel Prize in 1987.
Innovation propels economic progress by raising productivity—the average value of output produced by each worker. As workers become more productive, salaries and living standards rise, demand increases, the economy expands, and more jobs are created to meet the appetite of a wealthier population.71 As 2008 Nobel Laureate economist Paul Krugman has observed:
Productivity isn’t everything, but in the long run it is almost everything. A country’s ability to improve its standard of living over time depends almost entirely on its ability to raise its output per worker. . . Compared with the problem of slow productivity growth, all our other long-term economic concerns—foreign competition, the industrial base, lagging technology, deteriorating infrastructure, and so on—are minor issues.72
Economic progress depends on productivity growth, which in turn depends on innovation. For these reasons, the economic growth and job creation prospects of any nation are dramatically enhanced by research and development.
In the previous chapter we mentioned that the Research and Experimentation Tax Credit—commonly known as the research and development (R&D) tax credit—was created as part of the Economic Recovery and Tax Act of 1981 to incentivize technological progress and innovation by allowing businesses to deduct a portion of the cost of research and product development from their taxable earnings. The United States was one of the first countries to incentivize R&D by way of the tax code and claimed the world’s most generous tax treatment of R&D into the early 1990s.
Since its introduction, the R&D tax credit has been shown to be a powerful driver of innovation and economic growth.73 A large and growing body of research indicates that R&D investment is associated with future gains in profitability and market value at the firm level, and with increased productivity at the firm, industry, and broader economy levels.74 R&D also has significant “spill over” benefits, as research conducted by one firm can lead to progress that increases the productivity, profitability, and market value of other firms in related fields.75 A 2001 study of 16 OECD nations over the period 1980 to 1998 found that every $100 in additional R&D spending boosted GDP by $113.76 As a recent Congressional Budget Office analysis observed:
A consensus has formed around the view that R&D spending has a significantly positive effect on productivity growth, with a rate of return that is about the same size as (or perhaps slightly larger than) the rate of return on conventional investments.77
This compelling evidence notwithstanding, implementation of the R&D tax credit in the United States has been far from ideal. First, the original credit was temporary, with an expiration date of year-end 1985. Over the years, the credit has expired eight times and has been extended 14 times, most recently as part of The American Taxpayer Relief Act of 2012, signed by President Obama on January 3, 2013, to avoid the “fiscal cliff.” Failure to make the credit permanent has created year-to-year uncertainty, undermining businesses’ ability to plan their R&D investment coherently. This uncertainty and inability to confidently plan has likely undermined the incentive power of the tax credit. Further exacerbating this uncertainty is the fact that, even when renewed, the formula for calculating the credit has changed many times.
Importantly, the United States can no longer boast the most generous R&D tax credit in the world. Today, 26 of the 34 OECD nations offer R&D tax incentives, and other non-OECD nations such as Brazil, China, India, Russia, Singapore, and South Africa do as well.78 Not only have other nations caught up, they’ve left the United States in the dust. As Figure 9.3 shows, as of 2009 the United States ranked 18th in encouraging private sector R&D. A 2012 analysis found that the United States now ranks 27th of 42 nations studied in terms of R&D tax treatment.79
Figure 9.3 Effective R&D Tax Credit for Large Companies (cents per dollar of R&D expenditure. 2008-2009)
Source: Organisation for Economic Co-operation and Development.

More favorable tax treatment of R&D means that foreign companies are able to invest more heavily in relative terms, with potentially profound implications for innovative advantage over the longer term. Moreover, as global companies look for places to invest in R&D, many other countries are now substantially more attractive than the United States.
This is a crucial point, as R&D investment has become increasingly mobile. Multinational corporations headquartered in the United States, Europe, and Asia account for more than 90 percent of business-funded R&D and are locating more of their investment outside their home countries. Investment location decisions are determined by many factors, including the growth of foreign markets, production costs, talent and skills availability, as well as tax and other incentives offered by governments.80 Between 2004 and 2009, U.S. multinationals almost doubled their overseas R&D employment, from 138,000 to 267,000, while creating only 22,300 domestic R&D positions.81 In an increasingly competitive global economy in which innovation is the key to economic success, the United States’ dismal ranking with regard to R&D tax treatment represents an enormous policy failure.
Global statistics show that while the United States still leads the world in business sector R&D expenditures—investing $270 billion in 2007, more than twice the next largest expenditure of $115 billion invested by Japanese businesses—its relative position has been eroding for years as businesses in other nations increase R&D expenditures at a faster rate. As of 2007, R&D spending by U.S. businesses as a share of GDP ranked sixth (1.96 percent)—behind Israel (3.84 percent), Japan (2.68 percent), Sweden (2.66 percent), Finland (2.51 percent), and South Korea (2.45 percent).
Even more alarming, over the prior decade business R&D as a percentage of GDP grew by just 4 percent in the United States. By stark contrast, business R&D as a percentage of GDP grew by 30 percent in Japan, 36 percent in South Korea, 41 percent in Finland, 101 percent in Israel—and by 251 percent in China.82 China’s performance is particularly remarkable given that its GDP (the denominator) grew at an annual rate of nearly 10 percent over the period.
We, therefore, propose two fundamental enhancements to the R&D tax credit. First, the credit should be made permanent. For U.S. businesses to invest effectively and consistently, they must be able to plan with confidence. Indeed, removing the perennial uncertainty surrounding the credit would likely increase the economic power of its incentive, generating higher R&D expenditures per dollar lost in tax revenue.83 Moreover, as mentioned above, the credit has been repeatedly extended or renewed for more than three decades. Making the credit permanent will codify in advance what is likely to occur anyway. Finally and most fundamentally, the global economy is increasingly technology-based and ever more competitive. America’s economic progress and leadership depends on a permanent commitment to innovation.
We also propose that policymakers restore the United States R&D tax credit to its former status as the most favorable in the world. Businesses currently have two choices for calculating the credit—a very complex and even archaic formula, or the alternative simplified credit (ASC).84 Making the credit the most favorable in the world would require raising the ASC from the current 14 percent to about 45 percent, according to a recent analysis.85 In September of 2010, President Obama proposed increasing the ASC to 17 percent.86 But even increasing the credit to 20 percent would only improve the relative ranking of America’s tax treatment of R&D to 10th in the world. In an ever more competitive global economy in which innovation is the key to success and R&D investment is increasingly mobile, nothing less than being the world’s most attractive R&D investment location is acceptable if America intends to remain the world’s most innovative and productive nation.
Restoring America’s preeminence in incentivizing R&D will not be cheap. But losing the innovation advantage our nation has enjoyed for decades would be much more costly. To argue that we can’t afford to meet the competition is to argue that we can’t afford to own the future. It’s that simple. Moreover, academic research regarding the stimulative effect of R&D investment on the rate of economic growth and job creation, as well as the significant “spillover” impact of such investment, strongly suggest that any short-term loss in tax revenue will be substantially or even entirely recovered through faster economic growth and job creation over the longer run. A recent analysis by the Information Technology & Innovation Foundation determined that increasing the ASC from the current 14 percent to 20 percent would increase GDP by $90 billion annually, create 162,000 new jobs, and generate $17 billion in new tax revenues.87
Return Federal Funding of R&D to 2 Percent of GDP
In addition to significantly enhancing the tax treatment of private R&D, the United States must also renew its commitment to government-funded R&D. The federal government accounts for about 30 percent of all R&D investment. Most critically, whereas businesses fund and conduct the vast majority of applied R&D, 70 percent of basic research is funded by the government and conducted primarily at universities and colleges.88
Basic or pure research is conducted to gather general information and to build on existing knowledge and understanding. Applied research is conducted for more targeted purposes—to resolve a particular question or to achieve a specific commercial objective. For example, a neurologist who studies the human brain to understand its structure and general workings is conducting basic research. A neurologist who studies the brain to determine the causes of Alzheimer’s disease is conducting applied research.
While businesses conduct some basic research—about 20 percent of total basic research in 200989—they are not well suited for such research. First, individual businesses are generally unable to take on the scale and risk that basic research entails. Moreover, firms are highly unlikely to invest in research that has an unknown outcome or that is unlikely to produce an immediate practical application. Basic research results are also not patentable. Finally, because businesses naturally hope to capture the full economic payoff of any R&D expenditure, they are less inclined to share any spillover benefits, limiting the broader societal value of such research.
And yet basic research—in addition to expanding human understanding of science and technology—is also the basis for applied research, establishing the context of knowledge and understanding within which additional progress can be made regarding specific inquiries. In this sense, applied research by businesses depends on basic research funded by government. Indeed, government funding of basic research has played a critical role in driving many technological breakthroughs that have helped U.S. industry become a global technology leader. Google, Sun Microsystems, Pfizer, Genentech, and Cisco are examples of companies whose origins can be traced back to basic research funded by the government.
Unfortunately, the U.S. government’s commitment to R&D has waned dramatically in recent years. After growing at an inflation-adjusted average annual rate of 7 percent between 1950 and 1990, growth in government outlays for R&D fell to an annual average of just 1.4 percent between 1990 and 2012. Meanwhile, other nations have dramatically expanded government support of R&D. Over the period 1992 to 2009, Australia expanded government R&D spending at an average annual rate of 9 percent, South Korea by 11 percent, Singapore by 14 percent, and China by nearly 19 percent.90
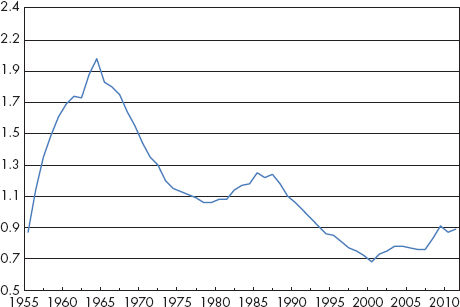
Circumstances are even more alarming when R&D expenditures are considered as a percentage of GDP. As Figure 9.4 shows, U.S. government R&D fell steadily from a high of 2.0 percent of GDP in 1964 to a low of 0.7 percent of GDP in 2000, and has remained at or below 1 percent of GDP ever since.
Figure 9.4 Federally Funded R&D as Percentage of GDP
Source: National Science Foundation, Office of Management and Budget.
Given such trends, it is not surprising that America’s R&D “intensity”—that is, total government and business R&D as a percentage of GDP—has changed very little in recent years. Between 1987 and 2008, America’s R&D intensity increased by just 3 percent, while other nations’ intensity increased much more substantially, including Japan (22 percent), Canada (31 percent), Sweden (34 percent), Ireland (75 percent), Korea (91 percent), Israel (110 percent), and China (110 percent).91
Again, China’s performance is especially impressive given that its GDP grew at an annual rate of nearly 10 percent over the period. China’s overall R&D—government and business—is expected to grow 12 percent to $220 billion in 2013. Given recent rates of growth, China is expected to overtake the United States in total R&D spending within 10 years.92
America’s current R&D intensity, at about 2.8 percent of GDP, ranks eighth in the world behind Israel (4.3 percent), Finland (4.0 percent), Sweden (3.6 percent), South Korea (3.4 percent), Japan (3.3 percent), Denmark (3.0 percent), and Taiwan (2.9 percent).93
These troubling circumstances have been made even worse by the impact of sequestration—the significant across-the-board cuts to government spending that took effect on March 1, 2013. An analysis by the Information Technology & Innovation Foundation has determined that sequestration will cut government R&D by 8.8 percent, or $12.5 billion, in 2013, with similar cuts required each year through 2021. These reductions, the ITIF estimates, will result in GDP losses of up to $860 billion by 2021 and job losses of 450,000 by 2016.94
With all this in mind, we recommend restoring U.S. government funding of R&D to 2 percent of GDP. To do so, funding would need to be increased from the current $140 billion annually to about $320 billion. Adding this level of government funding to the approximately $280 billion that U.S. businesses are expected to invest in R&D in 2013 would raise America’s total R&D intensity to 3.8 percent of GDP, the third highest in world behind Israel and Finland.
We understand that more than doubling government R&D funding is a significant challenge given current fiscal circumstances. But, again, for all the reasons presented above, we are strongly of the view that America’s economic future depends utterly on such a commitment.
Consider this:
In November of 2011, China confirmed its rumored “Innovation 2020” strategy, by which it intends to invest $1.7 trillion over the next seven years in seven “strategic emerging sectors”: alternative sources of energy, biotechnology, next-generation information technology, high-end manufacturing, advanced materials, alternative fuels, energy efficiency, and environmentally friendly technologies.95 For the United States to match such investment on a comparable GDP basis, it would have to increase R&D investment by $800 billion—the equivalent of the American Recovery and Reinvestment (the “Stimulus”) Act—every year.
Jump-Start America’s Trade Agenda
America’s two principal economic challenges following the Great Recession are, first, to put millions of unemployed and underemployed Americans back to work and, second, to significantly accelerate economic growth. Unfortunately, until just recently, the United States had all but abandoned one of the most powerful tools at our disposal for accomplishing both objectives—freer and more open trade.96
After negotiating 19 free trade agreements (FTAs) between 1994 and 200797—an average of more than one each year—the United States has not negotiated a single new FTA in six years. President Obama signed FTAs with South Korea, Colombia, and Peru, but all three were negotiated during the administration of George W. Bush.98 The United States is a participant in the Trans-Pacific Partnership, an agreement currently being negotiated between 11 Pacific nations, but the United States did not initiate the dialogue and U.S. participation was announced by the Bush Administration in September of 2008.
Meanwhile, the rest of the world has been passing us by. The European Union currently has 28 FTAs in force and has launched negotiations with India, Canada, and Ukraine. China has negotiated 10 FTAs with 20 countries and has initiated five others. India has 13 FTAs in force with a total of 25 countries and another three in negotiation.99 Most recently, Japan, China, and South Korea launched negotiation of a three-way FTA in May of 2012.100
A recent Council on Foreign Relations task force comprised of 22 academic scholars and former senior policymakers of both political parties assessed America’s recent trade posture in stark terms:
Today, the United States lacks an ambitious trade policy and has not kept pace with other countries in opening new markets abroad, especially in the fast-growing economies of Asia and Latin America that are now major engines of global growth. If the United States is to prosper in today’s global economy, it must enhance its ability to attract the investment and jobs linked to producing goods and services for these large and prospering markets. In short, the United States must become a great trading nation.101
America’s inactive trade agenda is both ironic and unfortunate. Ironic, because the United States has been the principal advocate of global trade liberalization since the negotiation of the General Agreement on Tariffs and Trade (GATT) in Geneva, Switzerland, in 1947. Unfortunate, because the United States has benefited enormously from freer and more open trade—and stands to benefit even more from further liberalization.
The GATT was created as part of the world’s response to the devastation of World War II and the policy failures and Great Depression that led in part to that historic calamity. The organizing principal was simple yet inspired—to promote global stability and security by expanding economic opportunity and raising living standards around the world. The great significance of the GATT was that it marked the first time the world had enshrined these principles in a multinational framework aimed at promoting global economic growth and development through, as the Agreement’s preamble states, the “substantial reduction of tariffs and other trade barriers and the elimination of preferences, on a reciprocal and mutually advantageous basis.”
The connection between trade and economic growth was first made by Adam Smith in his classic work The Wealth of Nations. Trade, Smith explained, provides access to the resources, goods, and services that nations lack or can only produce with great difficulty or at high cost. Trade also increases the size of markets, thereby promoting competition and all the associated benefits, such as greater efficiency, lower prices, and innovation. Trade, therefore, promotes the creation of wealth, as well as peace between nations by substituting internal development for territorial enlargement through conquest. To these seminal observations, British economist David Ricardo added his notion of comparative advantage, whereby countries with very different capacities and levels of productivity can still trade to mutual benefit.
In the 70 years since GATT, global trade and prosperity have flourished well beyond the hopes of the 23 nations who negotiated the agreement. Since 1948, the average tariff rate of industrialized countries has been reduced from 40 percent to less than 4 percent, and world economic output has expanded by more than 700 percent as annual global exports of goods have exploded from just $60 billion to more than $18 trillion.102 Perhaps most importantly, more than 500 million people in the developing world have been lifted out of poverty, creating new markets and new avenues for additional prosperity.
Academic research has confirmed that countries that have more open economies and that engage in international trade enjoy higher growth rates and faster reductions in poverty than more closed economies.103 The World Bank has also determined that developing countries that engage in trade enjoy the fastest growth in wages.104
Nobel Laureate economist Robert Solow and Martin Baily, former chairman of President Clinton’s Council of Economic Advisors, have argued that free trade and increased global engagement also promote economic growth by exposing nations to global best practices, which leads to higher productivity:
. . . when an industry is exposed to the world’s best practice, it is forced to increase its own productivity. This finding emerged from a study that compared nine manufacturing industries in the United States, Germany, and Japan . . . the more a given industry is exposed to the world’s best practice high productivity industry, the higher is its relative productivity (the closer it is to the leader). Competition with the productivity leader encourages higher productivity.105
In what has been the most dynamic era of economic development in human history, trade has become the basis for a prosperous world economy. By capitalizing on what different countries do best, trade lowers costs, frees up capital and other resources to be used more productively, raises living standards, and promotes growth and development—all of which promote faster job creation.
The United States—representing about 20 percent of global trade and as the world’s third largest exporter—has benefited enormously from freer and more open trade. In 1994, the GATT was replaced by the creation of the World Trade Organization (WTO).106 Since then, U.S. exports have quadrupled to more that $2 trillion. Since the North American Free Trade Agreement (NAFTA) became law in 1994, U.S. exports to Canada have tripled and U.S. exports to Mexico have quintupled. In 2012, U.S. trade with Mexico and Canada surpassed $1 trillion for the first time. And since China joined the WTO in 2001, U.S. exports to China have increased 600 percent—seven times faster than U.S. exports to the rest of the world.107
The relative importance of trade to the U.S. economy has also increased. Twenty-five years ago, the total value of U.S. exports and imports amounted to 15 percent of America’s GDP. In recent years, nearly a third of GDP and as much as a quarter of economic growth have been trade related.108 In 2010 and 2011, expanding exports accounted for about half of total U.S. economic growth.
The net result of the substantial trade liberalization achieved in recent decades is that America’s national income is at least $1 trillion higher each year.109 Moreover, further liberalization focused on cross-border investment and trade in services could raise national income by an additional $500 billion annually.110 Such sizeable additional gains are possible because barriers to trade in services remain comparatively high, about 80 percent of U.S. economic output and a comparable share of U.S. employment is services-related, and because the United States maintains a strong comparative advantage in many service activities.
Perhaps most importantly, trade creates jobs. According to the Commerce Department, each additional $1 billion in exports of American-made goods creates approximately 5,000 new jobs, while each additional $1 billion in exports of American-provided services creates about 4,000 new jobs. At present, nearly 10 million American jobs are tied directly to exports—including a fifth of all manufacturing jobs—and those jobs pay salaries 13 to 18 percent more than the national average.111 Add to that the more than 6 million American workers employed by foreign firms who outsource jobs to the United States.112 Research has indicated that growth in exports produces twice as many jobs as an equivalent expansion of domestic output.113 And exporting companies, when compared to nonexporters, tend to generate about twice as many sales, be about 10 to 15 percent more productive per worker, and, therefore, pay about 10 to 15 percent more in salaries.114
In his 2010 State of the Union Address, President Obama announced the National Export Initiative (NEI), with the goal of doubling exports to more than $3 trillion within five years and creating 2 million new American jobs.115 The goal was enormously ambitious. To double within five years, exports would need to grow by 15 percent each year. The fastest five-year growth in exports occurred between 1986 and 1991, when exports rose 85 percent. Exports rose 78 percent in the last five years of George W. Bush’s administration.
“If we’re going to grow,” President Obama said in November of 2011, “it’s going to be because of exports.”116
The initiative got off to a promising start, with exports expanding by 14.5 percent in 2010 and nearly 10 percent in 2011. In 2011, U.S. exports topped $2 trillion for the first time, accounting for nearly 14 percent of GDP.117 But export growth plunged to just 2.9 percent in 2012, as emerging market economies slowed and as Europe teetered on the edge of recession, dimming chances of achieving the President’s goal.
Then, in his 2013 State of the Union Address, President Obama announced the beginning of negotiations toward a U.S.–EU Transatlantic Trade and Investment Partnership (TTIP).118 If achieved, the agreement would be the most ambitious since the founding of the WTO—encompassing 28 nations, half of global economic output, and a third of all trade.
Existing tariffs on goods traded between Europe and the United States are already low, averaging less than 3 percent. But the lowering or removal of remaining tariffs, along with the harmonization of regulations, product standards, and other non-tariff “behind-the-border” barriers to trade could yield enormous gains, given the size of the two economies.119 Economists estimate that the TTIP could boost transatlantic trade by $120 billion per year,120 and could add 1.6 percentage points to U.S. economic growth and 1.2 percent to Europe’s—sizable gains for two economies currently struggling with below-trend growth.121
The TTIP is an excellent first step toward a more robust U.S. trade agenda. But America should not be satisfied with a trade agenda comprised of a single set of negotiations, no matter how significant. We propose that the United States build on that impressive start by initiating free trade talks with a number of nations—in particular, large trading partners like Japan and Taiwan, and large emerging market countries like Brazil, India, and China. With the exception of South Korea, the FTAs negotiated over the past 20 years have been with small countries. The combined GDP of the 20 nations with whom the United States has active FTAs is about $7 trillion—less than China’s GDP. It’s time for America to focus on the big prizes. Between 2005 and 2010, economic output from emerging market economies rose by 41 percent—including 70 percent in China and 55 percent in India—while output in advanced economies expanded by just 5 percent.122
A very positive development in this regard is that Japan has expressed interest in joining the Trans-Pacific Partnership trade negotiations among 11 Pacific nations including the United States. Japan’s participation is expected by mid-summer 2013.
Future trade negotiations should also focus on industry sectors offering the greatest market-expanding and job-creating opportunities. Freer trade in services should be a particular focus. As mentioned above, expanded trade in services—software, telecommunications, finance, consulting, accounting, and engineering—offers enormous potential gains because barriers to trade in services remain comparatively high, about 80 percent of U.S. economic output and a comparable share of U.S. employment is services-related, and the United States maintains a strong comparative advantage in many service activities.123 In 2012, the United States posted a services trade surplus of $196 billion, compared to a deficit of $540 billion in merchandise trade.124
Freer global trade has been an unqualified economic, political, international, and human success story since Word War II, fueling the most dramatic expansion of global economic output, wealth and job creation, and poverty alleviation in history. By offering prosperity in return for peaceful exchange and market-led cooperation, trade has become a critical cornerstone for progress and peace around the world. Trade has also been, and remains, a major strategic element of U.S. foreign policy.
Given the importance of faster economic growth to new business formation and survival, job creation, and debt and deficit reduction, the critical task before us now is to build on the achievements of the past 70 years by capturing the gains offered by further trade liberalization. With 95 percent of the world’s consumers living beyond our borders, trade is an essential tool for promoting economic growth and job creation, and advancing U.S. global interests more broadly.
Negotiate a U.S–China Free Trade Agreement
One FTA opportunity deserves special focus. Within the context of what a more robust trade agenda would mean for U.S. economic growth and job creation, the United States should capitalize on one of the most significant events in human history—the continuing economic emergence of China—by negotiating a U.S.–China free trade agreement. Though daunting with regard to its scale, complexity, and cultural challenges, successful negotiation of a U.S.–China FTA would yield enormous gains for the world’s two largest economies—and, therefore, the global economy—and would serve as a solid foundation for greater economic, political, and strategic cooperation between the world’s two most powerful nations.
China’s economy has grown at an annual rate of nearly 10 percent for three decades. The world’s seventh largest economy as recently as 1999, China has now surpassed Japan to become the world’s second largest economy. The rate of China’s economic growth and the ongoing integration of its 1.3 billion people—a fifth of the world’s population—into the global economy are unprecedented in human history, with profound implications for U.S. economic growth and job creation.
As Figure 9.5 shows, U.S. exports to China have increased more than sixfold since China joined the WTO in December of 2001. China is now America’s third largest export market, and the largest market for U.S. goods and services outside North America. Top American exports to China include agricultural products, computers and electronics, chemicals, and transportation equipment, especially aerospace and autos.125
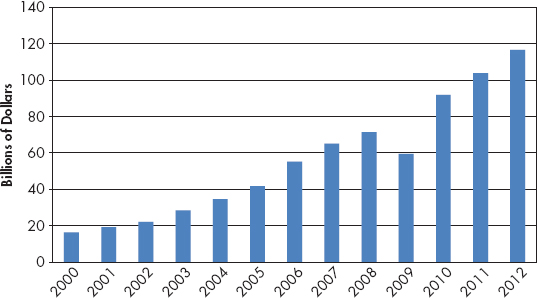
As Figure 9.6 shows, China is also America’s fastest growing export market by far—growing at seven times the rate of U.S. exports to the rest of the world. Since 2001, 48 states have experienced at least triple-digit growth in their exports to China, far outpacing growth in their exports to the rest of the world. Twenty states have recorded quadruple-digit growth. Indeed, virtually every Congressional district in the United States has experienced dramatic growth in exports to China.126
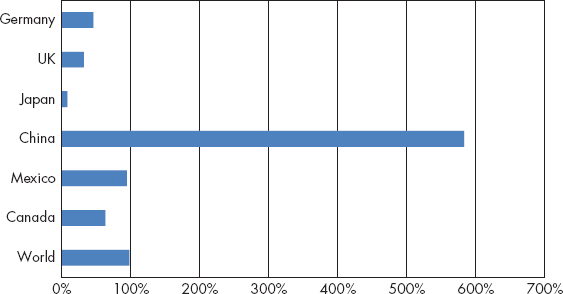
Of course, as the U.S.–China economic relationship has grown in magnitude and complexity, frictions have emerged. Issues complicating the relationship include the large trade imbalance, product safety concerns, intellectual property infringements, China’s foreign exchange rate policies, and, most recently, alleged cyber-espionage.127 While not surprising, and perhaps even inevitable, such festering problems have caused some U.S. policymakers, and many Americans, to question the benefits of maintaining an open and expanding economic relationship with China.
China’s membership in the WTO beginning in December of 2001 was the culmination of nearly 15 years of negotiations with the WTO, and 25 years of political and economic engagement by the United States.128 To achieve membership, China implemented thousands of reforms in hundreds of aspects of its economy and legal and regulatory system.129 But the work to fully integrate China into the global economy is not finished. Indeed, in a very real sense, only the easy part is over.
In our view, U.S. policy with regard to China should move beyond the monitoring of China’s compliance with a discrete set of specific WTO-related obligations to a broader and more sophisticated policy that seeks more proactive cooperation in an increasingly dynamic relationship. The aim of such policy should be to ensure that China participates fully and constructively as a mature and responsible stakeholder in the global economy from which it has benefited so profoundly. Negotiation of a U.S.–China FTA can cement progress achieved to date and ensure a more balanced, equitable, and durable bilateral relationship.
Such an agreement should focus on further opening China’s economy to U.S. exports; lowering or even eliminating import tariffs and other legal and regulatory barriers in both countries to expanded trade; ensuring robust protection of intellectual property; ensuring non-discriminatory national treatment of U.S. and Chinese businesses with regard to licensing, corporate form, and permitted products and services; greater regulatory and judicial transparency in China; and greater foreign participation in China’s financial sector.
Initial discussion of an FTA can occur as part of the ongoing U.S.–China Strategic and Economic Dialogue (S&ED).130 Established in September of 2006 by President George W. Bush and President Hu Jintao to enhance the management of the growing bilateral relationship, the S&ED created an unprecedented channel of communication between Cabinet-level U.S. and Chinese policymakers, and provided an overarching framework for the examination of long-term strategic issues, as well as coordination of ongoing bilateral policy discussions.
Negotiating a U.S.–China FTA will not be easy. All FTA negotiations are complex, painstaking, arduous work. Moreover, having been to China several times ourselves and sat in many meetings with senior government officials, regulators, and business people, we understand that the United States and China are very different countries, with very different cultures, values, priorities, and even ways of thinking.131 Negotiation of an FTA with China would surely take years. There will be quarrels and setbacks. At times, success might seem unachievable.
But, in our view, the logic and even necessity of a U.S.–China FTA is undeniable. The United States and China are the world’s largest economies and will be for decades to come, although their positions are likely to switch.132 Together the two economies currently account for a third of global economic output and half of global economic growth.
Moreover, the two economies are already integrated to the point of mutual dependence. Like it or not, healthy economic growth and job creation in America depends in large part on continued growth in China, and vice versa. Former Treasury Secretary Henry M. “Hank” Paulson has called the U.S.–China economic relationship “the most important bilateral economic relationship in the world today.”133 Without question, how this critical relationship develops, evolves, and is managed will be among the most important factors determining the growth and stability of the global economy in the twenty-first century.
For China, the value of an FTA with the United States might well be nothing less than economic survival. After nearly three decades of astonishing growth and development, China now faces daunting challenges that threaten the success achieved to date and its economic future. Such challenges include an economic model too dependent on physical investment and exports, domination of the economy by state-owned enterprises, environmental degradation, high social and economic inequality, and a comparatively primitive financial sector that remains largely closed to foreign participation.134 According to the World Bank, unless China meaningfully addresses these and other structural problems, it runs the risk of significant and sudden deceleration of economic growth.135 Greater participation in China’s economy by American companies, consumers, and investors under the terms of an FTA would help accelerate the structural and macroeconomic reforms necessary for China to ensure sustained growth and stability over the long term.
For the Unites States, the FTA will ensure that American manufacturers, service providers, farmers—and entrepreneurs—can participate in, contribute to, and benefit from the continuing emergence of the greatest commercial market in history. A quick back-of-the-napkin calculation reveals what an expanding Chinese economy can mean for U.S. economic growth and job creation.
Last year, U.S. exports to Japan totaled $70 billion, while U.S. exports to China totaled $110.5 billion. But China’s population is 10 times that of Japan. If China’s citizens eventually consume American-made goods and services at the same rate as the Japanese currently do, U.S. exports to China would grow to more than $700 billion annually. That’s seven times what America exported to China last year, an amount equivalent to nearly 5 percent of U.S. GDP, and nearly twice what we imported from China last year—turning a $315 billion trade deficit into a $275 billion surplus.
Using the Commerce Department’s export and jobs metrics discussed above, increasing U.S. exports to China to $700 billion a year would create more than 3 million new American jobs.
Combine and Modernize Unemployment Insurance and Trade Adjustment Assistance
While liberalized global trade has been an unqualified boon to the U.S. economy—increasing national income by at least $1 trillion each year and promising an additional $500 billion per year if further liberalization focused on cross-border investment and services is achieved—such gains are not distributed evenly. Many Americans have prospered in the age of globalization, others have not. As resources, capital, and production are reallocated to reflect the comparative economic advantages of trading partners, painful adjustments can and do occur. Certain industries and businesses might be disrupted or forced to downsize, employee salaries might be reduced by employers to remain competitive, and certain jobs might be relocated or even eliminated.
And such trade-related pressures are not limited to those directly affected. Due to the pronounced dynamism and competition in U.S. labor markets described in Chapter 2, the impact of trade and global engagement inevitably spreads throughout the economy, affecting, both positively and negatively, the employment prospects, earnings, and living standards of every American.
Such changes, and especially the accelerating rate of change, have become cause for anxiety and even fear for many Americans.136 This reality is reflected in public polling on the subject of trade. For example, two NBC/Wall Street Journal polls, the first conducted in December of 1999 and the second in September of 2010, found that the percentage of people who think that free trade agreements “have hurt the United States” increased from 30 percent in 1999 to 53 percent in 2010, while the percentage of those polled who think that FTAs “have helped the United States” fell from 39 percent in 1999 to just 17 percent in 2010.137
It should be pointed out that the aggregate gains associated with freer trade have been shown to far exceed the associated costs. In fact, academic research has concluded that trade-related economic gains outstrip aggregate costs by a factor of 20 and even 100.138 Moreover, the U.S. economy is in a constant state of change, impacted by many forces other than trade pressures. Technological advancement, innovation of various kinds, demographic changes, economic cycles, changing consumer tastes, and governmental policies continuously impact and determine the job security, economic prospects, earnings, and living standards of American workers in much more powerful ways than trade.
Finally, and perhaps most fundamentally, change and adjustment is essential to the health of the U.S. economy. Without the constant reallocation of capital, labor, and other resources from less productive sectors to more productive sectors, economic growth, job creation, and living standards would be harmed, not improved.
Nevertheless, the concerns and anxieties felt by many Americans with regard to freer trade are genuine, powerful, and understandable. Trade can and does impose real and often persistent costs on some American industries, firms, communities, and workers.
Making the case for freer trade, therefore, and strengthening the political consensus for freer trade, requires a meaningful and specific policy response to this reality.139 The aim of that policy response should be to expand the numbers of those who benefit directly and significantly from freer trade and global engagement, and to provide effective transition assistance to those adversely affected by evolving trade patterns and globalization.
Specifically, we propose combining the current Unemployment Insurance (UI) and Trade Adjustment Assistance (TAA) programs into a new integrated and significantly expanded Economic Adjustment Assistance (EAA) program. The new EAA program would offer American workers who have been displaced for any reason—trade-related or otherwise—a flexible twenty-first century menu of short-term assistance options. This idea was originally proposed in 2007 by Matthew Slaughter of the Tuck School of Business at Dartmouth, Robert Lawrence of Harvard’s Kennedy School of Government, and Grant Aldonis, former Under Secretary of Commerce for International Trade.140
UI was created as part of the Social Security Act of 1935 and has not changed fundamentally since then. UI benefits are intended to reduce the hardship of involuntary unemployment, help maintain the purchasing power of the unemployed, and preserve the local workforce so that workers are available when employers are ready to rehire. In effect, UI was designed to support an unemployed worker until he or she is rehired by the previous employer or a similar employer. But the challenges that confront unemployed workers today are much more complex, and can include finding a new employer, often in a new field or industry; upgrading or adding to existing skills; learning altogether new skills; and coping with lost earnings and benefits, especially healthcare.
TAA, created as part of the Trade Expansion Act of 1962 and further defined under the Trade Act of 1974, was designed to supplement UI by providing assistance to workers displaced specifically by competition from imports. But, again, rather than facing one-time adjustments to isolated increases in import competition, firms and workers today face continuous adjustment challenges due to an ever-changing competitive landscape driven by technological advancement, competition from overseas, changing consumer tastes, business cycles, and governmental policy. In fact, data collected by the Bureau of Labor Statistics show that only about 1 percent of employer layoffs of 50 or more people in recent years have been due to competition from imports.141
And yet, TAA offers assistance only to workers who have been displaced due to trade. Moreover, the principal assistance provided through TAA is training within the affected worker’s current field, rather than a broad array of more tailored options responding to the specific challenges confronting a particular displaced worker.142 For these reasons, as well as reportedly daunting administrative complexities, less than a quarter of eligible workers have taken advantage of TAA benefits in recent years. Indeed, just 196,000 workers participated in some aspect of the TAA program in fiscal year 2011—fewer than the number of jobs lost on an average day.143
UI and TAA are well-intentioned government programs designed to soften the blow of economic displacement. But as currently structured and administered, both programs are relics of an economy that no longer exists and, therefore, are insufficient to meet the varied adjustment needs of a twenty-first century, globally engaged American workforce. Given the array of forces that affect their jobs, economic prospects, earnings, and living standards, American workers need and deserve a broader and more flexible framework of adjustment assistance comprised of options tailored to address their specific needs.
Some displaced workers need to upgrade or add to skills within their current fields. Others need new skills to leave a shrinking field and jump to an expanding field. Some need help with relocation expenses in order to take a new job in a different city. Still others might decide to start their own businesses and need access to start-up capital. A modern and effective EAA program should offer an array of a la carte options designed to provide the flexibility and optionality necessary to meet the varied needs of displaced workers in twenty-first century America.
Other key aspects of the EAA program would likely include a wage-loss insurance feature to ease the transition for older workers forced to take lower-paying jobs, continued health insurance coverage while workers remain eligible for EAA, and, potentially, allowing workers in transition to access tax-advantaged savings and investment accounts, like IRAs and 401(k)s, without incurring standard penalties.
Combining the UI and TAA programs into a single, expanded, and integrated new Economic Adjustment Assistance program would entail two principal advantages. First, significant cost savings would be achieved by eliminating separate and often inconsistent qualification regimes, as well as duplicative administration. Most importantly, two uncoordinated programs that offer displaced workers only limited assistance would be replaced by a broader and more modern assistance program designed to serve as a one-stop source for displaced workers—regardless of the source of their displacement—to access the specific assistance that they as individuals need to return to the active workforce.
Adjustment assistance that works, that meets the specific needs of displaced workers, and provides a pathway back to gainful employment in a growing economy will help preserve the national consensus for global engagement policies like freer trade that offer such significant additional gains, and that, therefore, must be part of America’s strategy to accelerate economic growth and job creation.
Notes
1. Jan Bouten, “Memphis’ Start-Up Niche: Bio-Engineering and Logistics,” Wall Street Journal, January 29, 2013.
2. Paul Wiseman, “U.S. Economic Recovery Is Weakest Since World War II,” Associated Press, August 15, 2012.
3. Edward P. Lazear, “The Worst Economic Recovery in History,” Wall Street Journal, April 2, 2012.
4. Catherine Rampell, “Hiring Picks Up in July, But Data Gives No Clear Signal,” New York Times, August 3, 2012.
5. Nelson D. Schwartz, “Recovery in U.S. Is Lifting Profits, But Not Jobs,” New York Times, March 3, 2013.
6. For a similar presentation of the kinds of comments and sentiments we heard from our participants, see the following segment from the PBS Newshour: “Why Are Small Businesses Reluctant to Hire?” December 5, 2011; www.pbs.org/newshour/extra/video/blog/2011/12/why_are_small_businesses_reluc.html.
7. The debt ceiling is a legislative restriction on the amount of national debt that can be issued by the Treasury Department. Because actual government expenditures are authorized by Congress through legislation, the debt ceiling does not limit or reduce government deficits. Rather, it can only restrain the Treasury from paying for expenditures that have already been incurred.
8. The Tax Relief, Unemployment Insurance Reauthorization, and Job Creation Act of 2010. Without passage of the 2010 law, income taxes would have returned to Clinton Administration–era rates in January 2011. The Act also extended some provisions from the American Recovery and Reinvestment Act of 2009, commonly known as “the Stimulus Act,” and included several other measures as part of a compromise agreement between President Obama and Congressional Republicans, mostly notably an extension of unemployment benefits and a one-year reduction in the FICA payroll tax.
9. The Economic Growth and Tax Relief Reconciliation Act of 2001 and the Jobs and Growth Tax Relief Reconciliation Act of 2003.
10. Rates affected included income taxes, the Earned Income Tax Credit, capital gains and dividend taxes, payroll taxes, and the estate tax.
11. In testimony before the House Financial Services Committee on February 29, 2012, Bernanke stated, “Under current law, on January 1, 2013, there’s going to be a massive fiscal cliff of large spending cuts and tax increases. I hope that Congress will look at that and figure out ways to achieve the same long-run fiscal improvement without having it all happen at one date.”
12. Rebecca Berg, “Fear of Year-End Fiscal Stalemate May Be Having Effect Now,” New York Times, July 11, 2012.
13. Jeff Werling, “Fiscal Shock—America’s Economic Crisis: The Impact of the Pending Fiscal Crisis on Jobs and Economic Growth,” University of Maryland, October 2012. Also see Lori Montgomery, “One Million Jobs Already Lost Due to Fiscal Cliff,” Washington Post, October 26, 2012.
14. Emily Maltby and Angus Loten, “Cliff Fix Hits Small Business,” Wall Street Journal, January 3, 2013. Also see Sudeep Reddy and Scott Thurm, “Investment Falls Off a Cliff,” Wall Street Journal, November 19, 2012.
15. “Consumer Sentiment Plunges in December,” Reuters, December 7, 2012; Catherine Rampell, “Small-Business Optimism Plunges,” New York Times, December 11, 2012. Also see Catherine Rampell, “Forecast Is Sunnier, But Washington Casts a Big Shadow,” New York Times, December 16, 2012.
16. Lori Montgomery and Paul Kane, “Obama, Senate Republicans Reach Agreement on Fiscal Cliff,” Washington Post, December 31, 2012.
17. Director Elmendorf discussed the impact of higher rates on jobs beginning in minute 29:30 of a press briefing on February 5, 2013: www.c-span.org/Events/CBO-Report-Deficit-Will-Fall-to-Less-Than-1-Trillion-in-2013/10737437810/
18. David Rogers, “Sequestration: Senate Fails in Last-Chance Bid to Avoid Sequester,” Politico, February 28, 2013; see also Devin Dwyer and Mary Bruce, “Obama Signs Order to Begin Sequester Cuts after President, Congress Can’t Reach Deal,” ABC News, March 1, 2013.
19. “We think that would reduce the level of employment by the end of the year about 750,000 jobs,” Elmendorf told a House Budget Committee Hearing on February 13, 2013. Also see David Wessel, “Biggest Drag on Economy? Washington,” Wall Street Journal, March 20, 2013.
20. David Brown, “Cheating the Future: The Price of Not Fixing Entitlements,” Third Way, February 2013. Also see Robin Harding, “Jobs Start to Go as U.S. Sequestration Cuts In,” Financial Times, March 6, 2013.
21. Alan Blinder, “The Debt Ceiling Is Scarier Than the Fiscal Cliff,” Wall Street Journal, January 14, 2013.
22. NFIB press release, February 12, 2013. Also see Catherine Rampell, “Small Businesses Still Struggle, and That’s Impeding the Recovery,” New York Times, February 13, 2013.
23. Scott R. Baker, Nicholas Bloom, and Steven J. Davis, “Measuring Economic Policy Uncertainty,” June 4, 2012.
24. David Wessel, “Trying to Calculate the Cost of Uncertainty,” Wall Street Journal, December 5, 2012.
25. See Scott R. Baker, Nicholas Bloom, and Steven J. Davis, “Policy Uncertainty Is Choking Recovery,” Bloomberg, October 5, 2011. Also see “Measuring Economic Policy Uncertainty,” October 10, 2011.
26. Bill McNabb, “Uncertainty Is the Enemy of Recovery,” Wall Street Journal, April 28, 2013.
27. David Wessel, “CEOs Call for Deficit Action,” Wall Street Journal, October 25, 2012.
28. Allan Murray, “CEOs to Washington: Strike a Deal—and Do It Now,” Wall Street Journal, November 19, 2012.”
29. Kim Dixon, “CEOs Step Up Push for Compromise of Fiscal Cliff,” Reuters, December 11, 2012.
30. Scott Malone, “CEO Confidence Drops to Three-Year Low: Roundtable,” Reuters, September 26, 2012.
31. James Politi and Ed Crooks, “Fiscal Cliff Dims Business Mood,” Financial Times, September 26, 2012.
32. Michael J. De La Merced, “Einhorn Sues Apple Over Plan to Discard Preferred Stock,” New York Times, February 7, 2013.
33. Bruce Bartlett, “The Growing Corporate Cash Hoard,” New York Times, February 12, 2013; and “Corporations Sitting On Piles Of Cash? Not Really,” USA Today, November 26, 2011.
34. Robert Pollin, James Heintz, Heidi Garrett-Peltier, and Jeannette Wicks-Lim, “19 Million Jobs for U.S. Workers: The Impact of Channeling $1.4 Trillion in Excess Liquid Asset Holdings Into Productive Investments,” Political Economy Research Institute, University of Massachusetts, December 2011.
35. The Budget and Economic Outlook: Fiscal Years 2013 to 2023, Alternative Fiscal Scenario (Washington, DC: Congressional Budget Office, February 5, 2013).
36. See Carmen M. Reinhart and Kenneth S. Rogoff, “Growth in a Time of Debt,” NBER Working Paper No. 15639, January 2010; and Carmen M. Reinhart and Kenneth S. Rogoff, “A Decade of Debt,” NBER Working Paper No. 16827, February 2011.
37. Carmen M. Reinhart and Kenneth S. Rogoff, “Too Much Debt Means the Economy Can’t Grow,” Bloomberg, July 14, 2011.
38. See Stephen G. Cecchetti, M.S. Mohantly, and Fabrizio Zampolli, “The Real Effects of Debt,” The Bank for International Settlements, September 2011; and Manmohan S. Kumar and Jaejoon Woo, “Public Debt and Growth,” Working Paper No. 10/174, International Monetary Fund, July 1, 2010.
39. Thomas Herndon, Michael Ash, Robert Pollin, “Does High Public Debt Consistently Stifle Economic Growth? A Critique of Reinhart and Rogoff,” Political Economy Research Institute, University of Massachusetts—Amherst, April 15, 2013.
40. Carmen M. Reinhart and Kenneth S. Rogoff, “Debt, Growth, and the Austerity Debate,” New York Times, April 25, 2013.
41. Office of Management and Budget, Historical Tables, Table 1.1
42. Alison Acosta Fraser, “Federal Spending by the Numbers 2012,” The Heritage Foundation, October 16, 2012.
43. Data in this paragraph from “Budget of the U.S. Government: FY 2013,” Office of Management and Budget, February 2012, Historical Tables, Table 8.7.
44. Mort Zuckerman, “Brace for an Avalanche of Unfunded Debt,” US News & World Report, December 28, 2012.
45. Chris Cox and Bill Archer, “Why $16 Trillion Only Hints at the True U.S. Debt,” Wall Street Journal, November 26, 2012.
46. “Mullin: Debt Is Top National Security Threat,” CNN, August 27, 2010.
47. Kate Brannen, “Mike Mullin Focuses on Debt as Security Threat,” Politico, December 6, 2012.
48. John F. Cogan, John B. Taylor, Volker Wieland, and Maik Wolters, “Fiscal Consolidation Strategy,” abstract, June 14, 2012. Also see Michael J. Boskin, “Larger Spending Cuts Would Help the Economy,” Wall Street Journal, March 4, 2013.
49. Floyd Norris, “Tax Reform Might Start with a Look Back to ‘86,” New York Times, November 22, 2012. Also see Elaine Kamarck and James P. Pinkerton, “Tax Reform Lessons From 1986,” The Hill, August 27, 2012.
50. See “Background Information on Expenditure Analysis and Historical Survey of Tax Expenditure Estimates,” Joint Committee on Taxation, February 28, 2011.
51. “Estimates of Federal Tax Expenditures for Fiscal Years 2010–2014,” Joint Committee on Taxation, Table 1, December 21, 2010.
52. See testimony of Robert A. McDonald, chairman, Fiscal Policy Initiative, Business Roundtable, before the House Committee on Ways and Means, Hearing on Tax Reform, January 20, 2011.
53. Katarzyna Bilicka, Machael Devereux, and Clemens Fuest, G-20 Corporate Tax Ranking 2011 (Oxford, UK: Oxford University Center for Business Taxation, 2011).
54. “Global Effective Tax Rates,” PriceWaterhouseCoopers, April 14, 2011.
55. McDonald testimony, January 20, 2011.
56. William C. Randolph, “International Burdens of the Corporate Income Tax,” Congressional Budget Office, Working Paper 2006-09, August 1, 2006.
57. See Rosanne Altshuler, Benjamin H. Harris, and Eric Toder, “Capital Income Taxation and Progressivity in a Global Economy,” Urban Institute, November 30, 2011; Kevin Hassett and Apurna Mathur, “Taxes and Wages,” AEI Working Paper, July 6, 2006; Apurna Mathur and Matthew Jensen, “Corporate Tax Burden on Labor: Theory and Evidence,” AEI Tax Notes, June 6, 2011.
58. Simeon Djankov, Tim Ganser, Caralee McLiesh, Rita Ramalho, and Andrei Shleifer, “The Effect of Corporate Taxes on Investment and Entrepreneurship,” American Economic Journal: Macroeconomics 2, no. 3 (July 2010): 31–64.
59. “Reform the Outdated Tax System to Enhance American Competitiveness,” President’s Council on Jobs and Competitiveness.
60. Kate Limbaugh, “Firms Keep Stockpiles of ‘Foreign’ Cash in U.S.,” Wall Street Journal, January 22, 2013.
61. C. Fritz Foley, Jay Hartzell, Sheridan Titman, and Garry Twite, “Why Do Firms Hold So Much Cash? A Tax-Based Explanation,” Journal of Financial Economics 86, no. 3 (December 2007): 579–607.
62. Zachary Tracer, “U.S. Technology Companies May Double Overseas Cash, Moody’s Says,” Bloomberg, June 27, 2011.
63. Limbaugh, “Firms Keep Stockpiles.”
64. John R. Graham, Michelle Hanlon, and Terry Shevlin, “Barriers to Mobility: The Lock-Out Effect of U.S. Taxation of Worldwide Corporate Profits,” National Tax Journal 63, no. 4, part 2 (December 2010): 1111–1144. Also see Kate Limbaugh, “Top U.S. Firms Are Cash-Rich Abroad, Cash-Poor at Home,” Wall Street Journal, December 4, 2012.
65. David Reilly, “Foreign Profits Can Create Earnings Illusion,” Wall Street Journal, October 7, 2012.
66. “The Need for Pro-Growth Corporate Tax Reform: Repatriation and Other Steps to Enhance Short- and Long-Term Economic Growth,” Douglas Holtz-Eakin, prepared for the U.S. Chamber of Commerce, August 2011.
67. Lauren French, “1986 Redux on Tax Reform? Maybe,” Politico, October 15, 2012.
68. Joseph Schumpeter, Business Cycles: A Theoretical, Historical and Statistical Analysis of the Capitalist Process (New York: McGraw-Hill, 1939).
69. Joseph Schumpeter, Capitalism, Socialism, and Democracy (New York: McGraw-Hill, 1942).
70. Robert M. Solow, “Technical Change and the Aggregate Production Function,” Review of Economics and Statistics (The MIT Press) 39, no. 3 (1957): 312–320.
71. Michael Greenstone and Adam Looney, A Dozen Economic Facts About Innovation (Washington, DC: The Hamilton Project, Brookings Institution, August 2011).
72. Paul Krugman, The Age of Diminished Expectations (Washington, DC: The Washington Post Company, 1990), 9–13.
73. Bronwyn Hall, “The Private and Social Returns to Research and Development,” in Technology, R&D, and the Economy, eds. Bruce L.R. Smith and Claude E. Barfield (Washington, DC: The Brookings Institution and the American Enterprise Institute, 1996), 146–148, 159.
74. Bronwyn H. Hall, Jacques Mairesse, and Pierre Mohhnen, “Measuring the Returns to R&D,” NBER Working Paper 15622, December, 2009. For an excellent review of the research into the effectiveness of the R&D credit, see Laura Tyson and Greg Linden, “The Corporate R&D Tax Credit and U.S. Innovation and Competitiveness: Gauging the Economic and Fiscal Effectiveness of the Credit,” Center for American Progress, January 2012.
75. Nicholas Bloom, Mark Schankerman, and John Van Reenen, “Identifying Technology Spillovers and Product Market Rivalry,” NBER Working Paper No. 13060, April 17, 2012.
76. Dominique Guellec and Bruno van Pottelsberghe De La Potterie, “R&D and Productivity Growth: Panel Data Analysis of 16 OECD Countries,” OECD Economic Studies 33 (2001): 103–126.
77. “R&D and Productivity Growth,” Background Paper, Congressional Budget Office, June 2005.
78. “The International Experience with R&D Tax Incentives,” testimony by the OECD before the Senate Finance Committee, September 20, 2011.
79. Luke A. Stewart, Jacek Warda, and Robert D. Atkinson, “We’re #27!: The United States Lags Far Behind in R&D Tax Incentive Generosity,” The Information Technology & Innovation Foundation, July 2012.
80. Tyson and Linden, “The Corporate R&D Tax Credit.”
81. Steven J. Markovich, “Promoting Innovation Through R&D,” Council on Foreign Relations, November 5, 2012.
82. Tyson and Linden, “The Corporate R&D Tax Credit,” 16–18.
83. Testimony of Kevin Hassett, American Enterprise Institute, before the House Science Committee’s Subcommittee on Technology, July 1, 1999.
84. The alternative simplified credit is currently set at 14 percent of R&D expenses in excess of 50 percent of a firm’s average R&D expenditures over the preceding three tax years.
85. Robert D. Atkinson, “Create Jobs by Expanding the R&D Tax Credit,” The Information Technology & Innovation Foundation, January 26, 2010.
86. Julie Pace, “Obama to Push for Research and Development Tax Credits,” Associated Press, September 5, 2010.
87. Atkinson, “Create Jobs by Expanding the R&D Tax Credit.”
88. Science and Engineering Indicators 2012, National Science Foundation, Chapter 4, Research and Development: National Trends and International Comparisons, Table 4-3.
89. Ibid.
90. OECD data.
91. Patrick J. Clemins, “Historical Trends in Federal R&D,” Chapter 2 in Research and Development FY 2012, American Association for the Advancement of Science, 2011.
92. “2013 Global R&D Funding Forecast,” Battelle and R&D Magazine, December 2012, 29. Also see Patrick Thibodeau, “China Set to Surpass U.S. in R&D Spending in 10 Years,” ComputerWorld, December 24, 2012.
93. Science and Engineering Indicators 2012, National Science Foundation. Chapter 4, “Research and Development: National Trends and International Comparisons,” Table 4-19.
94. Justin Hicks and Robert D. Atkinson, “Eroding Our Foundation: Sequestration, R&D, Innovation and U.S. Economic Growth,” The Information Technology & Innovation Foundation, September 2012. Also see Rafael Reif and Craig Barrett, “Science Must Be Spared Washington’s Axe,” Financial Times, February 25, 2013.
95. Chris Buckley, “China Confirms $1.7 Trillion Spending Plan,” Reuters, November 21, 2011.
96. C. Fred Bergsten, “An Overlooked Way to Create Jobs,” New York Times, September 28, 2011.
97. The U.S. has active free-trade agreements with Australia, Bahrain, Canada, Chile, Colombia, Costa Rica, the Dominican Republic, El Salvador, Guatemala, Honduras, Israel, Jordan, South Korea, Mexico, Morocco, Nicaragua, Oman, Panama, Peru, and Singapore.
98. Binyamin Appelbaum and Jennifer Steinhauer, “Congress Ends Five-Year Stand-Off on Trade Deals in Rare Accord,” New York Times, October 12, 2011.
99. “The Future of U.S. Trade Negotiations,” prepared Statement of Intel Corporation for the House Ways and Means Committee, February 29, 2012.
100. Chris Buckley and Terril Yue Jones, “East Asian Powers Set to Push Trade Pact Talks,” Reuters, May 12, 2012.
101. Andrew H. Card, Thomas A. Daschle, Edward Allen, and Matthew J. Slaughter, “U.S. Trade and Investment Policy,” Council on Foreign Relations, Independent Task Force Report No. 67, September 19, 2011.
102. World Trade Organization.
103. David Dollar and Aart Kraay, “Trade, Growth, and Poverty,” Development Research Group, World Bank, June 2001; Jeffery Frankel and David Romer, “Does Trade Cause Growth?,” World Bank, 1999; and Francisco Alcala and Antonio Ciccone, “Trade and Productivity,” World Bank, October 2001.
104. World Development Report (Washington, DC: World Bank, 1995), 55.
105. Martin Neil Baily and Robert M. Solow, “International Productivity Comparisons Built from the Firm Level,” Journal of Economic Perspectives 15, no. 3 (Summer, 2001): 151–172. Also see Robert Z. Lawrence, “Does a Kick in the Pants Get You Going or Does It Just Hurt? The Impact of International Competition on Technological Change in U.S. Manufacturing,” in The Impact of International Trade on Wages, ed. Robert C. Feenstra (Chicago: University of Chicago Press, 2000), 197–224.
106. The WTO was established in 1994 during the Uruguay round of trade negotiations—the eighth round of multinational negotiations held under the General Agreement on Tariffs and Trade (GATT). The purpose of the WTO is to administer GATT agreements and to settle disputes among WTO members. WTO membership now includes 159 nations.
107. Data in this paragraph from the Commerce Department.
108. U.S. Commerce Department, Bureau of Economic Analysis.
109. See C. Fred Bergsten, “The United States in the World Economy,” Peterson Institute for International Economics, Chautauqua Lecture Series, August 12, 2011.
110. Scott C. Bradford, Paul L.E. Grieco, and Gary Clyde Hufbauer, “The Pay-Off to America from Global Integration,” in The United States and the World Economy: Foreign Economic Policy for the Next Decade, ed. C. Fred Bergsten (Washington, DC: Institute for International Economics, 2005).
111. Martin Johnson and Chris Rasmussen, “Jobs Supported by Exports 2012: An Update,” Office of Competition and Economic Analysis, Department of Commerce, February 26, 2013. Salary data from the Office of the United States Trade Representative.
112. James K. Jackson, “Outsourcing and Insourcing Jobs in the U.S. Economy: Evidence Based on Foreign Investment Data,” Congressional Research Service, May 10, 2012.
113. Lori G. Kletzer, “Imports, Exports, and Jobs: What Does Trade Mean for Employment and Job Loss?” W.E. Upjohn Institute for Employment Research, 2002.
114. Matthew J. Slaughter, “Exports Sagging? Try Some Free Trade,” Wall Street Journal, January 22, 2013.
115. Helene Cooper, “Obama Sets Ambitious Export Goal,” New York Times, January 29, 2010.
116. Comments at Asia-Pacific Economic Cooperation Summit, Honolulu, Hawaii, November 12, 2011.
117. Binyamin Appelbaum, “The Quiet Driver of Economic Growth: Exports,” New York Times, January 27, 2012.
118. Philip Blenkinsop and Ethan Bilby, “EU, US to Start Free Trade Talks,” Reuters, February 13, 2013.
119. Jack Ewing, “Trade Deal Between U.S. and Europe May Come to the Forefront,” New York Times, November 25, 2012.
120. U.S. Chamber of Commerce estimate.
121. Stormy-Annika Mildner and Claudia Schmucker, “A Trade Deal Worth Making,” Wall Street Journal, February 13, 2013. Also see David Cameron, “A British-American Tax and Trade Agenda,” Wall Street Journal, May 12, 2013.
122. Martin Wolf, “In the Grip of a Great Convergence,” Financial Times, January 4, 2011.
123. Andrew H. Card, Thomas A. Daschle, Edward Allen, and Matthew J. Slaughter, “A Pro-Trade Agenda for U.S. Jobs,” Wall Street Journal, September 17, 2011.
124. U.S. Department of Commerce data.
125. U.S.-China Business Council.
126. For information on exports to China from all 50 states and all 435 Congressional districts, including links to local news stories on U.S. companies doing business with China, see https://www.uschina.org/public/exports/2000_2011/state-alphabetical-list.html. Also see Keith B. Richburg, “U.S. Exports to China Boom, Despite Trade Tensions,” Washington Post, March 11, 2012.
127. David E. Sanger, “In Cyberspace, New Cold War,” New York Times, February 24, 2013.
128. See “WTO Successfully Concludes Negotiations on China’s Entry,” press release, WTO, September 17, 2001.
129. See Nicholas R. Lardy, “Issues in China’s WTO Accession,” testimony before the U.S.-China Security Review Commission, May 9, 2001.
130. Originally called the U.S-China Strategic Economic Dialogue (SED), and led initially by Treasury Secretary Henry M. “Hank” Paulson and Chinese Vice Premier Wang Qishan. A central focus of the SED was accelerating financial reform in China. Upon taking office, the Obama Administration renamed the Dialogue as the “Strategic and Economic Dialogue,” broadening the talks to include other issues such as human rights, environmental issues, security issues, and diplomatic cooperation.
131. Our work and background with regard to China stems from our participation in Engage China, a coalition that the Financial Services Forum has chaired since 2006. Engage China is a coalition of 12 financial services trade associations united in support of high-level engagement between the United States and China, with a particular emphasis on accelerated financial reform and modernization in China.
132. Simon Rabinovitch, “China Forecast to Overtake US by 2016,” Financial Times, March 22, 2013.
133. Statement of Henry M. Paulson, Secretary of the Treasury, press briefing following the announcement of the U.S.–China Strategic Economic Dialogue, Beijing, China, September 21, 2006.
134. See John R. Dearie, “China’s Financial Conditions and Their Impact on U.S. Interests,” testimony before the U.S.–China Economic and Security Review Commission, March 7, 2013.
135. “China 2030: Building a Modern, Harmonious, and Creative High-Income Society,” World Bank, February 27, 2012. Also see Bob Davis, “New Push for Reform in China,” Wall Street Journal, February 23, 2012.
136. For an insightful analysis of the reasons for declining public support for freer trade policies, see Andrew H. Card, Thomas A. Daschle, Edward Allen, and Matthew J. Slaughter, “U.S. Trade and Investment Policy,” Council on Foreign Relations, Independent Task Force Report No. 67, September 19, 2011, 22–29.
137. Ronald G. Shafer, the Wall Street Journal/NBC News Poll: A Special Weekly Report from the Wall Street Journal’s Capital Bureau, Wall Street Journal, December 17, 1999; and Janet Hook, “Senate Outsourcing Bill Stalls,” Wall Street Journal, September 29, 2010.
138. Robert E. Baldwin, John H. Mutti, and J. David Richardson, “Welfare Effects on the United States of a Significant Multilateral Tariff Reduction,” Journal of International Economics 10, no. 3 (1980): 405–423; and Stephen P. Magee, “The Welfare Effects of Restrictions on U.S. Trade,” Brookings Papers on Economic Activity 3 (1971): 645–701.
139. See Kenneth F. Scheve and Matthew J. Slaughter, “A New Deal for Globalization,” Foreign Affairs, July/August 2007, 34–47.
140. Grant D. Aldonis, Robert Z. Lawrence, and Matthew J. Slaughter, “Succeeding in the Global Economy: A New Policy Agenda for the American Worker,” Policy Research Paper, The Financial Services Forum, June 26, 2007. Also see Matthew J. Slaughter and Robert Z. Lawrence, “More Trade More Aid,” New York Times, June 8, 2011.
141. “Extended Mass Lay-Offs,” Tables 2 and 10, Bureau of Labor Statistics. Also see “Few Mass Lay-Offs Are Due to Overseas Competition,” The Heritage Foundation, February 4, 2011.
142. “Trade Adjustment Assistance: Changes to the Workers Program Benefited Participants, but Little Is Known about Outcomes,” Government Accountability Office, September 2012.
143. “Trade Adjustment Assistance for Workers,” Fiscal Year 2011 Report to the Senate Finance Committee and House Ways and Means Committee.