In this chapter, you’ll learn about troubleshooting methodologies for complex problems. This chapter provides general guidelines for solving problems above the simple “Is it plugged into the network?” or “Did you switch it on and off again?” In this chapter, you’ll also learn about some of the built-in command line as well as Sysinternals tools, which you can use to diagnose problems.
Troubleshooting methodology
There are a couple of tricks to troubleshooting problems. The first is to realize that you’ll be far more effective at troubleshooting if you approach the problem systematically, rather than just trying random solutions.
The next is that, jokes aside, there is far more to IT troubleshooting than typing some problem characteristics into (this being a Microsoft Press book) Bing and diligently applying any solution that turns up.
Some problems with the search engine approach include:
Posts often provide an incomplete description of problem symptoms. This is often because the person asking for help in the post hasn’t developed a full understanding of the nature of the problem that they are trying to solve by posting a request for help.
Unless you understand all the symptoms, it’s possible that the post and the proposed solution aren’t relevant to the problem that you are troubleshooting.
Even when other posters in the same thread respond that the solution worked for them, you can’t be certain that they had the same problem as you or that they implemented the solutions proposed in responses to the post correctly.
This doesn’t mean that you can’t find the solution to a complex problem by consulting online forums; it’s just that you should treat solutions offered to other people’s problems with an appropriate degree of skepticism. Solutions posted on the Internet might work or they might not but finding out through experimentation on your production environment probably isn’t the best way to display your technical aptitude.
Redeployment
When I started in IT, I’d often spend hours, if not days, troubleshooting a problem with a server or desktop computer because each computer had a unique configuration, which meant deploying from scratch would take substantially longer. Not only would it be necessary to reinstall the operating system, but it would be necessary to locate the correct drivers, something that was a lot more challenging in the early days of the web when many hardware vendors weren’t online, let alone providing websites with easy-to-locate driver downloads. With early versions of Windows, it was often necessary to keep boxes of disks around containing drivers to support each hardware configuration. The process of installing server applications was often similarly fraught. Vendor documentation was scarce, and other than the occasional helpful newsgroup post, there wasn’t much help available online when it came to troubleshooting. Getting a server up and running in the 90s could be such an involved process that you would take the time to troubleshoot whatever problem you had as much as possible and only redeploy the workload when all other avenues were exhausted.
With Windows Server 2019, most drivers utilized by the operating system are included or are easily accessible on vendor websites. It’s relatively straightforward to back up and reinstall applications, and the web provides a cornucopia of documentation and advice on troubleshooting existing workloads.
If a workload with a known configuration has worked in the past and is still experiencing errors now, one of the options that you have at your disposal is to redeploy rather than spend time troubleshooting. With tools such as desired-state configuration, Puppet, or Chef, it’s quite likely that you can redeploy in less time than it takes you to diagnose, research, and solve the problem you face.
The trick with all this is that you need to have workload configuration and deployment highly automated. Building out that configuration automation will take a substantial amount of time, and you will need to ensure that the configuration automation is updated each time you update the configuration of the workload in question. The argument for this approach is easy to make if you have a large number of servers with similar configurations. In scenarios where you are only dealing with a small number of servers and where each workload is unique, you may end up spending more time automating configuration than you ever would deploying servers.
You’ll also need to ensure that data is decoupled properly from the workload. A long-term aspirational goal of any server administrator should be to automate the configuration of any workload that they manage, so that they can redeploy it quickly in another VM or on another physical chassis should something catastrophic happen with the original workload. It’s likely that you are far from that goal at the moment in your own environment, but as you get closer to it, you’ll find that redeployment as a troubleshooting step becomes a viable first response strategy to complex problems. Admittedly, if it works, redeployment doesn’t answer the tricky question of what might have caused the problem in the first place. However, if it does work, you can ponder the question of what actually happened as an existential problem, rather than as a practical one.
In some cases, redeploying the workload from what is believed to be a good configuration will not solve the issue. In that scenario, you’ll need to perform a deeper investigation as to what is causing the problem.
Symptoms and diagnosis
Before you can solve a problem, you need to understand the nature of the problem. The first step in understanding the nature of a complex problem is to have an understanding of the symptoms of that problem.
The easiest symptoms to document are the ones that caused you to notice that there was a problem in the first place. The thing that is important to realize is that there are likely to be other symptoms present that you might not have noticed. Understanding all these symptoms and their relationship with one another will allow you to diagnose the cause and resolution of the problem. It might be that the first thing you notice about a problem is only tangential to that problem. By investigating further, you discover that far more problematic things are occurring than the thing that drew your attention to the problem in the first place.
A diagnostic hypothesis is a hypothesis as to what might be causing the problem. It’s what you suspect may be causing the problem before you have verification that what you suspect is causing the problem is actually causing the problem.
Rather than latching on to the first diagnostic hypothesis that occurs to you, try to list other things that might also be causing the problem. When thinking up other things, you’re likely to gain more of an understanding about how you should be investigating the problem. You’ll be looking at the problem more broadly, rather than focusing on the symptoms that first came to your attention.
You want to get as much evidence as possible about what’s causing the problem before you try to solve it. As every experienced IT person knows, applying the wrong solution to a problem can often make the problem worse. By having as much information about the problem as possible, you reduce the chance that you’ll apply an incorrect solution when attempting to solve the problem.
Dependencies
There’s an old IT Pro joke that “it’s always DNS.” The foundation of this joke is that almost everything in IT is dependent on DNS, so if an apparently unrelated system, workload, or service isn’t functioning, the cause of that malfunction may actually be that DNS isn’t working. So, even though it’s a bit of a joke, before troubleshooting any complex problem, it probably doesn’t hurt to fire up a console and run nslookup.
On a more serious note, systems, workloads, and services rarely stand alone, and they almost always depend on other things. As another part of your troubleshooting and diagnostic process, determine the dependency chain of the issue that you are troubleshooting. Working out the dependency chain will give you more items against which to test your hypothesis. It may also allow you to discover more symptoms of the problem than you were initially aware of.
For example, if a Windows Service has failed and won’t start, determine what the service is dependent on. You can determine what Windows Service depends on, and what is dependent on that service, by looking on the Dependencies tab of the service’s Properties, as shown in Figure 23-1.

Figure 23-1 Service Dependencies
Ranking hypothetical solutions
A solution is hypothetical until it works. While simple problems often have obvious solutions, complex problems are likely to have a variety of apparent solutions, and you generally won’t know which is the appropriate solution until you’ve applied it and found that it works. Before you apply a hypothetical solution in an attempt to solve a problem, you should rank the hypothetical solutions. Consider the following factors when ranking the order in which you should apply hypothetical solutions:
Rank hypothetical solutions that are simple to implement and involve minimally changing the existing configuration higher than solutions that involve substantial changes to the existing configuration. This is because if the hypothetical solution turns out to be incorrect, you’ll need to roll back the configuration changes before trying the next hypothetical solution. This is easier to do if the changes are less complicated than it is to do with a complex set of configuration changes. If a solution doesn’t work, you need to go back to where you started rather than continuing to make further configuration changes when a solution you tried didn’t work.
Rank hypothetical solutions for which you have more evidence higher than solutions where there isn’t as much evidence. As mentioned earlier, try to figure out what other evidence you should see if your hypothesis about what is causing the problem is correct rather than just focusing on the symptoms that brought the problem to your attention in the first place. Try to think of ways to disprove a diagnostic hypothesis without taking invasive action. It’s better to discard an incorrect solution before implementing it because you find evidence that indicates that it is impossible than to try the incorrect solution in your production environment and find out that it doesn’t work.
Rank hypothetical low-impact solutions above solutions that are high impact. Always keep in the back of your mind that applying a solution could make things worse, so give preference to the solutions that will cause fewer problems if things go wrong than solutions that might require you to stay at work longer because a solution goes wrong.
Rank hypothetical solutions that require a shorter amount of time to implement above solutions that take much longer to implement. When you don’t know which solution will solve your problem, you are better off trying the one that takes a couple of minutes over the one that takes a couple of hours.
Applying solutions
As mentioned earlier, it’s important that when you apply a hypothetical solution and it doesn’t resolve the problem, you find a way to revert to the configuration that existed prior to attempting the hypothetical solution. If you are diagnosing problems with a workload in a virtual machine, you should use snapshots or checkpoints to roll back to the “last known-bad” configuration, which is much better than building a “completely undocumented and worse” configuration.
Avoid trying a number of different hypothetical solutions that don’t pan out and involve you making a large number of undocumented configuration changes to your production servers. When you continually modify the configuration of one server in an attempt to resolve one problem, you might end up causing a host of other problems.
So, before applying any solution, ensure that you have a rollback strategy that will allow you to return to the current configuration. Put another way, always ensure that you have an escape route for when your meticulously crafted plans go wrong.
The other thing you should do before applying any solution is to have developed a set of criteria to determine what constitutes a resolution of the problem that you are trying to troubleshoot. You need to know what the problem resolution will look like. You should also test whether any of the characteristics of what you have decided constitutes the resolution are present before you apply the resolution. If you don’t do this, it’s entirely possible that part of your benchmark for declaring the problem solved may have been met before you attempted the solution. This can lead you to believe that you’ve solved a problem when the problem is still present. Alternatively, finding that one of your benchmarks for declaring the problem is solved prior to implementing a solution might provide further evidence that you don’t fully understand all the characteristics of the problem.
Command-line tools
Windows Server includes a large number of command-line tools. While PowerShell is usually the first thing younger IT Pros think of when someone suggests doing work at the Windows Server command prompt, some of the older tools that are still included with the operating system can be useful when diagnosing and resolving problems. These commands can be a bit idiosyncratic, each having its own way of functioning; however, they often allow you to accomplish something with a single command that might take a short script in PowerShell.
Rather than provide a list of each command (which you can find on the docs.microsoft.com website and is linked below), here are some select commands that you’re likely to find useful when troubleshooting. Once you find one that sounds like it might be useful, you can dig in and see how it works, either by running it from the command prompt or by checking the online reference.
Arp.exe. Manage the address resolution protocol cache.
At.exe. Used to schedule tasks. Can also use schtasks for this purpose.
Attrib.exe. Used to manage attributes assigned to files or directories.
Auditpol.exe. Use this command to view information related to audit policies.
Bcdboot.exe. Repair and manage the boot environment on the system partition.
Bcdedit.exe. Manage the boot configuration data (BCD) stores.
Certreq.exe. Manage certificate requests and interact with a certification authority.
Certutil.exe. Can be used to configure, backup, and restore a certificate authority. Can also be used to manage local certificates.
Chkdsk.exe. Troubleshoot file system for logical and physical errors.
Chkntfs.exe. Manage automatic disk checking when system starts.
Cipher.exe. Manage encryption of files and directories on NTFS volumes.
Clip.exe. Redirects command-line output to the Windows clipboard.
Comp.exe. Compare two files.
Compact.exe. Manage the compression of files and directories on NTFS volumes.
Cscript.exe. Starts a script that executes in the command-line environment.
Date.exe. Sets the system date.
Dcgpofix.exe. Regenerates the default group policy objects for a domain.
Dfsrmig.exe. Migrates SYSVOL replication from file replication services to distributed file system replication (DFSR).
Diskshadow.exe. Manage volume shadow copy services.
Dnscmd.exe. Manage DNS servers.
Driverquery.exe. Lists all device drivers installed on the computer.
Eventcreate.exe. Create custom events in event logs.
Find.exe. Search text files or text output for a specific string.
Findstr.exe. Search text files and text output using regular expressions.
Format.exe. Format a volume.
Fsutil.exe. Manage volumes and file systems. Fsutil.exe with the file parameter allows you to find files by properties, such as locating all files owned by a specific user. Fsutil.exe with the repair parameter allows you to manage NTFS self-healing operations without having to run chkdsk.exe. Fsutil.exe with the tiering parameter allows you to manage storage tier functionality.
Getmac.exe. Returns MAC address and protocols associated with specific network adapters.
Gpfixup.exe. Repair domain name dependencies in group policy objects and group policy links after a domain has been renamed.
Gpresult.exe. Display cumulative group policy information for a specific user or computer.
Gpupdate.exe. Refreshes group policy settings.
Hostname.exe. View the computer’s name.
Icacls.exe. Manage discretionary access control lists on files.
Ipconfig.exe. View TCP/IP configuration settings. Can also be used to refresh DHCP settings.
Klist.exe. View a list of cached Kerberos tickets.
Ksetup.exe. Manage the Kerberos protocol and key distribution center for Kerberos realms.
Ktmutil.exe. Kernel transaction manager utility.
Ktpass.exe. Configure the Service Principal Name for a host or service in Active Directory.
Lodctr.exe. Configure performance counter registry settings.
Logman.exe. Manage Event Trace Sessions and Performance logs.
Logoff.exe. Kick a user off a Remote Desktop Session Host session and terminate their session.
Manage-bde.exe. Manage BitLocker.
Mklink.exe. Manage symbolic links.
Mountvol.exe. Manage volume mount points.
Msiexec.exe. Perform operations on Windows Installer files.
Nbtstat.exe. Displays protocol information about NetBIOS over TCP/IP.
Netcfg.exe. Manage the Windows Preinstallation Environment (WinPE).
Netsh.exe. A command-line environment for managing network configuration.
Netstat.exe. View information about TCP connections, networking statistics, and IP routing information.
Net print. Manage print jobs and queues
Nlbmgr.exe. Manage network load-balancing clusters.
Nslookup.exe. View DNS information.
Openfiles.exe. Display a list of open files and directories. Also can be used to disconnect a user from a remotely open file.
Pathping.exe. Functions similarly to a combination of traceroute.exe and ping.exe.
Ping.exe. Network diagnostic utility that uses ICMP to verify connectivity to another host.
Pnpunattend.exe. Manage drivers installed on the system.
Pnputil.exe. Manage the system’s driver store.
Prndrvr.exe. Manage printer drivers.
Prnjobs.exe. Manage print jobs.
Prnmngr.exe. Manage printers.
Prnqctl.exe. Manage printer queues.
Pubprn.exe. Manage publication of printers to Active Directory.
Recover.exe. Recover readable information from a defective volume.
Reg.exe. Manage registry entries.
Regsvr32.exe. Register dll files with the registry.
Repair-bde.exe. Recover data from a damaged Bitlocker encrypted volume.
Schtasks.exe. Manage scheduled tasks.
Secedit.exe. Analyze security configuration against a security template.
Servermanagercmd.exe. Menu driven command-line utility for server configuration.
Sfc.exe. Verify the integrity of protected system files. Will replace problematic versions with updated versions.
Showmount.exe. View mounted directories.
Subst.exe. Allows you to associate a path with a volume letter.
Systeminfo.exe. View system information at the command line.
Takeown.exe. Recover access to a file by making an administrative account owner of the file.
Taskkill.exe. Terminate a specific process from the command line.
Tasklist.exe. View a list of running processes.
Time.exe. Manage system time.
Tracerpt.exe. Manage Event Trace Logs as well as log files created by Performance Monitor.
Tracert.exe. Determine the path between the host and a remote system.
Tree.exe. View a graphical representation within the command-line environment of the directory structure.
Tzutil.exe. Manage the time zone settings.
Verifier.exe. Manage driver verification.
Wbadmin.exe. Manage backup.
Wdsutil.exe. Manage Windows Deployment Services.
Wecutil.exe. Manage event subscriptions.
Wevutil.exe. Manage information about event logs and publishers.
Where.exe. Locate files based on search keywords.
Whoami.exe. Provides information about the currently signed-on user identity.
Winrs.exe. Can be used to remotely manage and execute programs.
Wmic. Manage WMI information from the command prompt.
Wscript.exe. Windows Script Host is an environment through which scripts can be run.
Sysinternals tools
The Sysinternals tools are a collection of utilities that you can use to diagnose and troubleshoot Windows Server 2019 as well as other Windows Server and client operating systems. The tools are hosted on Microsoft’s website and can be used to interact not only with the GUI version of Windows Server 2019, but many of the tools can also be used with the Server Core version, either directly or remotely. In the following pages, you’ll learn about several of the Sysinternals tools that you might find useful in troubleshooting and diagnosing your Windows Server 2019 deployment.
Process Explorer
Process Explorer, shown in Figure 23-2, allows you to view real-time information about how processes are interacting with resources on a particular computer. Process Explorer can be thought of as a highly advanced version of the built in Task Manager tool. You can use Process Explorer to determine which processes have a specific file open. Process Explorer also allows you to determine which handles a specific process has open, as well as allowing you to see which DLLs and memory-mapped files have been loaded by a specific process.

Figure 23-2 Process Explorer
Process Explorer includes the following functionality:
Tree view. This allows you to see the parent–child relationships between processes.
Color coding. Allows you to visually determine the process type and state, with services, .NET processes, suspended processes, and processes running using the same credentials as the user running Process Explorer each being assigned a separate color code.
Fractional CPU reporting. Shows where processes are consuming minimal amounts of CPU resources, rather than being rounded down to zero, which might imply that the processes were completely inactive.
Suspicious process identification. Process Explorer will highlight processes that are flagged as suspicious by VirusTotal.com, an anti-malware service.
DLL and mapped file identification. Identification of all DLLs and mapped files loaded by a process.
Kernel object handle identification. Identification of all handles to kernel objects opened by a process.
Identifying open handles. Ability to determine which processes have open handles to kernel objects, including files and folders.
Identifying processes loading specific DLLs. Ability to determine which processes have loaded a specific DLL.
Viewing process threads. View process threads, including start addresses and stacks.
Managing processes. Modify a process’s priority, suspend the process, and terminate a process or a process tree.
Process dumps. Create a process dump.
Process Monitor
Process Monitor is a real-time monitoring tool that you can use to view file system, registry, and process/thread activity. You can configure Process Monitor to log data to a file for later analysis, and Process Monitor logging supports scaling to tens of millions of captured events and gigabytes of log data. Process Monitor also includes the ability to capture thread stacks for specific operation, allowing you to determine the root cause of an operation. You can also capture the details of processes including image path, command line, related user or service account, and session ID. Process Monitor is shown in Figure 23-3.

Figure 23-3 Process Monitor
ProcDump
ProcDump is a command line utility that you can use to monitor a specific application for CPU utilization spikes. You can then generate diagnostic dumps during the spike that allow a developer to determine what causes the spike. ProcDump includes hung-window monitoring and unhandled exception monitoring, and it can be configured to trigger diagnostic dumps based on the values of specific system performance counters.
PsTools
The PsTools Suite is a collection of tools named after the UNIX operating system PS utility rather than Microsoft’s more recent PowerShell administrative scripting language. You can download the PSTools Suite in its entirety from Microsoft’s website or download individual tools as you need them. Some tools in the PSTools Suite have functionality that is mirrored by Windows Server 2019 command-line utilities or PowerShell cmdlets. The PSTools Suite has been around since the Sysinternals Tools were first released in the 1990s. The command-line utilities and PowerShell cmdlets only became available more recently. Tools included in the PSTools Suite are as follows:
PsExec. Enact processes remotely
PsFile. View files that have been opened remotely
PsGetSid. View the SID of a user or computer
PsInfo. View system information
PsPing. Covered in detail later in this chapter, this allows you to measure network performance
PsKill. Terminate processes on the basis of name or process ID
PsList. Determine detailed information about active processes on a system
PsLoggedOn. Determine which accounts are signed on locally and through resource sharing
PsLogList. Extract event log records
PsPasswd. Change account passwords
PsService. View and manage services
PsShutdown. Shut down or reboot a computer
PsSuspend. Suspends a running process
Note that some anti-malware tools will flag utilities in the PSTools Suite as malware. This is because some malware toolchains include and leverage utilities in the PSTools Suite. If you are concerned that one of the utilities in the PSTools Suite is malware, use the SigCheck utility, covered later in this chapter, to verify the integrity of the tool in question.
VMMap
VMMap allows you to analyze physical and virtual memory utilization. You can use VMMap to view a specific process’s committed virtual memory types and the amount of physical memory (working set) that the operating system has allocated to the process. VMMap is useful when you need to troubleshoot application memory utilization. Figure 23-4 shows VMMap used to analyze the application ADExplorer.exe.
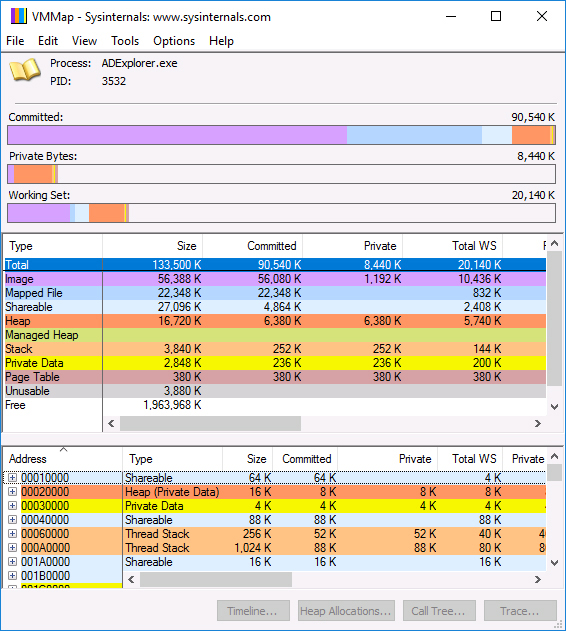
Figure 23-4 VMMap
SigCheck
Sigcheck is a command-line utility that allows you to view the following information:
File version number
Time stamp
Digital signature details, including certificate chains
Sigcheck also allows you to check a file’s status in VirusTotal, a database that scans against 40 separate antivirus engines. You can also use SigCheck to upload the file to be scanned by VirusTotal. Use SigCheck when you suspect a file may have been tampered with or may, for some other reason, not be legitimate. Figure 23-5 shows SigCheck used to check the signature of the file c:Windows otepad.exe.

Figure 23-5 SigCheck
AccessChk
AccessChk is a command line utility that allows you to determine what access user, service, or group accounts have to specific files, folders, registry keys, or Windows services. Using the Accesschk -? command provides a list of all options that can be used, as shown in Figure 23-6.

Figure 23-6 AccessChk options
Sysmon
System Monitor (Sysmon) is a service and device driver that you can install on Windows Server 2019 that monitors and logs system activity to the event logs. Sysmon will remain installed and running across reboots. Sysmon allows you to identify anomalous or malicious activity. It is used by security experts to determine how malware and malicious actors operate when compromising a computer. It is important to understand that while Sysmon monitors and logs potentially hostile activity, it provides no method for you to analyze that activity. A competent attacker will be able to determine that Sysmon is present on a computer and will take appropriate countermeasures.
Sysmon includes the following functionality:
Logs the creation of processes. This includes information about the command line for the currently created process as well as any parent process.
Creates a hash of the process image file. The default is SHA1, but you can configure Sysmon to use MD5, SHA256 or IMPHASH. You can have multiple hashes created for the same process image file.
Logs the loading of drivers and DLLS. Records driver signatures and DLL hashes.
Includes a GUID for each process. This allows you to track activity when Windows Server reuses process IDs for different processes over time.
Includes a GUID related to each session. This allows you to correlate events to specific logon sessions.
Log raw disk access. Logs opens when a raw read access to disks and volumes occurs.
Log network connections. Data written to the log includes connection source processes, IP addresses, port numbers, host names used, and port names.
Detects modifications made to file creation time. Malware and intruders often modify file creation timestamps when cleaning up evidence of a breach.
Reloads configuration. Reloads configuration if the configuration is modified in the registry.
Supports rule filtering. This allows you to include or exclude specific events from being monitored and logged.
Allows you to generate events during the system startup process. This allows you to capture activity caused by kernel-mode malware.
Sysmon events are stored in the Applications and Services LogsMicrosoftWindowsSysmonOperational log folder, as shown in Figure 23-7.

Figure 23-7 Sysmon events
Table 23-1 lists important event IDs generated by Sysmon.
Table 23-1 Important Sysmon Event IDs
Event ID |
Description |
1: Process creation |
Includes detailed information about newly created processes. Includes the ProcessGUID field that uniquely identifies the process. Hash generated is a full hash of the associated file using the configured hashing algorithms. |
2: A process changed a file creation time |
An event generated when file creation time is modified by a process. You can even use this to track the accurate creation time of a file. Intruders often alter file creation times in an attempt to mask malware to make it look as though it was part of the original operating system installation. It is important to note that many standard processes alter file creation times, and it will be necessary to investigate further to determine if the change was part of standard operating system behavior or malicious activity. |
3: Network connection |
Logs TCP and UDP connections to the server. This option is disabled by default when you install Sysmon. When enabled, each connection is associated with a ProcessID and ProcessGUID. Event will record source, destination host names, IP addresses, and port numbers. |
4: Sysmon service state changed |
Records when the Sysmon service starts or stops. |
5: Process terminated |
Records when a process terminates. |
6: Driver loaded |
Records when a driver has loaded. Provides hash and signature information for the driver. Signatures will be created asynchronously to minimize performance impact. |
7: Image loaded |
Records when a process loads a specific module. It is disabled by default when Sysmon is installed and must be manually enabled. It generates hash and signature information asynchronously to minimize performance impact. Only enable with appropriate filtering, because enabling this process will cause a large number of events to be written to the monitoring log. |
8: CreateRemoteThread |
Records when one process creates a thread in another process. This is one strategy used by malware when it injects code to hide it in the execution of another process. Event records both the source and target process. Provides information on the code that runs in the new thread, including StartAddress, StartModule, and StartFunction. |
9: RawAccessRead |
Records when a process performs read operations from storage using the \. denotation. This technique is tracked because it is often used by malware when exfiltrating files locked for reading. It also avoids most file access auditing technologies. The event records the source process and target device. |
10: ProcessAccess |
Records when one process opens another process, which may involve queries reading or writing data in the address space of the target process. This event ID often records hacking tools that copy the contents of memory used by processes such as the Local Security Authority (Lsass.exe) as part of a Pass-the-Hash attack. Enabling this type of auditing will generate a substantial number of events if diagnostic utilities that query the state of processes are being used on the server. In that case, create filters to remove this expected access. |
11: FileCreate |
Records when a file is created or overwritten. This is useful when investigating the status of autostart locations as well as temporary and download locations. These locations are often used by attackers when storing malware during initial server compromise events. |
12: RegistryEvent (Object create and delete) |
Registry modification events, where keys and values are created or deleted, are mapped to this event. Use this event to determine if malware has made modifications to the registry. |
13: RegistryEvent (Value Set) |
Registry modification events, where values are changed. The changes are written as event data. |
14: RegistryEvent (Key and Value rename) |
Registry modification events, where keys and values are renamed. Name changes are written as event data. |
15: FileCreateStreamHash |
Records when a named file stream is created. Creates a hash of the contents of the file. Useful to track malware variants that use browser downloads to drop executables or configuration settings. This problem is less likely to occur if you deploy Server Core, as the web browser is not available. |
255: Error |
Generated when Sysmon experiences an error. May occur if Sysmon is under extreme load. |
AccessEnum
AccessEnum allows you to determine where a file, directory, or registry key has separate permissions from its parent object. This allows you to view where permissions have been configured at the object level rather than where the object has inherited the permission from the parent level. This sort of configuration is almost always done manually, although it won’t be obvious unless surfaced by a tool such as AccessEnum. Figure 23-8 shows where one executable in a directory has different permissions applied to that of the parent directory.

Figure 23-8 AccessEnum
ShellRunAs
ShellRunas provides you with the ability to quickly launch applications, including cmd.exe and PowerShell sessions, using the credentials of other users by right-clicking and selecting Run As Different User from the context menu. You must run shellrunas /reg from an elevated command prompt to register ShellRunas with the computer. Figure 23-9 shows ADExplorer.exe being configured to run with alternate credentials.

Figure 23-9 ShellRunAs
LogonSessions
LogonSessions is a command-line utility that allows you to view the activity of all active sessions on a Windows Server 2019 system. When used with the -p option, as shown in Figure 23-10, you’re also able to see which processes are running in each session. This tool can also be used when connected to a remote PowerShell session to determine which active sessions are present on a server.
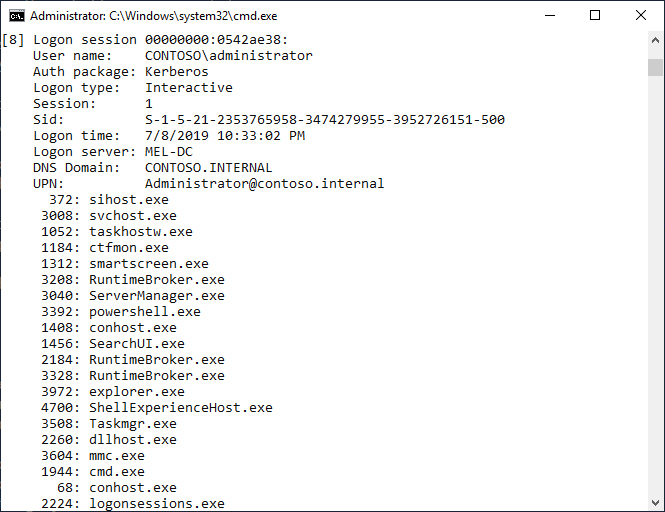
Figure 23-10 Logon Sessions
Active Directory Explorer
Active Directory Explorer (AD Explorer) provides you with a detailed view of and ability to edit Active Directory objects. It’s in some ways a more advanced and substantially more user-friendly version of the ADSIEdit utility that is built in to Windows Server 2019. You can use AD Explorer to view Active Directory object properties and attributes, as shown in Figure 23-11.

Figure 23-11 Active Directory Explorer
You can also use AD Explorer to save snapshots of the AD database for offline viewing. You can also use the tool to directly compare separate snapshots of the AD database, which can be very useful in recovery scenarios where you have several copies of the AD database and are unsure which version to restore to your production environment.
When connecting to a live AD instance, specify the domain name, user name, and password as shown in Figure 23-12. You can also save connection properties, allowing you to reconnect to different domains as necessary.

Figure 23-12 Connect to AD Database
When you specify the domain name, AD Explorer will connect to a domain controller in the same site. If you want to connect to a specific domain controller, you can specify the address of the domain controller using FQDN or the IP address. In addition to mounting existing snapshots of the Active Directory database, you can also use AD Explorer to connect to AD LDS instances.
You can use AD Explorer to rename or delete objects. You can also view and modify individual attributes of an object on the Attributes tab of the object’s properties, as shown in Figure 23-13.

Figure 23-13 Object properties
You can also use AD Explorer to create new objects. When you create a new object, you must specify which class it belongs to, as shown in Figure 23-14. Object names must begin with the designator CN= and must be unique within the container in which you create the object. The object’s attribute list will automatically be created and set based on the attributes that are mandatory for the class of object that you have selected. Depending on the class you select, you’ll need to configure several of these objects before you can successfully create the object.

Figure 23-14 Create object
Insight for Active Directory
ADInsight (Insight for Active Directory) allows you to monitor LDAP traffic. You can use ADInsight to resolve problems with Windows authentication, DNS, and other applications and services that interact with Active Directory.
ADInsight allows you to troubleshoot LDAP traffic by intercepting calls that applications make to the wldap32.dll library. This library is the foundation used for Active Directory APIs including ADSI and ldap. ADInsight differs from traditional network monitoring tools in that it will intercept and interpret all Active Directory related client-side APIs. This includes those Active Directory related client-side APIs that do not directly transmit data to a domain controller. When used with administrator privileges, ADInsight allows you to monitor Windows services and other system processes.
PsPing
You can use PsPing as an advanced network diagnostic utility that has a superset of the ping.exe utility’s functionality. PsPing allows you to measure TCP ping, network latency, and network bandwidth. PsPing can report information to within 0.01 milliseconds, which is 100 times more accurate than the standard Ping utility. Use the following commands to determine information about each mode:
Psping -? i. Provides information on ICMP ping functionality.
Psping -? t. Provides information on TCP ping functionality.
Psping -? l. Provides information on TCP/UDP latency tests.
Psping -? b. Shown in Figure 23-15, provides information on TCP/UDP bandwidth tests.

Figure 23-15 PsPing bandwidth check
RAMMap
RAMMap provides advanced information about how physical memory is used on computers running Windows operating systems. The separate tabs of RAMMap provide the following information:
Use Counts. Shown in Figure 23-16, this tab provides summary information by type. Categories include Process Private, Mapped File, Sharable, Page Table, Paged Pool, Nonpaged Pool, System PTE, Session Private, Metafile, Address Windowing Extension (AWE), Driver Locked, Kernel Stack, Large Page, and Unused.

Figure 23-16 RAMMap Use Counts
Processes. Provides information about the size of process working sets. Includes information about PID, Private memory, Standby, Modified, Page Table, and Total physical memory utilization.
Priority Summary. Shows the size of prioritized standby lists. If items with priority 5 and higher show high repurpose counts, it’s likely that the server is under memory pressure and would likely benefit from the addition of more physical memory.
Physical Pages. Shows per page information of all physical memory in the computer. Provides physical page information including physical address, list membership, allocation type, priority, whether the page stores part of an image, offset within a page table, file name of mapped file, originating process, virtual address, and any paged and nonpaged memory pool tag.
Physical Ranges. Lists the physical ranges used in terms of start address, end address, and overall size.
File Summary. Provides details of files that are stored in physical memory.
File Details. Shown in Figure 23-17, displays memory pages in physical RAM on a per file basis.

Figure 23-17 RAMMap File Details
You use RAMMap when you need to understand how Windows Server 2019 manages memory. For example, you can use it to determine how physical memory is allocated to a specific process or file. You can search memory for a specific file or process by using Ctrl+F. You can also RAMMap to take snapshots of how physical memory is being allocated at a specific point in time for later analysis. You can also use RAMMap to purge portions of RAM when testing memory management scenarios.